COMPARISON OF LASER SCANNING, PHOTOGRAMMETRY AND SFM-MVS
PIPELINE APPLIED IN STRUCTURES AND ARTIFICIAL SURFACES
D. Skarlatos a, *, S. Kiparissi a
a
Dept. of Civil Engineering and Geomatics, Cyprus University of Technology, P.O. BOX 50329, Limassol 3603, Cyprus – (dimitrios.skarlatos, stavroula.kiparissi) @cut.ac.cy
Commission III, WG 4
KEY WORDS: Comparison, Laser scanning, Image based modelling,open source, accuracy, 3D reconstruction
ABSTRACT:
The merging of photogrammetry and computer vision has raised discussions regarding its ability to produce very dense point clouds, comparable, under circumstances to terrestrial laser scanning (TLS). This paper approaches this issue in terms of accuracy, density, methodology and ease to use. Three tests have been conducted to evaluate the process as well as data density, quality, registration and methodology. At the first test a 300mm sphere with texture has been used as a reference object is order to address data quality using image based techniques. Menci's Zscan was tested against the Bundler-PMVS work flow. The second test is a flat building facade, where Zscan, TLS and Bundler-PMVS are compared directly. The last test was contacted in an electricity power station which was an extremely complex structure. Two TLS stations were compared against 212 Bundler-PMVS photos. Quantitative comparisons based on several criteria are presented. For small and medium size objects and distances Bundler-PMVS seems to have an advantage in terms of methodology and accuracy. In large scale objects TLS is better in terms of quality and processing time.
* Corresponding author.
1. INTRODUCTION
Terrestrial laser scanning (TLS) seems to be one of the most important technological advancements of the last decade, which induced significant changes in the field of 3D modelling. In the past years laser scanners were used intensively for the generation of 3D models required for diverse applications such as documentation of cultural heritage, navigation, space exploration etc. On its initial appearance, laser technology has surpassed traditional close-range photogrammetry, because of its accuracy and automation level. Boehler et al. (2004) stated that over optimistic people predicted that traditional photogrammetry might be completely replaced by 3D scanning in the future. However, in the past years multi image matching became one of the most active research areas both in photogrammetric and computer vision communities although it has been introduced since 1988 (Gruen et al., 1988). Many improvements have been made in the automated extraction of image correspondences and a considerable number of algorithms for image based modelling (IBM) has been developed. Nowadays, the generation of accurate and dense models from images with high level of automation is a fact, thereby eroding the superiority of laser scanners. According to Remondino et al. (2006), IBM still remains the most complete, economical, portable, flexible and widely used approach. Generally, 3D reconstruction can be performed by both methods but there are still factors that may limit effectiveness of each one. On one hand, laser scanners are able to produce dense point clouds, with high geometric accuracy in an almost fully automated manner by non-experts. Their main drawbacks still remain high cost, portability, time consuming data acquisition, noise from moving objects and low quality of colour information. Furthermore, laser scanning is a non-scalable method and depends on the material of the scanned object. On the other hand, IBM offer a low cost alternative applicable in
wide variety of scales, with short data acquisition time. Geometric accuracy and level of automation strongly depend on object’s texture quality, resolution of the images and network’s geometry. Consequently, the question of which method outperforms the other in terms of different criteria still remains. In this paper three tests have been conducted to evaluate laser scanner’s and IBM’s results, for outdoor realistic scenes and artificial objects with known geometry. In addition to TLS, Menci’s Zscan, a commercial trifocal photogrammetric system of medium cost and an open source solution, Bundler – PMVS workflow (Snavely et al., 2006; Furukawa et al., 2008; Furukawa et al., 2010), were tested.
2. RELATED WORK
The advent of laser technology has led to a large number of publications where comparisons between range-based and image-based modelling were presented (Baltsavias, 1999; Remondino et al., 2008). Many researchers attempted to answer the question whether these are two competitive or complementary techniques (Beraldin et al., 2004; Boehler et al., 2004). In Baltsavias (1999) a comparison between traditional manual photogrammetry and laser scanning was presented with respect to DTM and DSM generation from aerial imagery. The low degree of automation in the photogrammetric workflow seemed to be the main drawback, revealing laser scanning as superior in most of the cases. In the field of cultural heritage, many comparisons between terrestrial laser scanners and manual photogrammetry, for modelling artefacts were carried out (Boehler et al., 2004; Kadobayashi et al., 2004; Grussenmeyer et al., 2008). Due to the range in size and materials, complex geometry and demand for high quality colour information of the monuments, it was concluded that both methods can give satisfactory results but no one can be ISPRS Annals of the Photogrammetry, Remote Sensing and Spatial Information Sciences, Volume I-3, 2012
applied in every situation, hence a combination might be useful in many cases. The substantially increasing level of automation in the photogrammetric process, due to considerable algorithm improvement from the computer vision community, has changed the situation. In Salonia et al. (2009) four cultural heritage artefacts with different sizes and materials were documented using a TLS and two automatic photogrammetric systems, one stereo and one trifocal. The results of all tests were presented and compared in terms of data acquisition length of time, post-processing and accuracy, in order to investigate their possible integration. The applicability of photogrammetric systems to multi-scale projects was considered by many authors to be its major advantage. Similar approaches are presented in Salonia et al. (2011) and Cardone et al. (2011), were Menci’s Zscan photogrammetric system was used. Salonia summarized Zscan’s benefits as scalability and speed in the data acquisition phase and during processing. Cardone highlights the importance of high texture quality, which is achievable via photogrammetry. Beraldin (2004) addressed the estimation of both methods’ uncertainties from the scope of systems’ integration. Recently, apart from commercial automatic photogrammetric systems, a large number of open source multi-view stereo (MVS) algorithms have been developed. Such algorithms are able to produce accurate, coloured and dense point clouds from images, given cameras’ intrinsic parameters and viewpoints. Such methods were used for modelling parts of the Erechtheion monument, located in the Acropolis of Athens and compared to models acquired from laser scanning (Remondino et al., 2008). Marble surfaces remain a challenge for both range and image based modelling due to reflectance and texture problems. Moreover, the results of MVS algorithms were comparable to those of laser scanning in terms of similar accuracy. In Seitz et al. (2006) an evaluation methology for MVS algorithms is introduced. Their methology was based on the computation of two metrics, accuracy and completeness. Furthermore, the first quantitative evaluation of six different MVS algorithms is presented. For the evaluation, only objects with small size, located in indoor environments, were used. Ground truth models of the objects were obtained via laser scans. The aforementioned evaluation methology was adopted from Strecha et al. (2008) in order evaluate three different MVS algorithms for outdoor, realistic scenes. Both evaluations have agreed that Furukawa et al. (2008; 2010) PMVS algorithm had the best overall performance. The comparison presented here is differential from the aforementioned because it is conducted not only between TLS and IBM, but between commercial and open source solutions as well. Moreover, the entire Bundler-PMVS pipeline is evaluated, instead of the MVS part only. A wide range of test objects, in terms of complex geometry, outdoor and controlled indoor scenes and sizes, are used.
3. METHOLOGY DESCRIPTION
The first of the adopted systems was the Leica ScanStation C10 TLS with 4 mm single measurement accuracy and 2 mm modeled surface precision i.e. surface noise, at 1-50m distance. Secondly, a commercial optical scanner system was selected. Menci’s Zscan is a medium to high cost trifocal photogrammetric system, composed of one calibrated camera which moves between fixed positions on a rigid bar mounted on a tripod. Triplets of images with well known relative positions are acquired, thus the 3D reconstruction of the scene is achieved via multi image matching software with a user friendly interface. Lastly, a SfM algorithm followed by an MVS algorithm was used, i.e. Bundler-PMVS work flow. Bundler
(Snavely et al., 2006) estimates both intrinsic and extrinsic camera parameters from automatically detected feature correspondences, through bundle adjustment with auto calibration techniques. PMVS (Furukawa et al., 2008) is an automated approach for dense surface reconstruction based on multi image feature matching and area based matching techniques, given calibrated images. Contrary to the Zscan case, the work flow described above, does not allow for control point measurements over the images to be included within the bundle adjustment, hence it generates point clouds with arbitrary scale. Thus, the scale of the models was recovered through L.S. estimation, as in every case more than 10 measured distances were used to estimate scale. To this point, it has to be noted that a Nikon D90 camera with a 24 mm lens was used for capturing all images in this project.
3.1 Sphere
The first test was designed to directly compare the accuracies between the two IBM using an object with known surface i.e. a sphere of 300 mm diameter. In figure 1 (left) it can be seen that artificial texture was applied to the sphere’s surface to prevent matching problems. TLS was ruled out from this setup, as previous experience from small objects at close range has proved that extensive noise is expected (Skarlatos et al, 2010). A triangulation-baser laser scanner might have been a valid option for accuracy testing in such scale, but it was not available at that time.
Figure 1. Different test objects: sphere (left); façade (middle); Electricity station (right)
Before capturing the images, parameters such as the distance from the object and the base to depth ratio (B\D) have to be decided. It is known that close distances, large B\D ratio and high resolution images lead to more accurate depth estimation. Considering possible defects of the sphere’s surface, the parameters above where selected in order to prevent the estimation of depth discontinuities below 1 mm. Four image triplets with different baselenghts and fixed focal length were captured using Zscan’s equipment.
Figure 2. Sphere models from triplets with baselength equal to a. 10 cm, b. 15 cm, c. 20 cm, d. 25 cm
The reconstruction of the sphere via Zscan was worse using the triplets with the larger baselengths i.e. noisy surface with many gaps, possibly due to matching problems under wide baseline conditions. In the case of triplet with 20 cm baseline, the reconstruction failed completely (fig. 2). Thus, only the first ISPRS Annals of the Photogrammetry, Remote Sensing and Spatial Information Sciences, Volume I-3, 2012
triplet with 10 cm baselength was used for the comparison. The same triplet was also solved using Bundler-PMVS. By its nature, the latter, contrary to Zscan, gives the chance for stronger network geometry and multiple images, so theoretically lower uncertainty. Therefore, a sequence of five convergent images using autofocus mode was captured and solved by Bundler-PMVS, in order to investigate possible improvements in the results. All image datasets mentioned above were taken from 1.5 m distance, with a resolution of 4288×2848 pixels in order to be comparable. At this resolution a pixel spans 0.4 mm on the sphere’s surface. Theoretical depth accuracy was estimated to 0.8 mm. The main objective of this test was the evaluation of IBM techniques in terms of absolute accuracy and modelling quality. For every model the diameter of the best fitted sphere was calculated. Subsequently, each one of the three models was aligned with a sphere of 300 mm diameter and the deviations between the surfaces were estimated.
3.2 Façade
In the second test a flat building façade (fig. 1; middle) was used as a test object and all systems were directly compared. The façade was 13 m wide and 5.5 m height approximately. This test deals with an outdoor realistic scene which is a challenge mainly for IBM techniques due to uncontrolled lighting conditions. It has to be noted that flat objects, such as this one, are considered unfavorable for focal length recovery. Initially the façade was scanned from a single station and a point cloud of high resolution was created. The latter was down sampled in order to be manageable from 3D software and to achieve a uniform resolution as well. At this point, the problem of usually huge files created by TLS, regardless of the required resolution for individual parts of the objects should be noted. Following this, 13 image triplets, from tripod height, were captured including oblique and vertical views of the façade. All the triplets were processed by the Zscan software and the Bundler-PMVS system. Finally, 75 hand held, oblique and vertical photos were taken with fixed focal length and processed by Bundler-PMVS. In order to investigate possible problems of inaccurate focal length estimation during bundle adjustment, the subset of the aforementioned vertical images was solved separately. All image datasets were taken from approximately 5 m distance from the building. Each one of the four reconstructed models was compared with the TLS one. In more detail, initially each one of the models was roughly aligned with the TLS one via manual selection of seven corresponding points. At this step the importance of good coloured point clouds is perceived. In cases of TLS without an integrated digital camera, the stage of manual registration is almost impossible. The manual step was followed by an ICP implementation to achieve automatic registration refinement. Comparison of the co-registered clouds was performed in commercial point cloud processing software, based on the shortest point-to-mesh distance. Wide range of quality metrics was calculated from the estimated distances between surfaces.
3.3 Electricity power station
The last test was conducted in an electricity power station (fig.1; right). This object was an extremely complex steel construction with destroyed pipelines and outer shell. The object measured 180 m2 area and 25 m height approximately. It was scanned from two different stations using the Leica ScanStation C10 TLS. The data acquisition phase using TLS, in this particular case, including target positioning and scanning was 4 hours. Moreover, laser beam absorption problems had
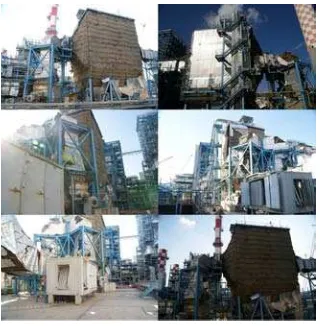
occurred due to surface reflection properties. The two separate point clouds were aligned automatically in order to create a complete model of the object which was compared against Bundler-PMVS result. Precisely, 212 photos were hand held captured all around the station. Object’s size in conjunction with its location had caused many problems during photo shoot. In many cases, limited accessibility and occluded parts enforced wide baseline conditions and poor geometric configurations. Station’s great height led to unfavorable viewing angles while outdoor lighting conditions resulted in many photos with varying radiometry (fig. 3).
Figure 3. Different views of the Electricity station under varying illumination conditions.
In this case, image capturing phase lasted 25 minutes. PMVS met with many problems while reconstructing the model i.e. presence of noise. A qualitative comparison between the two models was carried out, thus no metric results will be provided.
4. RESULTS
In this section, results of the comparisons between all the aforementioned models are reported. Apart from tables with numerical results, figures with errors’ visualization are also presented.
4.1 Sphere
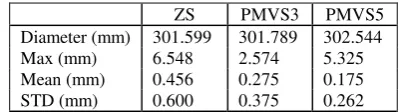
Three models of the sphere were generated by Zscan system and Bundler-PMVS workflow using triplets of images and 5 convergent images. In the remainder these models will be abbreviated as ZS, PMVS3, and PMVS5. The number of the produced points was 35232, 28747 and 28493 for each model respectively. Two metrics were calculated in order to evaluate Bundler’s performance; mean reprojection error and standard deviation of the estimated focal lengths. These values were equal to 0.22 pixels and 0.15 pixels for PMVS3 and 0.42 pixels and 2.55 pixels for PMVS5, showing good quality over the BA with pixel size being 5.5 μm. It has to be noted that the set with 5 convergent photos, was captured with autofocus mode on, and for this focal length STD is larger in the case of PMVS5. Firstly, a best fit between each one of the models and a sphere model was calculated. Numerical results are sampled in table 1, while errors’ visualization is presented in figure 4. The best fitted sphere to ZS has diameter value closer to the real one i.e. 300 mm. This is expected since ZS model achieves scale recovery from known baselength while PMVS3 and PMVS5
a. b. c. d.
recover their scale through manual measurements. PMVS5 performs best in terms of modelling quality as it has significant lower STD against the other two. This statement confirms the contribution of convergent geometry to the final result.
ZS PMVS3 PMVS5
Diameter (mm) 301.599 301.789 302.544 Max (mm) 6.548 2.574 5.325 Mean (mm) 0.456 0.275 0.175 STD (mm) 0.600 0.375 0.262
Table 1. Comparison between models and best-fitted sphere. Max, Mean and STD refer to absolute differences.
.
Figure 4. Errors’ visualization (mm). ZS(left), PMVS3 (middle), PMVS(right).
In SZ model (fig4; left) red and blue areas can be observed, while the majority of the points lie between -7 mm to 7 mm (yellow and cyan areas). PMVS3 (fig4; middle) seems to be noisier than PMVS5 (fig4; right), while both of them are considerably better than ZS. Secondly, each one of the models had been registered with the reference sphere i.e. the one whose diameter was 300mm, by minimizing the sum of distances between them. After that, the remaining distances between co-registered model pairs were calculated. Quality metrics from the 3D comparison were computed and are presented in table 2.
ZS PMVS3 PMVS5
Max (mm) 4.478 2.685 6.011
Mean (mm) 0.026 0.058 0.053
STD (mm) 0.620 0.422 0.382
MAD (mm) 0.477 0.323 0.284
RMS (mm) 0.645 0.610 0.384
Accuracy (%) 99.61 99.83 99.95
Completeness (%) 58 68 67
Table 2. Comparison between models and reference sphere
PMVS5 scores best in all values compared with the other two models. RMS value describes surface’s absolute accuracy, including both random and systematic errors, while STD is an index of surface’s noise. Accuracy expresses the percent of points on the reconstructed model, that are within 2σ i.e. 1.6 mm. Completeness denotes the percent of points on the reference model that are within 2 mm of the reconstructed models. Figure 5 is a color coded image of the computed differences. ZS (fig5; left) appears much noisier than the others. The above is also confirmed by the higher STD value. Note that on PMVS5 surface (fig4; right) 3 different error zones can be observed. The top area of the sphere is cyan coloured (-2 mm to -7 mm), the outer area is yellow coloured (+2 mm to +7 mm) while the intermediate zone appears green i.e. minimum error
range ±2 mm. The latter is indeed the area with the optimum convergent geometry.
Figure 5. Errors’ visualization (mm). ZS(left), PMVS3 (middle), PMVS(right).
In conclusion, PMVS5 outperforms the others in terms of accuracy and modelling quality, revealing Bundler-PMVS’s superiority against Zscan system and convergent geometry’s contribution to reconstruction quality.
4.2 Façade
Façade models created by TLS, Zscan and Bundler-PMVS workflow were compared directly. As it was mentioned in the previous section, the latter has been implemented on three image datasets. In the remainder the models from all images, only vertical ones and ZScan’s triplets will be abbreviated as PMVSall, PMVSvr, and PMVStr respectively. For these datasets Bundler’s mean reprojection error was 0.70 pixels, 0.49 pixels and 0.40 pixels and focal length STD 2.95 pixels, 3.21 pixels and 2.55 pixels respectively. Note that PMVSvr had the larger STD value as it was expected. PMVS’s reconstruction time for the larger image dataset was approximately 3 hours using five 2.27 GHz processors. Each one of the models which had been created by IBM was compared with the TLS model separately. Moving objects, such as doors and windows have been excluded from the model comparison. Numerical results and errors’ visualization are presented in the following. Figure 6 shows two of the generated models. Although TLS was able to create coloured point clouds directly, the texture quality is significantly lower from PMVS’s one.
Figure 6. TLS model (left), PMVSall (right)
PMVSall PMVSvr PMVStr ZS # of points 3842824 2481292 3133604 1585216
MAD (m) 0.0016 0.0015 0.0020 0.0078 Mean (m) 0.0001 0.0003 0.0001 0.0005 STD (m) 0.0026 0.0023 0.0031 0.0100
Table 3. Comparison between IBM models and TLS
The number of TLS’s points was 4281115, thus in terms of density, PMVSall is best among IBM models. IBM’s density could easily change if different parameters were used within PMVS point cloud extraction.
Regarding accuracy and modelling quality, PMVS’s models are comparable to TLS. The latter has 2 mm modeled surface precision and considering additional errors due to surface’s reflectivity but also ICP’s alignment accuracy, it can be stated that PMVS estimated accuracy is within TLS uncertainty. On the contrary ZS STD value was 1 cm, showing that its accuracy is remarkably inferior to other models’.
In more detail, it can be seen from the first three columns of table 3 that PMVSall has the best overall performance while the rest PMVS’s models are nearly compatible. Note that PMVSvr shows better results than PMVStr despite the lack of convergent images. Points of PMVStr were reconstructed by implementation of image matching algorithms between two images only, due to insufficient overlaps. In other words the PMVStr model suffers from lower accuracy and is thus expected to be noisier.
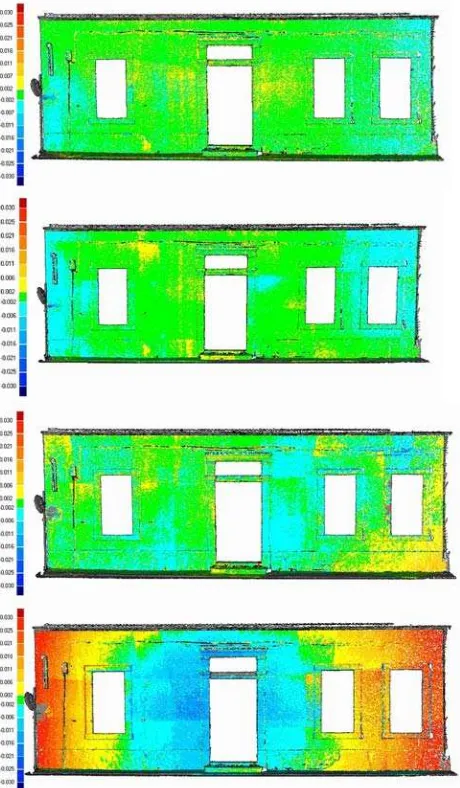
Figure 7. Errors’ visualization (cm). Downwards: PMVSall, PMVSvr, PMVStr, ZS.
In figure 7 (bottom) it can be seen that in the greater part of the surface, larger than 6 mm differences were computed between ZS and TLS. Considering errors’ distribution, positive differences appear on the outer parts of the façade while negative differences appear in the middle, giving a sense of
curved model surface. Moreover, coloured rectangular patches can be observed. These patches correspond to overlapping models of triplets, implying the Zscan software uses independent model adjustment rather than BA. In terms of density, ZS is the sparser model. Additionally, ZS had no uniform resolution as it was denser in overlapping areas of triplets. The latter could have been avoided by manual selection of AOIs in every triplet separately.
Finally, comparing ZS with PMVStr, as both had been created from the same image dataset, it can be stated that Bundler-PMVS pipeline is superior to the commercial Zscan system in terms of accuracy, modelling quality, density, time required for data acquisition and cost.
4.3 Electricity power station
The last object was scanned with the TLS and reconstructed by Bundler-PMVS workflow as well. At first sight the scanned model satisfies the accuracy demands. Despite the object’s complex geometry, detailed parts such as steel pipes were modelled correctly. In figure 8, the bad texturing quality can be noticed. Although the specific TLS integrates a high resolution digital camera i.e. 1920 × 1920 pixels, colour quality is still poor. The above is one of the factors that may limit the effectiveness of TLS since the ideal conditions for capturing images may not coincide with those for scanning (Remondino et al., 2006).
Figure 8. TLS’s model
Considering Bundler’s and PMVS’s implementation as steps of a single workflow it can be stated that the whole procedure is inferior to TLS usage as the final result was not satisfactory. Although the recovery of both intrinsic and extrinsic cameras parameters was successful by Bundler’s implementation, despite the large amount of photos and the weak geometry of the network, PMVS failed to reconstruct the scene without noise (fig.9). More specifically, Bundler’s mean reprojection error was equal to 0.93 pixels and focal length STD was computed 0.77 pixels. Unfortunately, PMVS met with many problems due to wide baseline conditions, radiometric differences between photos, and featureless areas.
Figure 9. Reconstructed model by Bundler-PMVS workflow ISPRS Annals of the Photogrammetry, Remote Sensing and Spatial Information Sciences, Volume I-3, 2012
Comparing the two models, TLS is superior in terms of accuracy, completeness and modelling quality. Furthermore, processing time is also in favour of TLS since PMVS slows down in cases of large datasets.
5. CONCLUSIONS
In this paper a comparison between laser scanning and image-based modelling was presented. From the field of IBM two systems, one commercial and one open source, were examined. Considering both sphere’s and façade’s tests, Bundler-PMVS workflow is superior to Zscan system in terms of accuracy, density, modelling quality and cost. Moreover, one of the PMVS’s main advantages against Zscan is that it enables the use of convergent images, thus stronger geometric configurations can be achieved. In the case of façade, PMVS results are equal, if not better, to TLS while Zscan’s accuracy was significantly lower. As a result, statements such as Remondino et al. (2006) claiming that the generation of accurate and realistic models by IBM remains highly interactive due to the need for assumptions about surfaces shape and Strecha et al. (2008) that IBM accuracies still are far away from those achieved by TLS do not hold anymore. This work proves that in cases of small and medium size objects contemporary IBM methods can compete and even replace TLS’s standard solution, since high resolution images give accurate models and advanced matching algorithms offer high degree of automation. Furthermore, the fact that Bundler-PMVS is an open source solution magnifies the main drawback of TLS, which is the high cost. On the other hand, considering the last test, there are still factors that may limit the effectiveness of IBM i.e. poor texture, weak network geometry, large scale objects.
This work highlights the significant contribution of computer vision algorithms in the traditional photogrammetric workflow. The recent and continuously increasing development of MVS techniques increases the effectiveness of IBM. Thus, nowadays scalable IBM outperforms TLS in many aspects. Moreover, open source solutions can be competitive and even better from the commercial systems. In any case, it is confirmed once more that there is no single method for 3D reconstruction applicable in all scenes. The selection of the appropriate method should take under consideration both object’s properties and application’s requirements.
AKNOWLEDGEMENTS
Authors would like to thank Cyprus University of Technology for the starting research grant titled "More Information".
REFERENCES
Baltsavias, E., 1999. A comparison between photogrammetry and laser scanning. ISPRS Journal of Photogrammetry & Remote Sensing, 54, pp. 83–94.
Beraldin, J.-A., 2004. Integration of Laser Scanning and Close-Range Photogrammetry - The Last Decade and Beyond. XXth International Society for Photogrammetry and Remote Sensing Congress, Commission VII, Istanbul, Turkey, pp. 972-983.
Boehler, W., Marbs, A., 2004. 3D scanning and photogrammetry for heritage recording: a comparison. Proceedings of the 12th International Conference on Geoinformatics, University of Gavle, Sweden, pp. 291–298.
Cardone, V., Giordano, M., 2011. Computer Vision and Photo Scanning. The Online Journal on Computer Science and Information Technology OJCSIT, 1(3), pp. 78-82.
Furukawa, Y., Ponce, J., 2008. Accurate, dense, and robust multiview stereopsis. CVPR.
Furukawa, Y., Curless, B., Seitz, S., M., Szeliski, R., 2010. Towards Internet-scale Multi-view Stereo, CVPR, 8 pages.
Gruen, A., Baltsavias, E., 1988. Geometrically Constrained Multiphoto Matching. PERS, 54(5), pp. 633-641.
Grussenmeyer, P., Landes, T., Voegtle, T., Ringle, K., 2008. Comparison Methods of Terrestrial Laser Scanning, Photogrammetry and Tacheometry Data for Recording of Cultural Heritage Buildings. The International Archives of the Photogrammetry, Remote Sensing and Spatial Information Sciences, Vol. XXXVII. Part B5, pp. 213-218.
Kadobayashi, R., Kochi, N., Otani, H., Furukawa, R., 2004. Comparison and evaluation of laser scanning and photogrammetry and their combined use for digital recording of cultural heritage. International Archives of the Photogrammetry, Remote Sensing and Spatial Information Sciences, 35(5), pp. 401–406.
Remondino, F., El – Hakim, S., 2006. Image based modelling: A review. The photogrammetric record, 21 (115), pp. 269-291.
Remondino, F., Baltsavias, E., El-Hakim, S., 2008. Image-based 3D modelling of the Erechtheion, Acropolis of Athens. ISPRS XXI Congress, 3-11 July, Beijing, China.
Salonia, P., Scolastico, S., Pozzi, A., Marcolongo, A., Leti Messina, T., 2009. Multi-scale cultural heritage survey: Quick digital photogrammetric systems. Journal of Cultural Heritage, 10, pp. 59–64.
Salonia, P., Leti Messina, T., Marcolongo, A., Appolonia, L., 2011. Photo scanner 3D survey for monitoring historical monuments. The case history of ports Praetorian in Aosta. XXIII CIPA Symposium, Prague, Czech Republic, 12 – 16 September.
Seitz, S. M., Curless, B., Diebel, J., Scharstein, D., Szeliski, R., 2006. A comparison and evaluation of multi-view stereo reconstruction algorithms. In Proc. CVPR, pp: ages 519–528.
Skarlatos, D., Agapiou, A., Rova, M., 2010. Photogrammetric support on an underwater archaeological excavation site: The Mazotos shipwreck case. Euromed 2010, Digital Heritage, 8-11 November, Lemesos, 2010.
Snavely, N., Seitz, S., Szeliski, R., 2006. Photo tourism: Exploring photo collections in 3D. SIGGRAPH Conference Proceedings. New York, NY, USA: ACM Press, pp. 835–846.
Strecha, C., Von Hansen, W., Van Gool, L., Fua, P., Thoennessen, U., 2008.On Benchmarking Camera Calibration and Multi-View Stereo for High Resolution Imagery Proc. IEEE Conf. Computer Vision and Pattern Recognition.