i
4
th
REPORT OF
THE MALAYSIAN REGISTRY
of
RENAL BIOPSY
2010
Sponsors:
Malaysian Society of Nephrology
The National Renal Registry is funded with grants from:
Roche Ain Medicare Baxter Healthcare Fresenius Medical Care The Ministry of Health Malaysia
ii
March 2013
© National Renal Registry, Malaysia ISSN 1985-6989
Published by:
The National Renal Registry Malaysian Society of Nephrology Suite 1604, Plaza Permata No. 6, Jalan Kampar 50400 Kuala Lumpur Malaysia
Telephone. : (603) 4045 8636 Direct Fax : (603) 4042 7694 e-mail : [email protected]
Web site : http://www.msn.org.my
Cover illustration by Dr. Nik Hasimah Nik Yahya HKL
Important information:
This report is copyrighted. However it may be freely reproduced without the permission of the National Renal Registry. Acknowledgment would be appreciated. Suggested citation is:
Rosnawati Yahya, Wan Jazilah W I (Eds) 4th Report of the Malaysian Registry of Renal Biopsy 2010. Kuala Lumpur 2013.
This report is also published electronically on these websites http://www.msn.org.my or https://
iii
The National Renal Registry would like to thank the following:
All the nephrologists and staff of the participating hospitals
For their hard work and contribution,
The Ministry of Health, Malaysia
for support seen and unseen,
For their generous support: -
RocheAin Medicare Baxter Healthcare Fresenius Medical Care
The staff of the Clinical Research Centre
&
All who have in one way or another supported the National Renal
Registry.
iv
Clinical Registry Manager Lee Day Guat
Clinical Research Assistant Suhazelini Ali Choo Cheh Loo
Statistician Adam bin Bujang
Premaa A/P Supramaniam Tassha Hilda binti Adnan
Members: MSN appointment: Facilities
Datuk Dr. Ghazali Ahmad Chairman Hospital Kuala Lumpur
Dr. Abdul Halim Abd Gafor University representative University Kebangsaan Malaysia Medical Centre Dr. S. Prasad Menon Private sector representative Sime Darby Medical
Centre Subang Jaya
Dr. Ong Loke Meng CRC representative Hospital Penang
Mr. Tam Chong Chiang ADMAN representative Hospital Tg. Ampuan
Afzan Dr. Lim Yam Ngo
MDTR sub-committee Chairperson Hospital Kuala Lumpur
Dr. Wong Hin Seng
eMOSS sub-committee Chairperson
Hospital Selayang
Dato' Dr. Wan Shaariah Md Yusuf
MRRB sub-committee Chairperson Tuanku Ja'afar Hospital
Dr. Goh Bak Leong MDTR Editor Hospital Serdang
Dr. Rafidah Abdullah Honorary MSN Treasurer Hospital Selayang
NRR ADVISORY COMMITTEE MEMBERS
2010 TO 2012
MRRB WORKING COMMITTEE MEMBERS
Chairperson Dato’ Dr. Wan Sha’ariah Md Yusuf
v
ABOUT MALAYSIAN REGISTRY OF RENAL BIOPSY
Renal biopsy remains the main investigation in the diagnosis of renal diseases. In addition, it plays a major role in determining the management and prognosis of parenchymal renal disease. The collection of demographic, clinical and laboratory data at the time of biopsy and the set up of a database are useful tools for studying renal parenchymal diseases.
The development of a renal biopsy registry in each country promotes many advantages and these include comparison in incidence of renal diseases, identification of different policies and practices in renal biopsy in different areas, linkage with other registries such as dialysis or transplant registry and identification of rare renal diseases. Thus, the registry is a source of epidemiological data and would provide useful information in the planning of health care and in organizing prospective clinical studies.
The incidence of glomerular disease varies according to population, demographic characteristics, environmental factors, socio-economic status and the prevalence of infectious diseases. At present, there is limited information on the prevalence and incidence of glomerular disease, its potential disease burden and the temporal trend in Malaysia. Hence, the Malaysian Registry of Renal Biopsy (MRRB) was set up in 2005 to address this deficiency.
The MRRB collects information about patients who undergo renal biopsy in Malaysia. The MRRB is a new component of National Renal Registry (NRR), which has been operating the Malaysian Dialysis and Transplant Registry (MDTR) since 1993.
Objectives
The objectives of the MRRB registry are to:
1. Determine the disease burden attributable to glomerular disease (GD) by quantifying its incidence and prevalence, and its geographic and temporal trends in Malaysia.
2. Identify subgroups in the population at high risk of GD to whom preventive efforts should be targeted.
3. Identify potential causal and risk factors involved in GD. 4. Describe the clinical presentation and spectrum of GD.
5. Stimulate and facilitate basic, clinical and epidemiological research on GD. 6. Identify causes of allograft failure in our renal transplant population.
vi
Organization
The NRR organization is as follows:
Owner
Source Data Providers Target groups or Users
Owner
The Malaysian Society of Nephrology (MSN) is the owner of this registry.
Sponsors
The MRRB is sponsored by the Malaysian Society of Nephrology (MSN) and the Ministry of Health, Malaysia.
NRR Advisory Committee
This is the committee established by the sponsors. The NRR Advisory Committee’s role is to ensure that the MRRB stay focused on its objectives and to assure its continuing relevance and justification.
MRRB Steering Committee
The MRRB steering Committee supervises the operation of this registry.
National Renal Registry office
The NRR coordinating office is the designated coordinating center. It coordinates the data provided by the Source Data Providers (SDPs). It collaborates with Clinical Research Centre of Hospital Kuala Lumpur that provides epidemiological and statistical support for MRRB.
Source Data Providers (SDP)
vii
To participate in MRRB
Centres interested to participate in this registry please write in to NRR officially via post or email [email protected].
The following documents need to be completed and returned to facilitate participation. • Centre Participation Self Reply Form
• Authorization Form
• Information Security Policy/User Agreement . One form per nominee as listed in the Authorization form. Users must have a personal mobile phone to received SMS authentication.
Upon receiving these documents, the centre shall be registered and each of the users of the MRRB shall be notified via their e-mail address.
Methodology
All patients from participating centres who undergo any kidney biopsy (native or graft) are to be enrolled into the registry.
viii
List of Source Data Providers
ix
CONTRIBUTING EDITORS
Chapter Title Authors Institutions
1 Overview of Renal Biopsy in Malaysia
Wan Sha’ariah Md Yusuf Tuanku Ja’afar Hospital Lee Ming Lee Tuanku Ja’afar Hospital Lee Day Guat National Renal Registry
2 Primary Glomerulonephritis Sunita Bavanandan Kuala Lumpur Hospital
Lim Soo Kun University Malaya Medical
Centre
3 Secondary Glomerulonephritis Rosnawati Yahya Kuala Lumpur Hospital
4 Paediatric Renal Biopsy Lee Ming Lee Tuanku Ja’afar Hospital
Lim Yam Ngo Kuala Lumpur Hospital
Lynster Liaw Pulau Pinang Hospital
Susan Pee Sultan Ismail Hospital
Wan Jazilah Wan Ismail Selayang Hospital
Yap Yoke Chin Kuala Lumpur Hospital
Selvakumar Sivapunniam Tengku Ampuan Afzan Hospital
5 Renal Allograft Biopsy Wong Hin Seng Selayang Hospital
Report Editors
x
CONTENTS
1
1.1 Introduction 2
1.2 Renal biopsies from the participating centres 2
1.2.1 Ascertainment rate of total biopsy performed 2
1.2.2 Type of renal biopsy performed 5
1.2.3 Number of renal biopsy done on each individual patient 8
1.2.4 Demographic distribution of renal biopsy (Native and Graft) 9
1.2.4.1 Age distribution 9
1.2.4.2 Gender distribution 12
1.2.4.3 Racial distribution 12
1.2.5 Renal biopsy report analysis 13
1.2.6 Histopathology specimen distribution to histopathology laboratories 14
1.3 Native kidney biopsy 17
1.3.1 Clinical Indications of renal biopsy 17
1.3.2 Histopathological diagnosis 17
1.3.3 Histopathology findings in common clinical presentation 20
1.3.3.1 Histopathological diagnosis in patients with nephrotic syndrome 20 1.3.3.2 Histopathological diagnosis in patients with urinary abnormalities 21 1.3.3.3 Histopathological diagnosis in patients with nephritic-nephrotic
syndrome 22
1.3.3.4 Histopathological diagnosis in patients with nephritic syndrome 23
1.3.3.5 Primary GN according to various age group 24
2.2.2 Patient population and characteristics 29
2.2.3 Clinical presentation 30
2.2.3.1 Clinical presentation by age 33
2.2.3.2 Clinical presentation by gender 35
2.3 Focal Segmental Glomerulosclerosis 37
2.3.1 Introduction 37
2.3.2 Patient population and characteristics 37
2.3.3 Clinical Presentation 38
2.3.3.1 Clinical presentation by age 41
2.3.3.2 Clinical presentation by gender 42
2.4 IgA Nephropathy (IgAN) 44
2.4.1 Introduction 44
2.4.2 Patient population and characteristics 44
2.4.3 Clinical presentation 46
2.4.3.1 Clinical Presentation by age 47
2.4.3.2 Clinical presentation by gender 49
2.5 Idiopathic Membranous Nephropathy 51
2.5.1 Introduction 51
2.5.2 Patient population and characteristics 51
2.5.3 Clinical presentation 52
2.5.3.1 Clinical presentation by age 54
xi
CHAPTER 3 SECONDARY GLOMERULONEPHRITIS 59
3.1 Introduction 60
3.2.3.3 Clinical Presentations by histopathology 66
3.2.4 Renal function at presentation 67
3.2.4.1 Renal function at presentation by age group 67
3.2.4.2 Renal function at presentation by gender 68
3.2.4.3 Renal function at presentation by histopathology 68
3.2.5 Histopathological diagnosis 69
3.2.5.1 Histopathological diagnosis by age 70
3.2.5.2 Histopathological diagnosis by gender 71
3.2.5.3 Histopathological diagnosis by clinical presentation 71
3.2.6 Extra-renal involvement 72
3.2.6.1 American Rheumatological Association (ARA) criteria in lupus
nephritis 72
3.2.7.1 Patient survival in lupus nephritis 75
3.2.7.2 Renal survival in lupus nephritis 76
CHAPTER 4 PAEDIATRIC RENAL BIOBSY 77
4.1 Introduction 78
4.2 Number of patients and renal biopsies 78
4.2.1 Total number of patients and native renal biopsies 78
4.5.1 Clinical presentation at biopsy 80
4.5.2 Renal function at biopsy 80
4.5.3 Hypertension at biopsy 80
4.6 Histopathological findings of paediatric renal biopsies 81
4.6.1 Diagnosis of paediatric renal biopsies 81
xii
CONTENTS
(con’t)4.7 Nephrotic syndrome 83
4.7.1 Renal histopathology diagnosis of children presenting with nephrotic
syndrome 83
4.7.2 The histopathological profile in different steroid response categories 83 4.8 Renal histopathology diagnosis of children presenting with nephritic syndrome 84
4.9 Causes of severe renal failure 84
4.10 Paediatric focal segmental glomerulosclerosis and minimal change disease 85 4.10.1 Characteristics of paediatric focal segmental glomerulosclerosis and minimal
change disease among children with steroid resistant nephrotic syndrome 85 4.10.2 Patient survival in focal segmental glomerulosclerosis and minimal change
disease 86
4.10.3 Renal survival of patient with focal segmental glomerulosclerosis and minimal
change disease 87
4.11 Paediatric lupus nephritis 88
4.11.1 Total number of patients and renal biopsies 88
4.11.2 Number of renal biopsy done on each individual patient with lupus 88
4.11.3 Patient characteristics of paediatric lupus nephritis 89
4.11.4 Manifestations of paediatric SLE 90
4.11.5 Classification of paediatric lupus nephritis 90
4.11.6 Patient survival in lupus nephritis 91
4.11.7 Renal survival of patients with lupus nephritis 91
4.12 Renal outcome 92
4.13 Biopsy failure and complication 92
4.13.1 Frequency of complications 92
4.13.2 Risk factors of complications 93
References 94
CHAPTER 5 RENAL ALLOGRAFT BIOPSY 95
5.1 Introduction
96
5.2 Number of renal allograft biopsy
96
5.2.1 Number of renal allograft biopsy by year 96
5.2.2 Number of renal allograft biopsy by year and site 96
5.2.3 Number of renal allograft biopsy by year and age group 97
5.3 Clinical presentation at biopsy 98
5.4 Timing of renal allograft biopsy
98
5.5 Biopsy Procedure
99
5.5.1 Biopsy method 99
5.5.2 Number of passes 100
5.5.3 Number of glomeruli obtained on biopsy 100
5.5.4 Type of complications 101
5.6 Histological diagnosis 101
xiii
LIST OF TABLES
Page
Table 1.2.1 (a) Total number of biopsy performed and percentage of reported and
unreported renal biopsies by centres, 2005-2010 3
Table 1.2.1 (b) Total number of reported and unreported renal biopsies,2005-2010 5 Table 1.2.2 Distribution of reported native and graft renal biopsies by centres,
2005-2010 6
Table 1.2.3 (a) Distribution of native renal biopsy in patients by number of episodes,
2005-2010 8
Table 1.2.3 (b) Distribution of renal allograft biopsy in patients by number of episodes,
2005-2010 8
Table 1.2.4.1 (a) Age distribution of native renal biopsy, 2005-2010 8 Table 1.2.4.1 (b) Age distribution of renal allograft biopsy, 2005-2010 9 Table 1.2.4.1 (c) Age group distribution of reported renal biopsies by state, 2005-2010 9 Table 1.2.4.2 (a) Gender distribution of native renal biopsy, 2005-2010 10 Table 1.2.4.2 (b) Gender distribution of renal allograft biopsy, 2005-2010 12 Table 1.2.4.3 (a) Racial distribution of native renal biopsy, 2005-2010 12 Table 1.2.4.3 (b) Racial distribution of renal allograft biopsy, 2005-2010 12 Table 1.2.5 Number of glomeruli obtained at each biopsy by centres, 2005-2010 12 Table 1.2.6 (a) Distribution of biopsy specimens to local histopathology laboratories by
participating centres, 2005-2010 13
Table 1.2.6 (b) Distribution of biopsy specimens to outside histopathology laboratories
by participating centres, 2005-2010 14
Table 1.2.6 (c) Summary of biopsies received by local and external laboratories,
2007-2010 16
Table 1.2.6 (d) Histopathology laboratories receiving renal biopsy specimens,
2005-2010 16
Table 1.3.1 (a) Indications for native renal biopsies, 2005-2010 17
Table 1.3.1 (b) Renal function at time of biopsy, 2005-2010 17
Table 1.3.2 Histopathology of all native renal biopsies, 2005-2010
18 Table 1.3.3.1 HPE diagnosis in patients presenting with nephrotic syndrome,
2005-2010 20
Table 1.3.3.2 HPE diagnosis in patients presenting with urine abnormalities,
2005-2010 21
Table 1.3.3.3 HPE diagnosis in patients presenting with nephritic-nephrotic syndrome,
2005-2010 22
Table 1.3.3.4 HPE diagnosis in patients presenting with nephritic syndrome,
2005-2010 23
Table 1.3.3.5 Primary GN according to the various age group, 2005-2010 24
Table 2.1 Primary Glomerulonephritis, 2005-2010 28
Table 2.2.2 (a) Demographic characteristics for MCD, 2005-2010 29
Table 2.2.2 (b) Age group at time of biopsy (years) for MCD, 2005-2010 30
Table 2.2.3 (a) Clinical presentation for MCD, 2005-2010 31
Table 2.2.3 (b) Hypertension in MCD, 2005-2010 31
Table 2.2.3 (c) Renal function in MCD by year, 2005-2010 32
Table 2.2.3.1 (a) Clinical presentation by age group for MCD, 2005-2010 33
Table 2.2.3.1 (b) Hypertension by age group in MCD, 2005-2010 33
Table 2.2.3.1 (c) Renal function at presentation by age group for MCD, 2005-2010 34 Table 2.2.3.2(a) Clinical presentation by gender for MCD, 2005-2010 35
Table 2.2.3.2(b) Hypertension by gender for MCD, 2005-2010 35
Table 2.2.3.2 (c) Renal function by gender for MCD, 2005-2010 36
xiv
LIST OF TABLES
(con’t)Page Table 2.3.2 (b) Age group at time of biopsy (years) for FSGS, 2005-2010 38
Table 2.3.3 (a) Clinical presentation for FSGS, 2005-2010 39
Table 2.3.3 (b) Presence of hypertension in FSGS, 2005-2010 39
Table 2.3.3 (c) Renal function in FSGS by year, 2005-2010 40
Table 2.3.3.1 (a) Clinical presentation by age group for FSGS, 2005-2010 41
Table 2.3.3.1 (b) Hypertension by age group for FSGS, 2005-2010 41
Table 2.3.3.1 (c) Renal function at presentation by age group for FSGS, 2005-2010 42 Table 2.3.3.2 (a) Clinical presentation by gender for FSGS, 2005-2010 42
Table 2.3.3.2 (b) Hypertension by gender in FSGS, 2005-2010 43
Table 2.3.3.2 (c) Renal function by gender for FSGS, 2005-2010 43
Table 2.4.2 (a) Demographic characteristics of patients with IgA nephropathy,
2005-2010 44
Table 2.4.2 (b) Age group at time of biopsy (years) for IgA nephropathy, 2005-2010 45 Table 2.4.3 (a) Clinical presentation for IgA nephropathy, 2005-2010 46
Table 2.4.3 (b) Hypertension in IgA nephropathy, 2005-2010 46
Table 2.4.3 (c) Renal function in IgA Nephropathy, 2005-2010 47
Table 2.4.3.1 (a) Clinical presentation by age group for IgA nephropathy, 2005-2010 47 Table 2.4.3.1 (b) Hypertension by age group for IgA nephropathy, 2005-2010 47 Table 2.4.3.1 (c) Renal function at presentation by age group for IgA nephropathy,
2005-2010 48
Table 2.4.3.2 (a) Clinical presentation by gender for IgA nephropathy, 2005-2010 49 Table 2.4.3.2 (b) Hypertension by gender for IgA nephropathy, 2005-2010 49 Table 2.4.3.1 (c) Renal function by gender for IgA nephropathy, 2005-2010 50
Table 2.5.2 (a) Demographic characteristics for IMN, 2005-2010 51
Table 2.5.2 (b) Age group at time of biopsy (years) for IMN, 2005-2010 52
Table 2.5.3 (a) Clinical presentation for IMN, 2005-2010 52
Table 2.5.3 (b) Hypertension in IMN, 2005-2010 53
Table 2.5.3 (c) Renal function in IMN, 2005-2010 53
Table 2.5.3.1 (a) Clinical presentation by age group for IMN, 2005-2010 54
Table 2.5.3.1 (b) Hypertension by age group for IMN, 2005-2010 54
Table 2.5.3.1 (c) Renal function at presentation by age group for IMN, 2005-2010 55 Table 2.5.3.2 (a) Clinical presentation by gender for IMN, 2005-2010 56
Table 2.5.3.2 (b) Hypertension by gender for IMN, 2005-2010 56
Table 2.5.3.1 (c) Renal function by gender for IMN, 2005-2010 57
Table 3.1 Causes of secondary glomerulonephritis in adult, 2005-2010 60
Table 3.2.2.1 Age group at time of biopsy (years), 2005-2010 61
Table 3.2.3.1 (a) Clinical presentation by age group, 2005-2010 64
Table 3.2.3.3 (a) Clinical presentations by histopathology in lupus nephritis, 2005-2010 66 Table 3.2.4.1 Renal function by age group in lupus nephritis, 2005-2010 67 Table 3.2.4.3 Renal function at presentation by histopathology, 2005-2010 68 Table 3.2.5 Histopathological diagnosis in lupus nephritis by year, 2005-2010 69 Table 3.2.5.1 Histopathological diagnosis by age group in lupus nephritis, 2005-2010 70 Table 3.2.5.2 Histopathological diagnosis by gender in lupus nephritis, 2005-2010 71 Table 3.2.5.3 Histopathological diagnosis by clinical presentation in lupus nephritis,
2005-2010 71
Table 3.2.6.1 ARA criteria in lupus nephritis, 2005-2010 72
Table 3.2.6.5 (a) Extra-renal involvement by gender, 2005-2010 73
Table 3.2.6.5 (b) Mucocutaneous involvement by gender in lupus nephritis, 2005-2010 74 Table 3.2.7.1 Patients survival estimates for death in lupus nephritis 75 Table 3.2.7.2 Renal survival estimates for death in lupus nephritis 76
xv
LIST OF TABLES
(con’t)Page
Table 4.2.3 Number of renal biopsis 78
Table 4.2.4 Number of renal biopsies done on each individual patient 78
Table 4.3.1 Conclusive report 79
Table 4.3.2 Number of glomeruli obtained at each biopsy 79
Table 4.4.1 Gender and racial distribution 79
Table 4.4.2 Age distribution 79
Table 4.5.1 Clinical presentation at biopsy 80
Table 4.5.2 Renal function at biopsy 80
Table 4.5.3 Hypertension at biopsy 80
Table 4.6.1 Diagnosis of paediatric renal biopsies 81
Table 4.6.2 Annual frequency of the main renal biopsy findings 1999-2010 82 Table 4.7.1 Renal histopathology diagnosis of children presenting with nephrotic
syndrome
83 Table 4.7.2 The histopathological profile in different steroid response categories 83 Table 4.8 Renal histopathology diagnosis of children presenting with nephritic
syndrome
84 Table 4.9 Histology finding of children who had severe renal failure (needed
dialysis therapy) who underwentrenal biopsy
84 Table 4.10.1 Clinical characteristics of children with steroid resistant nephrotic
syndrome
85 Table 4.10.2 Patient survival for focal segmental glomerulosclerosis and minimal
change disease
86 Table 4.10.3 Renal survival of patient with focal segmental glomerulosclerosis and
minimal change disease
87
Table 4.11.1 Total number of patient and biopsies (SLE) 88
Table 4.11.2 Distribution of renal biopsy in patients with lupus by numbers of biopsy 88
Table 411.3.1 Gender distribution for paediatric lupus nephritis 89
Table 411.3.2 Racial distribution for paediatriclupus nephritis 89
Table 411.3.3 Age for paediatric lupus nephritis 89
Table 411.3.4 Dialysis therapy for paediatric lupus nephritis at the time of biopsy 89
Table 411.3.5 Patient with hypertension (SLE) 89
Table 411.3.6 Clinical presentation at biopsy (SLE) 89
Table 4.11.4(a) Clinical presentation of paediatric lupus 90
Table 4.11.4(b) ARA criteria at presentation 90
Table 4.11.5 Classification of paediatric lupus nephritis 90
Table 4.11.6 Patients survival in lupus nephritis 91
Table 4.11.7 Renal survival of patients with lupus nephritis (ESRF & ESRF+died) 91 Table 4.12 Causes of end stage renal disease in children who underwent renal
biopsy 92
Table 4.13.1 Frequency of complications 92
Table 4.13.2 Risk factors for complication 93
Table 5.2.1 Number of renal allograft biopsy, 2004-2010 96
Table 5.2.2 Number of renal allograft biopsy by centre, 2004-2010 96
Table 5.2.3 Renal allograft biopsy by year and age group, rate (per million
population), 2004-2010 97
Table 5.3 Indications for renal allograft biopsy, 2004-2010 98
Table 5.4 Timing of renal allograft biopsy, 2004-2010 99
Table 5.5.1 Biopsy method, 2004-2010 99
Table 5.5.2 Number of passes, 2004-2010 100
Table 5.5.3 Number of glomeruli obtained on biopsy, 2004-2010 100
Table 5.5.4 Type of complications, 2004-2010 101
xvi
LIST OF FIGURES
Page
Figure 1.3.3.5 Primary GN according to the various age group, 2005-2010 25
Figure 2.2.2 (a) Demographic characteristics for MCD, 2005-2010 29
Figure 2.2.2 (b) Age at time of biopsy (years) for MCD, 2005-2010 30
Figure 2.2.3 (a) Overall clinical presentation for MCD, 2005-2010 31
Figure 2.2.3 (b) Presence of hypertension in MCD, 2005-2010 32
Figure 2.2.3 (c) Impaired renal function in MCD by year, 2005-2010 32
Figure 2.2.3.1 (b) Presence of hypertension by age group for MCD, 2005-2010 34 Figure 2.2.3.1 (c) Impaired renal function at presentation by age group for MCD,
2005-2010 34
Figure 2.2.3.2 (b) Presence of Hypertension by gender for MCD, 2005-2010 35 Figure 2.2.3.2 (b) Impaired renal function by gender for MCD, 2005-2010 36
Figure 2.3.2(a) Demographic characteristics for FSGS, 2005-2010 37
Figure 2.3.2 (b) Age at time of biopsy (years) for FSGS, 2005-2010 38
Figure 2.3.3 (a) Overall clinical presentation for FSGS, 2005-2010 39
Figure 2.3.3 (b) Hypertension in FSGS, 2005-2010 40
Figure 2.3.3 (c) Impaired renal function in FSGS by year, 2005-2010 40
Figure 2.3.3.1 (b) Hypertension by age group for FSGS, 2005-2010 41
Figure 2.3.3.1 (c) Renal function at presentation by age group for FSGS, 2005-2010 42
Figure 2.3.3.2 (b) Hypertension by gender for FSGS, 2005-2010 43
Figure 2.3.3.2 (c) Impaired renal function at presentation by gender in FSGS, 2005-2010 44 Figure 2.4.2 (a) Demographic characteristics of patients with IgA nephropathy,
2005-2010 45
Figure 2.4.2 (b) Age at time of biopsy (years) for IgA nephropathy, 2005-2010 45 Figure 2.4.3 (a) Overall clinical presentation for IgA nephropathy, 2005-2010 46
Figure 2.4.3 (b) Hypertension in IgA nephropathy, 2005-2010 48
Figure 2.4.3 (c) Impaired renal function in IgA nephropathy by year, 2005-2010 48 Figure 2.4.3.2 (b) Hypertension by gender for IgA nephropathy, 2005-2010 49
Figure 2.4.3.2 (c) Impaired renal function by gender in, 2005-2010 50
Figure 2.5.2 (a) Demographic characteristics for IMN, 2005-2010 51
Figure 2.5.2 (b) Age at time of biopsy (years) IMN, 2005-2010 52
Figure 2.5.3 (a) Overall clinical presentation for IMN, 2005-2010 53
Figure 2.5.3 (c) Renal function in IMN, 2005-2010 54
Figure 2.5.3.1 (b) Hypertension by age group for IMN, 2005-2010 55
Figure 2.5.3.1 (c) Renal function at presentation by age group for IMN, 2005-2010 55
Figure 2.5.3.2 (b) Hypertension by gender for IMN, 2005-2010 56
Figure 2.5.3.2 (c) Impaired renal function by gender, 2005-2010 57
Figure 3.2.2.1 Age group at time of biopsy (years), 2005-2010 61
Figure 3.2.2.2 Gender distribution in lupus nephritis, 2005-2010 62
Figure 3.2.2.3 Racial distribution in lupus nephritis, 2005-2010 62
Figure 3.2.3 Clinical presentation by year, 2005-2010 63
xvii Page Figure 3.2.3.2 (a) Clinical presentation by gender in lupus nephritis, 2005-2010 65 Figure 3.2.3.2 (b) Hypertension by gender in lupus nephritis, 2005-2010 65 Figure 3.2.3.2 (c) Impaired renal function by gender in lupus nephritis, 2005-2010 65 Figure 3.2.3.3 (a) Clinical presentations by histopathology in lupus nephritis, 2005-2010 66 Figure 3.2.3.3 (b) Hypertension by histopathology in lupus nephritis, 2005-2010 67 Figure 3.2.3.3 (c) Impaired renal function by histopathology in lupus nephritis, 2005-2010 67 Figure 3.2.4.1 Renal function by age group in lupus nephritis, 2005-2010 67 Figure 3.2.4.2 Renal function at presentation by gender in lupus nephritis, 2005-2010 68 Figure 3.2.6.2 ARA criteria in lupus nephritis by age group, 2005-2010 72 Figure 3.2.6.3 ARA criteria in lupus nephritis by gender, 2005-2010 72 Figure 3.2.6.4 ARA criteria in lupus nephritis by histopathology, 2005-2010 73 Figure 3.2.6.5 (a) Extra-renal involvement by gender in lupus nephritis, 2005-2010 74 Figure 3.2.6.5 (b) Mucocutaneous involvement by gender in lupus nephritis, 2005-2010 74 Figure 3.2.7.1 Patients survival estimates for death in lupus nephritis 75
Figure 3.2.7.2 Renal survival estimates for lupus nephritis 76
Figure 4.10.2 Patient survival by focal segmental glomerulosclerosis and minimal
change disease 86
Figure 4.10.3 Renal survival by focal segmental glomerulosclerosis and minimal change 88
Figure 4.11.6 Patients survival estimates for lupus nephritis 91
Figure 4.11.7 Renal survival of patients with lupus nephritis 91
Figure 5.2.1 Number of renal allograft biopsy, 2004-2010 96
Figure 5.2.3 Renal allograft biopsy by year and age group, rate per million population
2004-2010 97
Figure 5.4 Timing of renal allograft biopsy, 2004-2010 98
Figure 5.5.1 Biopsy method (censored for missing data), 2004-2010 99
Figure 5.5.2 Number of passes, 2004-2010 100
Figure 5.5.3 Number of glomeruli obtained on biopsy, 2004-2010 100
Figure 5.5.6 Histological diagnosis, 2004-2010 101
4th Report of the
Malaysian Registry of Renal Biopsy 2010
OVERVIEW OF RENAL BIOPSY IN MALAYSIA
1
CHAPTER 1
Overview Of Renal Biopsy In Malaysia
Wan Sha’ariah Md Yusuf
Lee Ming Lee
OVERVIEW OF RENAL BIOPSY IN MALAYSIA
4th Report of the Malaysian Registry of Renal Biopsy 2010
2
1.1: Introduction
The main aim of The Malaysian Registry of Renal Biopsy (MRRB) was to collect and published data from all hospitals performing renal biopsies. The data collected will be able to provide the pattern of glomerular disease in the country. Unlike the first MRRB Report 2007 which only included data from the Ministry of Health (MOH), the second MRRB Report 2008 and subsequent reports had included data from most hospitals in Malaysia performing renal biopsies.
This fourth MRRB Report 2010 will include data of renal biopsy performed in all participating centres in MOH centres, universities and private hospitals from 2005 to 2010. Renal biopsies performed and previously reported or unreported from all participating centres from 2005 onwards will also be updated and reported in this fourth MRRB report.
In 2011, the MRRB had attempted to come up with their annual publications in the next immediate year like the Malaysian Dialysis and Transplant Registry (MDTR) but failed to do so for various reasons. One of the major reasons was a number of participating centres had not sent in their data or if they had sent the data were incomplete. In future, MRRB hopes to provide data, which is truly a national registry, and also to provide the clinical course of the biopsied patients.
1.2: Renal biopsies from the participating centres
1.2.1 Ascertainment rate of total biopsy performed
From 2005 to 2010, there were a total of 45 participating centres: 23 centres (15 adult and 8 paediatric) were from Ministry of Health (MOH), 3 were from universities, 1 from the army and 18 centres were from private hospitals. All participating centres will be identified by their individual source document provider (SDP) number.
4
2005 2006 2007 2008 2009 2010 Total
Done Reported Done Reported Done Reported Done Reported Done Reported Done Reported Done Reported
n % n % n % n % n % n % n %
Table 1.2.1(a): Total number of biopsy performed and percentage of reported renal biopsies by centres, 2005-2010
OVERVIEW OF RENAL BIOPSY IN MALAYSIA
4th Report of the
O
2005 2006 2007 2008 2009 2010 Total
Done Reported Done Reported Done Reported Done Reported Done Reported Done Reported Done Reported
n % n % n % n % n % n % n %
Total 1150 63 1534 61 1320 74 1554 76 1528 74 1538 84 8624 72
OVERVIEW OF RENAL BIOPSY IN MALAYSIA
Malaysian Registry of Renal Biopsy 2010 4th Report of the4th Report of the
Malaysian Registry of Renal Biopsy 2010
OVERVIEW OF RENAL BIOPSY IN MALAYSIA
5
Table 1.2.1(b): Total number of reported and unreported renal biopsies, 2005-2010
Year 2005 2006 2007 2008 2009 2010 Total
Reported 720 937 977 1182 1134 1299 6249
Not reported 430 597 343 372 394 239 2375
Total performed 1150 1534 1320 1554 1528 1538 8624
Ascertainment rate (%) 62.6 61.1 74.0 76.1 74.2 84.5 72.1
1.2.2 Type of renal biopsy performed
O
2005 2006 2007 2008 2009 2010 Total
Native Graft Native Graft Native Graft Native Graft Native Graft Native Graft Native Graft
n n n n n n n n n n n n n n
Table 1.2.2: Distribution of reported native and graft renal biopsies by centre, 2005-2010
4
2005 2006 2007 2008 2009 2010 Total
Native Graft Native Graft Native Graft Native Graft Native Graft Native Graft Native Graft
n n n n n n n n n n n n n n
Total 649 71 819 118 853 124 1058 124 1001 133 1119 180 5499 750
OVERVIEW OF RENAL BIOPSY IN MALAYSIA
4th Report of the
Malaysian Registry of Renal Biopsy 2010
OVERVIEW OF RENAL BIOPSY IN MALAYSIA
4th Report of the Malaysian Registry of Renal Biopsy 2010
8
1.2.3: Number of renal biopsy done on each individual patient
The data captured in MRRB is year based. New biopsies and patients biopsied before 2005 were included. The number of biopsy episodes/attempts per patient was also recorded accordingly.
From 2005 to 2010, a total of 5415 patients underwent native renal biopsy. 4701 (86.8%) patients had renal biopsy for the first time, 574 (10.6%) patients had biopsy done twice, 120 (2.2%) patients had biopsy done thrice and 20 (0.4%) patients had four or more biopsies. Therefore about 13.2% of patients had a repeat native biopsy done (Table 1.2.3(a)).
Over the same period, 585 patients underwent renal allograft biopsy. 342(58.5%) patients had biopsy done once, 148(25.3%) patients had biopsy done twice, 55(9.4%) patients had biopsy done thrice and 40 patients had biopsy done four times or more (Table1.2.3 (b)). As expected, there was a higher rate of repeat graft biopsies (41.5 %) compared to native kidneys (13.2%).
Table 1.2.3(a): Distribution of native renal biopsy in patients by number of episodes, 2005-2010
Native 2005 2006 2007 2008 2009 2010 Total
n % n % n % n % n % n % n %
1st episode 559 87.1 704 87.1 731 86.7 919 88.1 847 86.3 941 85.8 4701 86.8
2nd episode 72 11.2 95 11.8 84 10.0 106 10.2 103 10.5 114 10.4 574 10.6
3rd episode 10 1.6 9 1.1 25 3.0 15 1.4 26 2.7 35 3.2 120 2.2
≥4th episode 1 0.2 0 0.0 3 0.4 3 0.3 6 0.6 7 0.6 20 0.4
Total Patient 642 100 808 100 843 100 1043 100 982 100 1097 100 5415 100
Table 1.2.3 (b): Distribution of renal allograft biopsy in patients by number of episodes/attempts, 2005-2010
Graft 2005 2006 2007 2008 2009 2010 Total
n % n % n % n % n % n % n %
4th Report of the
Malaysian Registry of Renal Biopsy 2010
OVERVIEW OF RENAL BIOPSY IN MALAYSIA
9
1.2.4: Demographic distribution of renal biopsy (Native and Graft)
1.2.4.1: Age distribution
About 84.2% of native biopsies were done in patients older than 15 years old and in this group, 91.3% of the biopsies were done in patients less than 55 years age. Very few (7.4%) biopsies were done in patients older than 55 years old. (Table 1.2.4.1 (a))
In the graft biopsy group, 95.1% were done in patients older than 15 years old and of these, 89.1% were in the age group of 15 to less than 55 years. Only 10.4% of the graft biopsies were done in those above 55 years of age. (Table 1.2.4.1(b))
For adults (age > 15years old) the highest number of renal biopsy was reported in Selangor (23.2%); followed by Wilayah Persekutuan Kuala Lumpur (22.9%) and Penang (11.7%). In the paediatric group (age < 15 years old), the highest number of renal biopsy were reported in WP Kuala Lumpur (27.2%); followed by Johor (21.6%) and Selangor (16.4%). (Table1.2.4.1 (c))
Table 1.2.4.1(a): Age distribution of native renal biopsy, 2005-2010
Age group (years)
2005 2006 2007 2008 2009 2010 Total
n n n n n n n %
<15 128 137 145 165 137 157 869 15.8
15-<24 173 237 226 308 295 307 1546 28.1
25-<35 143 183 194 227 227 254 1228 22.3
35-<45 116 126 132 143 156 187 860 15.6
45-<55 59 82 91 135 99 125 591 10.7
55-<65 18 41 44 51 48 67 269 4.9
> 65 12 13 21 29 39 22 136 2.5
Total 649 819 853 1058 1001 1119 5499 100
Table 1.2.4.1(b): Age distribution of renal allograft biopsy, 2005-2010
Age group (years)
2005 2006 2007 2008 2009 2010 Total
n n n n n n n %
O
Table 1.2.4.1(c): Age group distribution of reported renal biopsies by state, 2005-2010
Year of biopsy 2005 2006 2007
Age gp (years) Age < 15 Age ≥ 15 Age < 15 Age ≥ 15 Age < 15 Age ≥ 15
Total 128 100 592 100 142 100 795 100 152 100 825 100
4
OVERVIEW OF RENAL BIOPSY IN MALAYSIA
4th Report of the
Malaysian Registry of Renal Biopsy 2010
Year of biopsy 2008 2009 2010 Total
Age group Age < 15 Age ≥ 15 Age < 15 Age ≥ 15 Age < 15 Age ≥ 15 Age < 15 Age ≥ 15
Total 174 100 1008 100 145 100 989 100 165 100 1134 100 906 100 5343 100
OVERVIEW OF RENAL BIOPSY IN MALAYSIA
4th Report of the Malaysian Registry of Renal Biopsy 2010
12
1.2.4.2: Gender distribution
As in the previous MRRB report, in the native renal biopsy group, there were more females compared to males. This was probably due to the higher number of females among patients biopsied for SLE (Table 1.2.4.2(a)). However, in the graft biopsy group, there were more males (Table 1.2.4.2(b)). This is consistent with the trend of male predominance amongst the transplant patients as reported in the 19th Report of The Malaysian Dialysis and Transplant Registry.
Table 1.2.4.2(a): Gender distribution of native renal biopsy, 2005-2010
Gender 2005 2006 2007 2008 2009 2010 Total
n n n n n n n %
Male 237 341 323 430 398 444 2173 40.1
Female 405 467 520 613 584 653 3242 59.9
Total 642 808 843 1043 982 1097 5415 100
Table 1.2.4.2(b): Gender distribution of renal allograft biopsy, 2005-2010
Gender 2005 2006 2007 2008 2009 2010 Total
n n n n n n n %
Male 39 65 59 62 69 76 370 63.2
Female 23 36 36 41 35 44 215 36.8
Total 62 101 95 103 104 120 585 100
1.2.4.3: Racial distribution
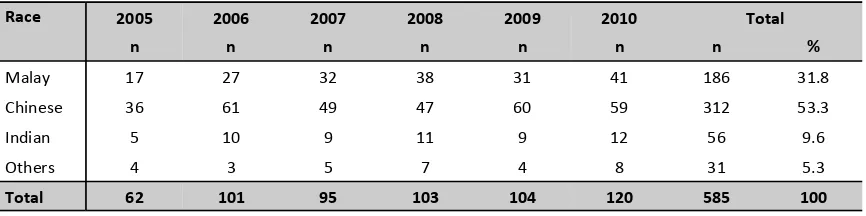
Among the patients who had native kidney biopsy, majority were Malays (57.3%), followed by Chinese (25.6%). (Table 1.2.4.3(a)) In the allograft biopsy group, majority of patients were Chinese (53.3%) followed by Malays (31.8%). (Table 1.2.4.3(b))
Table 1.2.4.3(a): Racial distribution of native renal biopsy, 2005-2010
Race 2005 2006 2007 2008 2009 2010 Total
n n n n n n n %
Malay 357 456 459 582 581 668 3103 57.3
Chinese 159 196 237 277 248 269 1386 25.6
Indian 46 59 61 70 70 53 359 6.6
Others 80 97 86 114 83 107 567 10.5
Total 642 808 843 1043 982 1097 5415 100
Table 1.2.4.3(b): Racial distribution of renal allograft biopsy, 2005-2010
Race 2005 2006 2007 2008 2009 2010 Total
n n n n n n n %
Malay 17 27 32 38 31 41 186 31.8
Chinese 36 61 49 47 60 59 312 53.3
Indian 5 10 9 11 9 12 56 9.6
Others 4 3 5 7 4 8 31 5.3
4th Report of the
Malaysian Registry of Renal Biopsy 2010
OVERVIEW OF RENAL BIOPSY IN MALAYSIA
13
1.2.5: Renal Biopsy Report Analysis
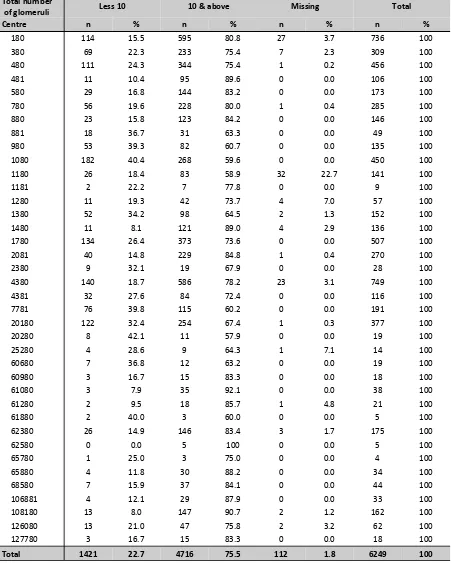
A total of 6249 renal biopsies were performed and reported from 2005 to 2010. One thousand four hundred twenty-one (22.7%) of the biopsies yielded less than 10 glomeruli, which our pathologist defined as the minimum number of glomeruli required to label a biopsy specimen adequate. One hundred twelve (1.8%) biopsies were classified as missing because the histopathology reports were not submitted to MRRB. The remaining 75.5% reported 10 or more glomeruli.
Table 1.2.5: Number of glomeruli obtained at each biopsy by centres, 2005-2010
Total number
of glomeruli Less 10 10 & above Missing Total
Centre n % n % n % n %
OVERVIEW OF RENAL BIOPSY IN MALAYSIA
4th Report of the Malaysian Registry of Renal Biopsy 2010
14
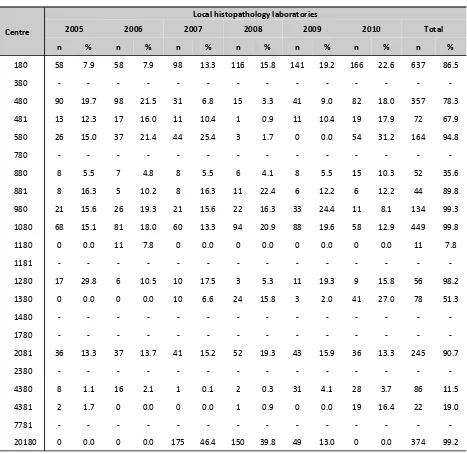
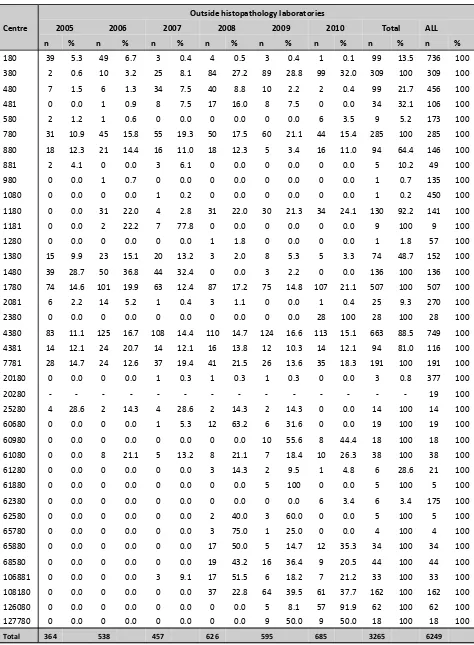
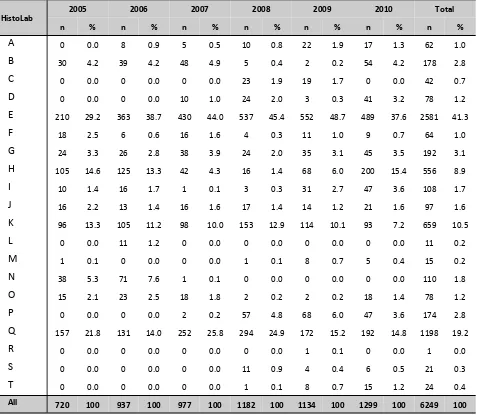
1.2.6: Histopathology specimen distribution to histopathology laboratories
As shown in Table 1.2.6 (a) and (b), not all biopsies performed at the centres were read by the local histo-pathologists. A number of the renal biopsy specimens were sent to other centres for processing and
reporting. A total of 47.8% of HPE slides were read locally and 52.2% were sent to another laboratory (Table 1.2.6 (c)). The histopathology laboratories were coded alphabetically (Table 1.2.6 (d)).
Table 1.2.6 (a): Distribution of biopsy specimens to local histopathology laboratories by participating centres, 2005-2010
Centre
Local histopathology laboratories
2005 2006 2007 2008 2009 2010 Total
4th Report of the
Malaysian Registry of Renal Biopsy 2010
OVERVIEW OF RENAL BIOPSY IN MALAYSIA
15
Table 1.2.6(b): Distribution of biopsy specimens to outside histopathology laboratories by participating centres, 2005-2010
Centre
Outside histopathology laboratories
2005 2006 2007 2008 2009 2010 Total ALL
n % n % n % n % n % n % n % n %
4380 83 11.1 125 16.7 108 14.4 110 14.7 124 16.6 113 15.1 663 88.5 749 100
4381 14 12.1 24 20.7 14 12.1 16 13.8 12 10.3 14 12.1 94 81.0 116 100
OVERVIEW OF RENAL BIOPSY IN MALAYSIA
4th Report of the Malaysian Registry of Renal Biopsy 2010
16
Table 1.2.6(c): Summary of biopsies received by local and external laboratories, 2007-2010
2007 (1st report) 2008 (2nd report) 2009 (3rd Report) 2010 (4th Report)
n % n % n % n %
Local Lab 1085 44.9 1799 47.6 2360 48.5 2984 47.8
External Lab 1334 55.1 1978 52.4 2506 51.5 3265 52.2
All Lab 2419 100 3777 100 4866 100 6249 100
Table 1.2.6 (d): Histopathology laboratories receiving renal biopsy specimens, 2005-2010
HistoLab
2005 2006 2007 2008 2009 2010 Total
n % n % n % n % n % n % n %
4th Report of the
Malaysian Registry of Renal Biopsy 2010
OVERVIEW OF RENAL BIOPSY IN MALAYSIA
17
1.3: Native kidney biopsy
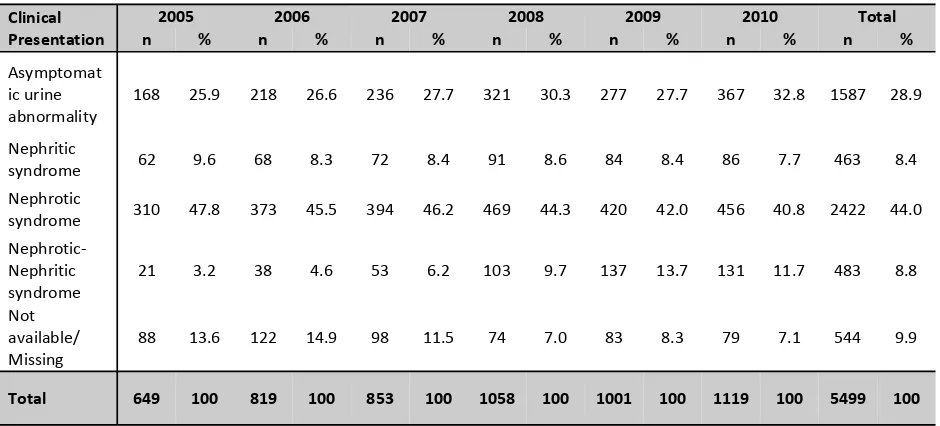
1.3.1: Clinical Indications of renal biopsy
As reported in previous MRRB Report, the main indications for native kidney biopsies were nephrotic syndrome (44%) followed by urinary abnormalities (28.9%) (Table 1.3.1(a)). A total of 2908 (52.9%) patients had normal renal function at time of biopsy, 35.9% had impaired renal function and for the remaining 11.3%, renal function was either not available or unknown at time of biopsy Table 1.3.1 (b)).
Table 1.3.1(a): Indications for native renal biopsies, 2005-2010
Clinical Presentation
2005 2006 2007 2008 2009 2010 Total
n % n % n % n % n % n % n %
Asymptomat ic urine abnormality
168 25.9 218 26.6 236 27.7 321 30.3 277 27.7 367 32.8 1587 28.9
Nephritic
syndrome 62 9.6 68 8.3 72 8.4 91 8.6 84 8.4 86 7.7 463 8.4
Nephrotic
syndrome 310 47.8 373 45.5 394 46.2 469 44.3 420 42.0 456 40.8 2422 44.0
Nephrotic-Total 649 100 819 100 853 100 1058 100 1001 100 1119 100 5499 100
Table 1.3.1(b): Renal function at time of biopsy, 2005-2010
Renal function 2005 2006 2007 2008 2009 2010 Total
n % n % n % n % n % n % n %
Normal 361 55.6 416 50.8 475 55.7 580 54.8 495 49.5 581 51.9 2,908 52.9
Impaired 150 23.1 239 29.2 293 34.3 400 37.8 430 43.0 460 41.1 1,972 35.9
Not available/
Missing 138 21.3 164 20.0 85 10.0 78 7.4 76 7.6 78 7.0 619 11.3
Total 649 100 819 100 853 100 1058 100 1001 100 1119 100 5499 100
1.3.2: Histopathological Diagnosis
In the native kidney biopsy group, the three most common primary glomerulonephritis (GN) reported were minimal change disease (33.5%), focal segmental glomerulosclerosis (FSGS) (21.8%) and Ig A nephropathy (18.7%). Membranous nephropathy only comprises 8.0% of the total primary GN subgroup (Table 1.3.2).
Lupus nephritis was the commonest secondary GN, accounting for 82.4% of cases, followed by diabetic nephropathy (9.1%) (Table 1.3.2).
O
OVERVIEW OF RENAL BIOPSY IN MALAYSIA
Malaysian Registry of Renal Biopsy 2010 4th Report of theType
Histopathological Diagnosis 2005 2006 2007 2008 2009 2010 Total
n % n % n % n % n % n % n %
Primary GN
(n=2514) Minimal Change
93 32.1 107 28.3 130 36.1 182 36.9 159 34.2 171 32.4 842 33.5
FSGS 103 35.5 145 38.4 115 31.9 137 27.8 148 31.8 150 28.4 798 31.7
lg A nephropathy 37 12.8 62 16.4 59 16.4 101 20.5 93 20.0 117 22.2 469 18.7
Membranous nephropathy 23 7.9 33 8.7 35 9.7 40 8.1 28 6.0 41 7.8 200 8.0
Membrano-proliferative 12 4.1 10 2.6 4 1.1 7 1.4 7 1.5 4 0.8 44 1.8
Mesangial Pol: non-IgA 15 5.2 10 2.6 12 3.3 11 2.2 14 3.0 21 4.0 83 3.3
Crescentic ANCA 1 0.3 1 0.3 0 0.0 4 0.8 2 0.4 2 0.4 10 0.4
Idiopathic Crescentic 6 2.1 10 2.6 4 1.1 4 0.8 5 1.1 10 1.9 39 1.6
Not available/Missing 0 0.0 0 0.0 1 0.3 7 1.4 9 1.9 12 2.3 29 1.2
Subtotal 290 100 378 100 360 100 493 100 465 100 528 100 2514 100
Secondary GN (n=2318)
Other Infection 0 0.0 1 0.3 1 0.3 5 1.2 1 0.3 4 0.9 12 0.5
Lupus Nephritis 270 89.4 310 85.4 321 82.3 353 81.3 309 78.6 348 79.8 1911 82.4
HSP* 3 1.0 2 0.6 2 0.5 14 3.2 8 2.0 4 0.9 33 1.4
Diabetic nephropathy 8 2.6 27 7.4 40 10.3 37 8.5 47 12.0 51 11.7 210 9.1
Anti GBM 0 0.0 0 0.0 0 0.0 0 0.0 0 0.0 1 0.2 1 0.0
Immunotactoid /fibrillary GN 0 0.0 0 0.0 0 0.0 0 0.0 0 0.0 0 0.0 0 0.0
Multiple myeloma 0 0.0 1 0.3 2 0.5 1 0.2 4 1.0 1 0.2 9 0.4
Not available/Missing 0 0.0 0 0.0 3 0.8 4 0.9 4 1.0 3 0.7 14 0.6
Subtotal 302 100 363 100 390 100 434 100 393 100 436 100 2318 100
Tubulo- interstitial disease (n=383)
Acute interstitial nephritis 5 23.8 8 16.3 10 18.2 22 23.2 17 18.1 21 30.4 83 21.7
Acute tubular-necrosis 10 47.6 32 65.3 33 60.0 33 34.7 38 40.4 29 42.0 175 45.7
Chronic interstitial 6 28.6 9 18.4 11 20.0 37 38.9 39 41.5 19 27.5 121 31.6
Not available/Missing 0 0.0 0 0.0 1 1.8 3 3.2 0 0.0 0 0.0 4 1.0
Subtotal 21 100 49 100 55 100 95 100 94 100 69 100 383 100
4
OVERVIEW OF RENAL BIOPSY IN MALAYSIA
4th Report of the
Malaysian Registry of Renal Biopsy 2010
Type
Histopathological Diagnosis 2005 2006 2007 2008 2009 2010 Total
n % n % n % n % n % n % n %
OVERVIEW OF RENAL BIOPSY IN MALAYSIA
4th Report of the Malaysian Registry of Renal Biopsy 2010
20
1.3.3: Histopathology findings in common clinical presentation
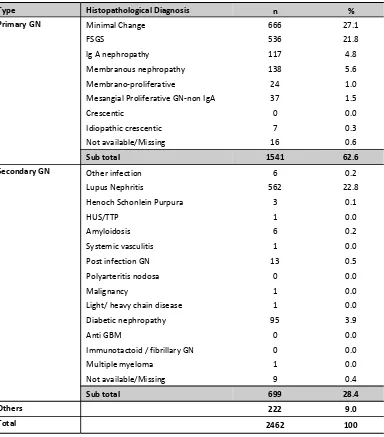
1.3.3.1: Histopathological diagnosis in patients with nephrotic syndrome
In patients presenting with nephrotic syndrome, the commonest histopathology reported was minimal change (27.1%), followed by lupus nephritis (22.8%) and focal segmental glomerulosclerosis (21.8%) (Table 1.3.3.1).
Table 1.3.3.1: HPE diagnosis in patients presenting with Nephritic Syndrome, 2005-2010
Type Histopathological Diagnosis n %
Primary GN Minimal Change 666 27.1
FSGS 536 21.8
lg A nephropathy 117 4.8
Membranous nephropathy 138 5.6
Membrano-proliferative 24 1.0
Mesangial Proliferative GN-non IgA 37 1.5
Crescentic 0 0.0
Idiopathic crescentic 7 0.3
Not available/Missing 16 0.6
Sub total 1541 62.6
Secondary GN Other infection 6 0.2
Lupus Nephritis 562 22.8
Henoch Schonlein Purpura 3 0.1
HUS/TTP 1 0.0
Amyloidosis 6 0.2
Systemic vasculitis 1 0.0
Post infection GN 13 0.5
Polyarteritis nodosa 0 0.0
Malignancy 1 0.0
Light/ heavy chain disease 1 0.0
Diabetic nephropathy 95 3.9
Anti GBM 0 0.0
Immunotactoid / fibrillary GN 0 0.0
Multiple myeloma 1 0.0
Not available/Missing 9 0.4
Sub total 699 28.4
Others 222 9.0
Total 2462 100
4th Report of the
Malaysian Registry of Renal Biopsy 2010
OVERVIEW OF RENAL BIOPSY IN MALAYSIA
21
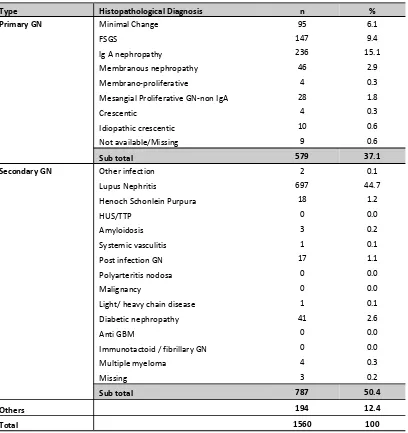
1.3.3.2: Histopathological diagnosis in patients with asymptomatic urinary abnormalities
In patients presenting with urinary abnormalities, IgA (15.1%) was the commonest histopathology reported in the primary GN group; while the most common secondary GN was lupus nephritis (44.7%) (Table1.3.3.2).
Table 1.3.3.2: HPE diagnosis in Patients presenting with Asymptomatic Urine Abnormalities, 2005-2010
Type Histopathological Diagnosis n %
Primary GN Minimal Change 95 6.1
FSGS 147 9.4
lg A nephropathy 236 15.1
Membranous nephropathy 46 2.9
Membrano-proliferative 4 0.3
Mesangial Proliferative GN-non IgA 28 1.8
Crescentic 4 0.3
Idiopathic crescentic 10 0.6
Not available/Missing 9 0.6
Sub total 579 37.1
Secondary GN Other infection 2 0.1
Lupus Nephritis 697 44.7
Henoch Schonlein Purpura 18 1.2
HUS/TTP 0 0.0
Amyloidosis 3 0.2
Systemic vasculitis 1 0.1
Post infection GN 17 1.1
Polyarteritis nodosa 0 0.0
Malignancy 0 0.0
Light/ heavy chain disease 1 0.1
Diabetic nephropathy 41 2.6
Anti GBM 0 0.0
Immunotactoid / fibrillary GN 0 0.0
Multiple myeloma 4 0.3
Missing 3 0.2
Sub total 787 50.4
Others 194 12.4
Total 1560 100
OVERVIEW OF RENAL BIOPSY IN MALAYSIA
4th Report of the Malaysian Registry of Renal Biopsy 2010
22
1.3.3.3: Histopathological diagnosis in patients with nephritic-nephrotic syndrome
In patients presenting with Nephritic-nephrotic syndrome the commonest histopathology diagnosis among the primary GN were FSGS (8.0%) and Ig A nephropathy (7.8%) while among the secondary GN was lupus nephritis (48.1%) (Table 1.3.3.3).
Table 1.3.3.3 : HPE diagnosis in patients presenting with Nephritic-Nephrotic, 2005-2010
Type Histopathological Diagnosis n %
Primary GN Minimal Change 34 6.6
FSGS 41 8.0
lg A nephropathy 40 7.8
Membranous nephropathy 7 1.4
Membrano-proliferative 8 1.6
Mesangial Proliferative GN-non IgA 6 1.2
Crescentic 1 0.2
Idiopathic cresentic 5 1.0
Sub total 142 27.7
Secondary GN Other infection 3 0.6
Lupus Nephritis 247 48.1
Henoch Schonlein Purpura 5 1.0
HUS/TTP 0 0.0
Amyloidosis 0 0.0
Systemic vasculitis 2 0.4
Post infection GN 25 4.9
Polyarteritis nodosa 0 0.0
Malignancy 1 0.2
Light/ heavy chain disease 0 0.0
Diabetic nephropathy 16 3.1
Anti GBM 0 0.0
Immunotactoid / fibrillary GN 0 0.0
Multiple myeloma 1 0.2
Missing 1 0.2
Sub total 301 58.7
Others 70 13.6
Total 513 100
4th Report of the
Malaysian Registry of Renal Biopsy 2010
OVERVIEW OF RENAL BIOPSY IN MALAYSIA
23
1.3.3.4: Histopathological diagnosis in patients with nephritic syndrome
In patients presenting with acute nephritic syndrome, the commonest GN is lupus nephritis (43.4%) (Table 1.3.3.4).
Table 1.3.3.4: HPE diagnosis in Patients presenting with Nephritic syndrome, 2005-2010
Type Histopathological Diagnosis n %
Primary GN Minimal Change 30 6.5
FSGS 40 8.6
lg A nephropathy 39 8.4
Membranous nephropathy 3 0.6
Membrano-proliferative 7 1.5
Mesangial Proliferative GN-non IgA 8 1.7
Crescentic 4 0.9
Idiopathic cresentic 9 1.9
Unknown 4 0.9
Sub total 144 31.0
Secondary GN Other infection 0 0.0
Lupus Nephritis 202 43.4
Henoch Schonlein Purpura 5 1.1
HUS/TTP 0 0.0
Amyloidosis 1 0.2
Systemic vasculitis 4 0.9
Post infectious GN 34 7.3
Polyarteritis nodosa 0 0.0
Malignancy 0 0.0
Light/ heavy chain disease 0 0.0
Diabetic nephropathy 11 2.4
Anti GBM 1 0.2
Immunotactoid / fibrillary GN 0 0.0
Multiple myeloma 0 0.0
Sub total 258 55.5
Others 63 13.5
Total 465 100
O
1.3.3.5 Primary GN according to various age groups
FSGS was the commonest GN in the <15 years age group (42.3%) followed by minimal change disease (36.8%). This is probably due to that steroid sensitive children are not biopsied. Among the adults between 25 - <55 years old, FSGS (30.1%) and minimal change disease (26.9%) were the two commonest GN. The commonest GN in the 15- 25 years age group was minimal change disease (45%). In patients above 55 years of age, the commonest primary GN was FSGS (30.6%) followed by membranous nephropathy (25.8%) (Table 1.3.3.5).
Table 1.3.3.5 : Table for Primary Glomerulonephritis, 2005-2010
Histopathological Diagnosis <15 15-<25 25-<35 35-<45 45-<55 55-<65 ≥65 Total
n % n % n % n % n % n % n % n %
Minimal change disease 174 36.8 332 45.0 150 29.5 89 24.0 61 25.6 25 21.0 11 16.4 842 33.5
FSGS 200 42.3 205 27.8 156 30.7 114 30.7 66 27.7 35 29.4 22 32.8 798 31.7
Ig A Nephropathy 48 10.1 130 17.6 125 24.6 93 25.1 47 19.7 19 16.0 7 10.4 469 18.7
Membranous nephropathy 12 2.5 20 2.7 36 7.1 39 10.5 45 18.9 28 23.5 20 29.9 200 8.0
Membrano proliferative 7 1.5 11 1.5 11 2.2 8 2.2 3 1.3 3 2.5 1 1.5 44 1.8
Total 473 100 738 100 508 100 371 100 238 100 119 100 67 100 2514 100
4th Report of the
Malaysian Registry of Renal Biopsy 2010
OVERVIEW OF RENAL BIOPSY IN MALAYSIA
25
Figure 1.3.3.5: Primary gromerulonephritis according to the various age group, 2005-2010
0
<15 15-<25 25-<35 35-<45 45-<55 55-<65 ≥65
P
Minimal change disease FSGS Ig A Nephropathy
OVERVIEW OF RENAL BIOPSY IN MALAYSIA
4th Report of the Malaysian Registry of Renal Biopsy 2010
4th Report of the
Malaysian Registry of Renal Biopsy 2010
PRIMARY GLOMERULONEPHRITIS
27
CHAPTER 2
PRIMARY GLOMERULONEPHRITIS
PRIMARY GLOMERULONEPHRITIS
4th Report of the Malaysian Registry of Renal Biopsy 2010
28
2.1 Introduction
This chapter covers the main primary glomerulonephritides that were reported to the MRRB from the years 2005-2010.
Minimal change disease is the commonest glomerulonephritis in adults, contributing 33% of all primary glomerulonephritis in Malaysia. This was followed by focal segmental glomerulosclerosis (29%) and Ig A nephropathy (21%). Idiopathic membranous nephropathy contributed only 9% of all biopsy-proven primary glomerulonephritis. The other types of primary glomerulonephritis were relatively uncommon (Table 2.1).
Table 2.1: Primary Glomerulonephritis, 2005-2010
2.2: Minimal change disease
2.2.1: Introduction
4th Report of the
Malaysian Registry of Renal Biopsy 2010
PRIMARY GLOMERULONEPHRITIS
29
2.2.2: Patient population and characteristics
A total of 668 cases of minimal change disease were reported in 2005-2010. The mean age of the patients at the time of biopsy was 29.6 ± 12.9 years with a clear predominance in second and third decades of life. Up to 72% of the cases belonged to age groups 15 to <25 and 25 to <35. However, it is important to bear in mind that children with steroid responsive nephrotic syndrome are usually not biopsied; hence the actual incidence of minimal change disease in the paediatric age group is under-represented. The diagnosis of minimal change disease is relatively rare after 55 years of age and our reported frequency was only about 5% in this age group.
There was a higher incidence of minimal change disease in male (66%) as compared to female (34%) (Table 2.2.2 (a)). In terms of racial distribution, there was no predilection of any particular ethnic group. The racial group distribution in Malay, Chinese and Indian was 61%, 19% and 5% (Table 2.2.2 (a)). This pattern of distribution reflects the ethnic composition of patients admitted to public hospitals.
Table 2.2.2(a): Demographic characteristics for MCD, 2005-2010
Demographic Characteristics n %
Age (year)
PRIMARY GLOMERULONEPHRITIS
4th Report of the Malaysian Registry of Renal Biopsy 2010
30
Figure 2.2.2 (b): Age at time of biopsy (years) MCD, 2005-2010
Figure 2.2.2 (b): Age at time of biopsy (years) MCD, 2005-2010
Age group (years)
2005 2006 2007 2008 2009 2010 Total
n % n % n % n % n % n % n %
15-<25 32 42.7 49 57.0 43 49.4 80 53.3 69 53.1 59 42.1 332 49.7
25-<35 20 26.7 20 23.3 17 19.5 35 23.3 28 21.5 30 21.4 150 22.5
35-<45 11 14.7 10 11.6 14 16.1 12 8.0 18 13.8 24 17.1 89 13.3
45-<55 10 13.3 4 4.7 6 6.9 12 8.0 8 6.2 21 15.0 61 9.1
55-<65 1 1.3 2 2.3 5 5.7 9 6.0 3 2.3 5 3.6 25 3.7
≥65 1 1.3 1 1.2 2 2.3 2 1.3 4 3.1 1 0.7 11 1.6
Total 75 100 86 100 87 100 150 100 130 100 140 100 668 100
2.2.3: Clinical presentation
Nephrotic syndrome was the most common clinical presentation (78%), followed by asymptomatic urine abnormality (12%), nephritic syndrome (3%) and nephritic-nephrotic syndrome (4%) (Table & 2.2.3(a)).
4th Report of the
Malaysian Registry of Renal Biopsy 2010
PRIMARY GLOMERULONEPHRITIS
31 Figure 2.2.3 (a): Overall clinical presentation for MCD, 2005-2010
Table 2.2.3 (b): Hypertension in MCD, 2005-2010 Table 2.2.3 (a): Clinical presentation for MCD, 2005-2010
PRIMARY GLOMERULONEPHRITIS
4th Report of the Malaysian Registry of Renal Biopsy 2010
32
Table 2.2.3 (c): Renal function in MCD by year, 2005-2010 Figure 2.2.3 (b): Presence of hypertension in MCD, 2005-2010
GFR
*46 cases are missing on GFR, including 15 cases with GFR>200 (GFR range between 201 to 3349)
Figure 2.2.3 (c): Impaired renal function in MCD by year, 2005-2010
0
2005 2006 2007 2008 2009 2010
P
2005 2006 2007 2008 2009 2010
4
2.2.3.1: Clinical presentation by age
Nephrotic syndrome was the most common clinical presentation for minimal change disease throughout all age groups (Table 2.2.3.1). However, the presence of hypertension increased with increasing age (Figure 2.2.3.1(b)). The same pattern was observed for impaired eGFR. Patients with impaired renal function (eGFR< 60ml/min/1.73m2) were 44% and 64% respectively for age groups 55 to <65 and ≥65.
Table 2.2.3.1 (a): Clinical presentation by age group for MCD, 2005-2010
Table 2.2.3.1 (b): Presence of hypertension by age group for MCD, 2005-2010 Clinical
OVERVIEW OF RENAL BIOPSY IN MALAYSIA
4th Report of the
PRIMARY GLOMERULONEPHRITIS
4th Report of the Malaysian Registry of Renal Biopsy 2010
34
Figure 2.2.3.1 (b): Presence of hypertension by age group for MCD, 2005-2010
0
15-<25 25-<35 35-<45 45-<55 55-<65 ≥65
P
Table 2.2.3.1 (c): Renal function at presentation by age group for MCD, 2005-2010
0
*Total of 46 cases are missing on GFR, including 15 cases with GFR>200 (GFR range between 201 to 3349)
4th Report of the
Malaysian Registry of Renal Biopsy 2010
PRIMARY GLOMERULONEPHRITIS
35
2.2.3.2: Clinical presentation by gender
There was no difference between genders in terms of clinical presentation, except perhaps a lower threshold for renal biopsy for asymptomatic urine abnormality in females. There was no difference in presence of hypertension and renal function at presentation (Table 2.2.3.2 (a, b & c)). Both genders have relatively well preserved renal func-tion with less than 20% with eGFR <60 ml/min/1.72 m2 (Figure 2.2.3.2 (c)).
Clinical Presentations Male Female
n % n %
Asymptomatic urine abnormality 41 9.4 38 16.5
Nephritic syndrome 14 3.2 8 3.5
Nephrotic syndrome 344 78.5 178 77.4
Nephritic-Nephrotic syndrome 28 6.4 0 0.0
Not available 11 2.5 6 2.6
Total 438 100 230 100
Table 2.2.3.2 (a): Clinical presentation by gender for MCD, 2005-2010
0
Hypertension Male Female
n % n %
Present 72 16.4 41 17.8
Absent 340 77.6 178 77.4
Not available/ Missing 26 5.9 11 4.8
Total 438 100 230 100
Table 2.2.3.2 (b): Hypertension by gender for MCD, 2005-2010
PRIMARY GLOMERULONEPHRITIS
4th Report of the Malaysian Registry of Renal Biopsy 2010
36
Table 2.2.3.2 (c): Renal function by gender for MCD, 2005-2010
eGFR
*Total of 46 cases are missing on GFR, including 15 cases with GFR>200 (GFR range between 201 to 3349)
Figure 2.2.3.2 (c): Impaired renal function by gender for MCD, 2005-2010
4th Report of the
Malaysian Registry of Renal Biopsy 2010
PRIMARY GLOMERULONEPHRITIS
37
2.3: Focal Segmental Glomerulosclerosis
2.3.1: Introduction
Focal segmental glomerulosclerosis is defined on histological criteria by segmental capillary obliteration with increased mesangial matrix deposition, intra-capillary hyaline deposits and focal adhesions of the capillary tuft to Bowman’s capsule.
2.3.2: Patient Population and Characteristics
A total of 598 cases of FSGS were reported in our six-year registry data. The mean age at the time of biopsy was 33.9 ± 14.4 (Table 2.3.2 (a)). FSGS was mainly diagnosed in young patients. Up to 80% of patients were less than 45 years old. (Table & Figure 2.3.2 (b)). FSGS was slightly more common in males (57%) as compared to females (43%) (Table 2.3.2(a)). The distribution according to ethnicity was 63% in Malays, 18% in Chinese, 7% in Indians and 12% in others (Table 2.3.2(a)).
Table 2.3.2 (a): Demographic characteristics for FSGS, 2005-2010
Demographic Characteristics n=598 %
Age
Figure 2.3.2(a): Demographic characteristics for FSGS, 2005-2010
PRIMARY GLOMERULONEPHRITIS
4th Report of the Malaysian Registry of Renal Biopsy 2010
38
Table 2.3.2 (b): Age group at time of biopsy (years) for FSGS, 2005-2010
Figure 2.3.2 (b): Age at time of biopsy (years) for FSGS, 2005-2010
Age
Age at time of biopsy (years)
2.3.3: Clinical presentation
Nephrotic syndrome was the most common clinical presentation (61%), followed by asymptomatic urine abnormality (24%), nephritic-nephrotic syndrome (6%) and nephritic syndrome (5%) (Table & Figure 2.3.3(a)).
4th Report of the
Malaysian Registry of Renal Biopsy 2010
PRIMARY GLOMERULONEPHRITIS
39 Figure 2.3.3 (a): Overall clinical presentation for FSGS, 2005-2010
Table 2.3.3 (b): Hypertension in FSGS, 2005-2010 Table 2.3.3 (a): Clinical presentation for FSGS, 2005-2010
PRIMARY GLOMERULONEPHRITIS
4th Report of the Malaysian Registry of Renal Biopsy 2010
40
Figure 2.3.3 (b): Hypertension in FSGS, 2005-2010
Table 2.3.3 (c): Renal function in FSGS by year, 2005-2010
GFR (ml/
*Total of 37 cases are missing on GFR, including 9 cases with GFR>200 (GFR range between 205 to 511)
Figure 2.3.3 (c): Impaired renal function in FSGS by year, 2005-2010 0
2005 2006 2007 2008 2009 2010
P
2005 2006 2007 2008 2009 2010
4th Report of the
Malaysian Registry of Renal Biopsy 2010
PRIMARY GLOMERULONEPHRITIS
41
2.3.3.1: Clinical presentation by age
Nephrotic syndrome consistently predominated the clinical presentation throughout all age groups particularly in the very young (below 25 years) and those above 55 years. The prevalence of hypertension increased with increasing age (Figure 2.3.3.1(b)). Similarly, a higher percentage of patients had impaired renal function with increasing age - up to 57% and 77% of patients presented with impaired renal function for age groups 55-<65 and >65 respectively. (Table & Figure 2.3.3.1(c)).
Table 2.3.3.1 (a): Clinical presentation by age group for FSGS, 2005-2010
Table 2.3.3.1 (b): Hypertension by age group for FSGS, 2005-2010
Age group
Figure 2.3.3.1 (b): Hypertension by age group for FSGS, 2005-2010
0
15- <25 25-<35 35-<45 45-<55 55-<65 ≥ 65
PRIMARY GLOMERULONEPHRITIS
4th Report of the Malaysian Registry of Renal Biopsy 2010
42
Figure 2.3.3.1 (c): Renal function at presentation by age group for FSGS, 2005-2010
2.3.3.2: Clinical presentation by gender
From the 6 years of collected data, nephrotic syndrome appeared slightly more common in male while more females presented with asymptomatic urine abnormality. (Table 2.3.3.2(a)). There was no difference in the prevalence of hypertension in both genders (Figure 2.3.3.2(b)) and renal function at presentation showed similar trends .
Table 2.3.3.2 (a): Clinical presentation by gender for FSGS, 2005-2010
Table 2.3.3.1 (c): Renal function at presentation by age group for FSGS, 2005-2010
GFR
*Total of 37 cases are missing on GFR, including 9 cases with GFR>200 (GFR range between 205 to 511)
Clinical Presentations Male Female
n % n % n %
Asymptomatic urine abnormality 62 18.2 81 31.5 143 23.9
Nephritic syndrome 17 5.0 14 5.4 31 5.2
Nephrotic syndrome 226 66.3 136 52.9 362 60.5
Nephritic-Nephrotic syndrome 21 6.2 12 4.7 33 5.5
Not available/Missing 15 4.4 14 5.4 29 4.8
4th Report of the
Malaysian Registry of Renal Biopsy 2010
PRIMARY GLOMERULONEPHRITIS
43
Hypertension Male Female
n % n % n % Table 2.3.3.2 (b): Hypertension by gender in FSGS, 2005-2010
Figure 2.3.3.2 (b): Hypertension by gender in FSGS, 2005-2010
Table 2.3.3.2 (c): Renal function by gender for FSGS, 2005-2010
*Total of 37 cases are missing on GFR, including 9 cases with GFR>200 (GFR range between 205 to 511)