Full Terms & Conditions of access and use can be found at
http://www.tandfonline.com/action/journalInformation?journalCode=cbie20
Download by: [Universitas Maritim Raja Ali Haji] Date: 19 January 2016, At: 19:48
ISSN: 0007-4918 (Print) 1472-7234 (Online) Journal homepage: http://www.tandfonline.com/loi/cbie20
Indonesia's new national accounts
Pierre van der Eng
To cite this article: Pierre van der Eng (2005) Indonesia's new national accounts, Bulletin of Indonesian Economic Studies, 41:2, 243-252, DOI: 10.1080/00074910500218418
To link to this article: http://dx.doi.org/10.1080/00074910500218418
Published online: 18 Jan 2007.
Submit your article to this journal
Article views: 94
View related articles
Bulletin of Indonesian Economic Studies, Vol. 41, No. 2, 2005: 243–52
ISSN 0007-4918 print/ISSN 1472-7234 online/05/020243-10 © 2005 Indonesia Project ANU DOI: 10.1080/00074910500218418
a*I thank Mr Supriyanto SE MA, Director, Directorate of Production Accounts (Direktorat
Neraca Produksi), BPS, and Drs Abdul Rachman SE, Director, Directorate of Consumption Accounts (Direktorat Neraca Konsumsi), BPS, and their staff members, for providing information about the recent revision of the national accounts of Indonesia.
INDONESIA’S NEW NATIONAL ACCOUNTS
Pierre van der Enga*
The Australian National University
This note addresses some of the main changes in Indonesia’s national accounts, from 2000. These have resulted in higher estimates of GDP and slightly higher rates of GDP growth. The changes are part of a regular cycle of revisions and improve-ments in national accounting by the central statistics agency, BPS. On the output side, the higher level of GDP in 2000 is mainly due to upward revisions of value added in manufacturing industry, banking and trade. On the expenditure side, the higher level is mainly due to an upward revision of exports and the introduction of an estimate of investment in inventories. The choice of a new base year has resulted in higher weights for sectors with relatively high growth. This explains the higher rates of total GDP growth during 2000–03.
INTRODUCTION
BPS (Badan Pusat Statistik), the central statistics agency in Indonesia, regularly revises the national accounts data it publishes. The revision in the mid-1990s of the published national accounts data since 1993 was the subject of an earlier note (Van der Eng 1999) that argued that the revision was part of the ongoing process in BPS of improvements to the reporting, coverage and processing of data used to generate the national accounts. In recent publications, particularly Indikator Ekonomi[Economic Indicators] since April 2004, BPS has presented the results of the latest national accounts revision, providing new quarterly and annual esti-mates for 2000–04. As with earlier revisions, BPS did not release information into the public domain to explain the kinds of revisions that caused the significant dis-crepancies between the old and new series in the overlapping years 2000 and 2001 (2002 and 2003 of both the old and the new series are still preliminary and very preliminary, respectively).
As a consequence of the latest revision there are now two very different sets of published estimates of GDP (table 1). For example, GDP at market prices for 2000 was previously put at Rp 1,265 trillion but is now stated as Rp 1,390 trillion. The difference is equivalent to $14.8 billion, or a significant $72 in per capita terms. In addition, annual average GDP growth during 2000–03 is higher by 0.5 percentage points. This note takes stock of some of the changes in national accounting to
TABLE 1 Indonesia’s GDP Aggregates and Implicit Deflators Before and After the Revision
2000 2001 2002 2003
GDP in current prices(Rp trillion)
Before revision 1,265 1,468 1,611 1,787
After revision 1,390 1,684 1,898 2,087
GDP in constant prices(Rp trillion)
Before revision (1993 prices) 398 412 427 444
Before revision (converted to 2000 prices) 1,265 1,309 1,357 1,412
After revision (2000 prices) 1,390 1,443 1,504 1,572
Implicit GDP deflator(2000 = 100)
Before revision (1993 base year) 100.0 112.2 118.7 126.5
After revision (2000 base year) 100.0 116.7 126.2 132.7
Annual Annual growth rates (% p.a.) 2000–01 2001–02 2002–03 Average
GDP in current prices
Before revision 16.0 9.7 10.9 12.2
After revision 21.2 12.7 10.0 14.6
GDP in constant prices
Before revision (1993 prices) 3.5 3.7 4.1 3.7
After revision (2000 prices) 3.8 4.3 4.5 4.2
Implicit GDP deflator
Before revision (1993 base year) 12.2 5.8 6.6 8.2
After revision (2000 base year) 16.7 8.1 5.2 10.0
Sources: BPS (2004b): tables 1–2; BPS, Indikator Ekonomi, September 2004: tables 9.1–9.2.
explain the main discrepancies between the old and new national accounts data. It relies mainly on scant information in the public domain and on interviews con-ducted at BPS in February 2005.
REVISIONS
Since responsibility for the compilation of Indonesia’s national accounts was transferred to BPS in 1960, the organisation has revised its methodology for the compilation of the national accounts four times. Except for the first revision in 1970, the revisions were based on improvements in the acquisition and coverage
Indonesia’s New National Accounts 245
1In comparison, the 1990 I–O table was published in March 1994; the first revision of the
national accounts was not published until February 1996.
of basic data on output, prices and expenditure, and on special surveys con-ducted in order to shed light on the many input–output (I–O) coefficients used to estimate value added. The insights gained from these surveys were largely the result of work for the compilation of the quinquennial Tabel Input–Output Indo-nesia[Input–Output Table of Indonesia], particularly those of 1980, 1990 and 2000. The I–O tables offer much greater detail about the composition of the economy than the national accounts, and are used for meticulous extrapolations to derive the annual estimates of the national accounts. Hence the work for the 2000 I–O table was the ‘anchor’ for the recent revision of the national accounts.
Due to the considerable experience BPS has accumulated with the compilation of the I–O tables over the years, the results of the 2000 I–O table were published by December 2003.1BPS started work on revising the national accounts in 2003. The project was perhaps more urgent than with previous revisions as the constant price series still had 1993 as the base year; the high rate of expansion and diver-sification of the economy during 1993–97 and the subsequent inflation spike of 1997–98 were likely to have altered the structure of output and expenditure in the economy in such a way that the effective 1993 sector weights would no longer be appropriate to assess economic growth in constant prices. A further factor was the release of the latest UN System of National Accounts (SNA) of 1993, and the subsequent involvement of BPS in workshops aimed at furthering the exchange of information and discussion about national accounting practices in Southeast Asia. The workshops, sponsored by the United Nations Statistics Division, Asian Development Bank, UN Economic and Social Commission for Asia and the Pacific (ESCAP) and Association of Southeast Asian Nations (ASEAN) Secre-tariat, assisted BPS in the introduction of aspects of the 1993 SNA (Saleh and Suprianto 2001). Also relevant were recommendations flowing from the USAID-funded Statistical Assistance to the Government of Indonesia (STAT) project to enhance the statistical techniques used at BPS, including the compilation of national accounts data (Jammal 2003).
DISCREPANCIES IN OUTPUT
Up to 1993, only expenditure on government consumption, gross domestic fixed capital formation, and imports and exports of goods and services were estimated on the expenditure side of GDP, and private consumption expenditure was sim-ply a residual. Since 1993, private consumption has been estimated separately, leaving change in inventories as the residual. The estimation of private con-sumption is based on the results of the National Socio-Economic Survey (Suse-nas). However, BPS augments the Susenas data in various ways to account for the significant under-reporting of consumption in the survey. For these reasons, it can be argued that Indonesia’s national accounts are still anchored in the out-put estimates.
Table 2 shows that three major upward revisions of sectoral value added explain 98% of the revision: manufacturing industry (+Rp 70.7 trillion), banking (+Rp 26.5 trillion) and wholesale and retail trade (+Rp 25.6 trillion).
TABLE 2 Estimates of Value Added by Industrial Origin Before and After the Revision
(Rp trillion, market prices)
Input– National Accounts Output Before After
Differ-Table Revision Revision ence
Agriculture 216.7 217.9 216.8 –1.1
Farm food crops 110.1 112.7 111.3 –1.3
Non-food crops 31.7 33.7 31.7 –2.0
Livestock products 24.2 27.0 25.6 –1.4
Forestry 16.0 14.9 17.2 +2.3
Fisheries 29.7 29.5 30.9 +1.4
Agricultural services 4.9 – – –
Mining 167.7 175.3 167.7 –7.6
Oil & gas 117.2 129.2 117.2 –12.1
Mining (excluding oil & gas) 38.2 34.5 39.0 +4.5
Quarrying 12.3 11.5 11.5 0.0
Manufacturing industry 385.6 314.9 385.6 +70.7
Oil & gas manufacturing 54.3 54.3 54.3 0.0
Other manufacturing 331.3 260.6 331.3 +70.7
Utilities 8.4 16.5 8.4 –8.1
Electricity & gas 7.0 14.3 7.0 –7.3
Water 1.4 2.3 1.4 –0.9
Construction 76.6 76.6 76.6 0.0
Trade 225.7 199.1 224.5 +25.3
Wholesale & retail 186.2 159.4 185.0 +25.6
Hotels 9.0 6.8 9.0 +2.2
Restaurants 30.5 33.0 30.5 –2.5
Transport & communications 65.0 62.3 65.0 +2.7
Transport 46.8 47.9 46.8 –1.2
Communications 18.3 14.4 18.3 +3.9
Finance, business services 115.5 80.5 115.5 +35.0
Banks 55.1 28.6 55.1 +26.5
Non-bank finance & financial services 9.3 7.8 9.3 +1.5
Real estate services 31.9 26.9 31.9 +4.9
Business services 19.3 17.2 19.3 +2.1
Other services 105.3 121.9 129.8 +7.9
Government (incl. defence, education, health) 69.5 69.5 69.5 0.0
Private services 35.8 52.4 60.3 +7.9
GDP(market prices) 1,366.5 1,264.9 1,389.8 +124.9
Sources: BPS (2003), Tabel Input–Output Indonesia 2000[Input–Output Table for Indonesia 2000], vol. III, December: table 1; BPS (2004b): table 1; BPS, Indikator Ekonomi, September 2004: table 9.1.
Indonesia’s New National Accounts 247
Manufacturing Industry
For medium and large-scale enterprises, the key source for the estimation of out-put in manufacturing remains the annual Statistik Industri[Industrial Statistics]. A major challenge in the estimation of industrial output has long been the small-scale sector. Due to the large number of firms in this sector, BPS has hitherto approximated this output on the basis of a census of small-scale and household enterprises held every 10 years. Before the revision, industrial output by such firms was effectively an extrapolation of the 1993 I–O table, which was itself based on an extrapolation of the results of the 1986 industrial census.
The 1996 census indicated that there had been significant changes in the struc-ture of small-scale manufacturing industry since 1986 (Rice and Abdullah 2001). But the impact of the 1997–98 crisis and its aftermath may have enhanced the impression that the 1996 census would not provide an adequate basis for captur-ing the development of the small-scale sector. In 1998 BPS started an annual sample survey, the Integrated Establishment Survey (Survei Usaha Terintegrasi, SUSI), to capture the output and activity of small-scale and household enter-prises in all sectors except agriculture (BPS 2001a, 2001b). SUSI was instrumen-tal in improving the output estimates for various sectors. In small-scale manufacturing it indicated that output was 17% higher than previously esti-mated.
A few other factors contributed to the revision of gross value added in manu-facturing, particularly the application of new I–O ratios across the different sec-tors. Because Statistik Industri does not list all possible inputs, BPS has to conduct a Special Input–Output Survey (Survei Khusus Input–Output) to approximate the ratios. The survey for the 2000 I–O table found that during and after the rapid depreciation of the rupiah in 1997–98, large and medium-scale firms had reduced their reliance on imports and increased the local content of their pro-duce by using cheaper, locally sourced inputs, resulting in somewhat lower I–O ratios. Lastly, the adoption in 2000 of a new classification of economic activity, the Indonesian Standard Industrial Classification (Klasifikasi Baku Lapangan Usaha Indonesia), caused some recalibration of output sectors.
Trade
BPS uses the commodity flow method to estimate gross output in wholesale and retail trade as the difference between the selling and purchasing value of produce in agriculture, mining, manufacturing and imports. Consequently, the upward revision of manufacturing output is the main explanation for the upward revision of value added in trade. Here as well, BPS’s Special Survey on Trade and Services (Survei Khusus Sektor Perdagangan dan Jasa, SKSPJ) for the 2000 I–O table yielded somewhat lower I–O coefficients that were applied to the output esti-mates.
Banking
BPS receives the basic data for the estimation of quarterly value added in bank-ing directly from Bank Indonesia (BI) (Jammal 2001a: 26). Before the revision, these data referred to BI and the commercial banks only. The estimate of value added was basically the total of employee compensation, depreciation and, in
2BPS (2004b: 70) suggests that output in banking is defined as the total receipts from bank
services to customers, including various charges such as for account administration and money transfers, and the imputed difference between interest received on outstanding loans and interest paid on deposits. While this may in principle yield the same estimate of output, it is apparently not how BI calculated it.
3For an explanation of why the change yields a higher estimate of value added, see Lynch
(1998).
the case of the commercial banks, indirect taxes and operating surplus also.2BPS added an estimate for value added in small-scale (secondary) banks, which was effectively an estimate from the 1993 I–O table extrapolated using the growth rate of estimated value added of the commercial banks.
According to the explanation provided to the author by BPS in February 2005, BI has improved the reporting process and, since 2000, has been able to provide data that include the secondary banks. If so, the large Rp 26.5 trillion increase in value added in 2000 suggests that the small-scale banking sector is of very signif-icant proportions, which is implausible. It seems likely that BI and/or BPS have implemented changes that relate to the partial implementation of the 1993 SNA. This may have involved the replacement of the somewhat awkward financial services adjustment in the 1968 SNA with Financial Intermediation Services Indi-rectly Measured (FISIM), an indirect measure of the value of financial inter-mediation services which are provided but for which financial institutions do not charge explicitly.3Estimating FISIM on the basis of the financial statements of BI and the commercial banks, Frécaut (2002: 54–9) found a level of value added for 1998–99 that was about Rp 49 trillion on an annual basis—about double the total value added in banking of Rp 25.8 trillion in 1998 and Rp 24.4 trillion in 1999 according to Indonesia’s national accounts before the revision.
The downward revision of value added in oil and gas production is caused by the fact that the old estimates took no account of differences in the quality of oil produced. The valuation of oil output at differentiated prices, rather than one price for one quality of oil, led to the downward revision.
Other changes were relatively marginal, and generally were caused (a) by improvements in coverage, often of production by small and household enter-prises through SUSI, but also due to revisions using better or new data, such as the revision of private TV broadcasting and new data for non-formal vocational education and (b) by revisions of the relevant I–O ratios through SKSPJ.
DISCREPANCIES IN EXPENDITURE
Because Indonesia’s national accounts do not estimate GDP from the income side, changes in output due to the 2000 revision can only be further analysed on the expenditure side. Table 3 shows that there was no major revision of the main ele-ments of expenditure on GDP except for exports, the latter caused by a revision of exports of services on the basis of balance of payments data provided by BI. This suggests that BPS is relatively confident about its consumption and invest-ment estimates.
Indonesia’s New National Accounts 249
TABLE 3 Estimates of Expenditure on GDP Before and After the Revision (Rp trillion, market prices)
Input– National Accounts Output Before After
Differ-Table Revision Revision ence
Household consumption expenditure 856.8 850.8 856.8 +6.0
Government consumption expenditure 90.8 90.8 90.8 0.0
Gross domestic fixed capital formation 272.6 275.9 275.9 0.0
Stock change 18.8 – 33.3 +33.3
Exports of goods & services 569.5 543.0 569.5 +26.5
Less imports of goods & services 442.0 423.3 423.3 0.0 Total expenditure on GDP 1,366.5 1,337.2 1,402.9 +65.8
Discrepancy – –72.2 –13.1 +59.1
GDP(market prices) 1,366.5 1,264.9 1,389.8 +124.9
Lessnet indirect taxes –66.6 –37.8 –37.8 0.0
GDP(factor costs) 1,433.1 1,302.7 1,427.6 +124.9
Lessdepreciation 111.5 63.2 69.5 +6.2
Net domestic product(factor costs) 1,321.6 1,239.5 1,358.1 +118.6
Net factor income from abroad –92.2a –92.2 –92.2 0.0
National income 1,229.4 1,147.3 1,265.9 +118.6
aNot noted in the I–O table but assumed to be the same as in the national accounts.
Sources: BPS (2003), Tabel Input–Output Indonesia 2000 [Input–Output Table for Indonesia 2000], vol. III, December: table 1; BPS (2004b): table 3; BPS, Indikator Ekonomi, September 2004: table 9.3.
A novelty introduced with the national accounts revision is the estimation of changes in inventories (De Leeuw 2001). The basic data used for this purpose are obtained from several sources, including Statistik Industriand the book value data from individual companies in different sectors, although small-scale companies are excluded.
THE REVISION’S IMPACT ON GROWTH
Although chain linking was recommended in the 1993 SNA, has been widely adopted by other countries and was recently proposed to BPS (Jammal 2001b), the statistics agency has decided for the time being against the introduction of annual chain linking for the purpose of deflation. The chain linking procedure uses the sector weights of the previous year to calculate growth of GDP in con-stant prices. One of the reasons to persist with a base year is that it is very diffi-cult in practice to obtain price data for the previous year at a detailed sectoral level, thus putting additional strain on the workload of BPS staff. In addition, calculations based on approximations of annual prices for 1994–99 have shown
that the overall growth rates calculated on the basis of the 1993 constant price series differ only marginally from the chain-linked series (Saleh and Mangiri 2001: 9–15).
In the past three revisions, the new base year (1973, 1983 and 1993 respectively) was chosen by the minister responsible for economic planning (Saleh and Man-giri 2001: 2). Each of those years was the starting point for a new five-year devel-opment plan. This time, 2000 was nominated as the new base year, rather than 2003, as signifying the start of economic recovery from the 1997–98 crisis. The perceived need for an identifiable base year may have been another reason to postpone the introduction of chain linking.
Effectively, the change in base year implies that a new, 2000-based set of price-based weights is now used to aggregate output estimates. Sectors that have grown faster than average since 1993, such as mining and manufacturing, now carry a higher weight, while sectors with lower than average growth rates, such as finance and transport, carry a lower weight.
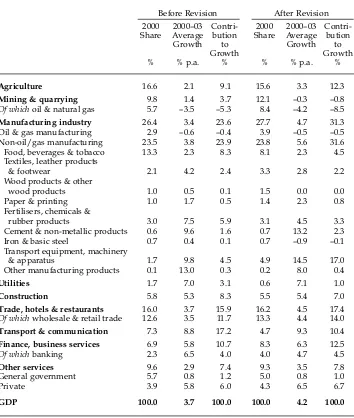
Table 1 shows that the new implicit GDP deflator suggests a higher annual average rate of inflation over 2000–03 (10.0%) than the old implicit deflator (8.2%). The average annual growth of nominal GDP is 2.4 percentage points higher after the revision, which yields a higher average annual rate of growth of real GDP (4.2% rather than 3.7%). While the overall growth rate is still relatively low after the revision, the sectoral decomposition in table 4 shows that 32% of the 2000–03 growth is now explained by non-oil and gas manufacturing, compared with only 24% before the revision. In other words, the revision and the change of base year underline the prominent role of manufacturing growth, particularly in the transport equipment, machinery and apparatus subsector, in Indonesia’s ongoing recovery from the 1997–98 crisis.
CONCLUSION
Users of time series data from Indonesia’s national accounts may feel some con-fusion when confronted with the discrepancies in the series caused by the revi-sion of the estimates since 2000. As this brief overview indicates, the changes are just the latest of a regular sequence of revisions. They are the result of significant improvements in the coverage and collection of basic data and in the processing of data based on the results of special surveys, yielding, for example, new I–O ratios.
As was the case with previous revisions, the latest revision has resulted in an upward revision in the size of the economy as gauged by GDP. The new national accounts data are more likely to reflect the current structure and level of activity in Indonesia’s economy than the pre-revision estimates.
It is likely that further revisions will be introduced in the near future, as the dedicated professionals at the two national accounts sections at BPS find new ways to capture, for example, activities in sectors that were previously only par-tially covered (BPS 2004a: 9). It should be noted that the two sections are respon-sible not just for the compilation of the annual national accounts and the quinquennial I–O tables, but also for generating the quarterly national accounts. In addition, the national accountants at BPS have been at the forefront of the development of innovative derivative work, including the Social Accounting
TABLE 4 Sectoral Decomposition of Economic Growth Before and After the Revisiona
Before Revision After Revision 2000 2000–03 Contri- 2000 2000–03 Contri-Share Average bution Share Average bution
Growth to Growth to
Growth Growth
% % p.a. % % % p.a. %
Agriculture 16.6 2.1 9.1 15.6 3.3 12.3
Mining & quarrying 9.8 1.4 3.7 12.1 –0.3 –0.8
Of whichoil & natural gas 5.7 –3.5 –5.3 8.4 –4.2 –8.5
Manufacturing industry 26.4 3.4 23.6 27.7 4.7 31.3
Oil & gas manufacturing 2.9 –0.6 –0.4 3.9 –0.5 –0.5
Non-oil/gas manufacturing 23.5 3.8 23.9 23.8 5.6 31.6
Food, beverages & tobacco 13.3 2.3 8.3 8.1 2.3 4.5
Textiles, leather products
& footwear 2.1 4.2 2.4 3.3 2.8 2.2
Wood products & other
wood products 1.0 0.5 0.1 1.5 0.0 0.0
Paper & printing 1.0 1.7 0.5 1.4 2.3 0.8
Fertilisers, chemicals &
rubber products 3.0 7.5 5.9 3.1 4.5 3.3
Cement & non-metallic products 0.6 9.6 1.6 0.7 13.2 2.3
Iron & basic steel 0.7 0.4 0.1 0.7 –0.9 –0.1
Transport equipment, machinery
& apparatus 1.7 9.8 4.5 4.9 14.5 17.0
Other manufacturing products 0.1 13.0 0.3 0.2 8.0 0.4
Utilities 1.7 7.0 3.1 0.6 7.1 1.0
Construction 5.8 5.3 8.3 5.5 5.4 7.0
Trade, hotels & restaurants 16.0 3.7 15.9 16.2 4.5 17.4
Of whichwholesale & retail trade 12.6 3.5 11.7 13.3 4.4 14.0
Transport & communication 7.3 8.8 17.2 4.7 9.3 10.4
Finance, business services 6.9 5.8 10.7 8.3 6.3 12.5
Of whichbanking 2.3 6.5 4.0 4.0 4.7 4.5
Other services 9.6 2.9 7.4 9.3 3.5 7.8
General government 5.7 0.8 1.2 5.0 0.8 1.0
Private 3.9 5.8 6.0 4.3 6.5 6.7
GDP 100.0 3.7 100.0 100.0 4.2 100.0
aCalculated from series before the revision in 1993 prices, and after the revision in 2000 prices.
Contribution to growth calculated as: (sector share in 2000 × average sector growth during
2000–03) ×100/total GDP growth.
Sources: Calculated from BPS (2004b): table 2; BPS, Indikator Ekonomi, September 2004: table 9.2.
Indonesia’s New National Accounts 251
Matrices, Flow of Fund Accounts and Natural Resource Accounts, as well as supervising the development of regional accounts at the provincial statistical offices. All will facilitate a more profound understanding of economic and social change in Indonesia than would otherwise be possible. Few of BPS’s
parts in other developing countries have engaged in such innovations. These accomplishments are even more remarkable when it is realised that they have been achieved in the face of significant resource limitations. However, to avoid any confusion, BPS may wish to consider publishing explanations of the discrep-ancies in its national accounts series with each revision, and possibly retrospec-tive revisions of the national accounts data.
REFERENCES
BPS (Badan Pusat Statistik) (2001a), Survei Usaha Terintegrasi 2000: Profil Usaha Kecil dan Menengah Tidak Berbadan Hukum, Indonesia Tahun 2000 [Integrated Establishment Sur-vey 2000: Profile of Unincorporated Small and Medium Enterprises, Indonesia 2000], Badan Pusat Statistik, Jakarta.
BPS (Badan Pusat Statistik) (2001b), Survei Usaha Terintegrasi 2000: Profil Usaha Jasa-jasa Tidak Berbadan Hukum, Indonesia Tahun 2000 [Integrated Establishment Survey 2000: Profile of Unincorporated Enterprises in the Services Sectors, Indonesia 2000], Badan Pusat Statistik, Jakarta.
BPS (Badan Pusat Statistik) (2004a), Country Paper: Official Statistics and Its Development in Indonesia, Paper presented at the First Session of the Subcommittee on Statistics, ESCAP, Bangkok, 18–20 February 2004, <www.unescap.org/stat/sos1/sos1_indo-nesia.pdf>.
BPS (Statistics Indonesia) (2004b), Pendapatan Nasional Indonesia 1999–2003 [National Income of Indonesia 1999–2003], Badan Pusat Statistik, Jakarta.
De Leeuw, Frank (2001), ‘Measuring Changes in Inventories in Indonesia’, Statistical Assis-tance to the Government of Indonesia Project, Statistical Paper No. 11, Jakarta, September. Frécaut, Olivier (2002), Banking System Losses in Indonesia, Looking Out for Fifty Billion
U.S. Dollars: Can SNA Help?, Paper presented at the 27th General Conference of the International Association for Research in Income and Wealth, Stockholm, 18–24 August 2002, <www.h.scb.se/scb/Projekt/iariw/program/4Boliver.pdf>.
Jammal, Yahya (2001a), ‘Quarterly National Accounts in Indonesia: Current Sources and Methods (Draft)’, Statistical Assistance to the Government of Indonesia Project, Statistical Paper No. 3, Jakarta, February.
Jammal, Yahya (2001b), ‘Chain Linking National Accounts’, Statistical Assistance to the Gov-ernment of Indonesia Project, Statistical Paper No. 7, Jakarta, June.
Jammal, Yahya (2003), ‘Recent Technical Papers on BPS Data’, Bulletin of Indonesian Eco-nomic Studies39 (2): 215–20.
Lynch, Robin (1998), ‘What Is FISIM?’, SNA News and Notes 8, <unstats.un.org/unsd/ nationalaccount/sna/sna8-en.htm>.
Rice, Robert, and Irfan Abdullah (2001), ‘A Comparison of the Development of Small and Medium–Large Indonesian Manufacturing Enterprises from 1986 to 1996 by Sector’, PEG Report No. 23, Partnership for Economic Growth, Jakarta, <www.pegasus.or.id/ Reports/23)%20SML%20Manufacturing.pdf>.
Saleh, Kusmadi, and Komet Mangiri (2001), Compilation of National Account of Indo-nesia, Paper presented at the ADB/ESCAP Concluding Workshop on RETA 5874: Rebasing and Linking of National Accounts Series, Bangkok, 13–16 February 2001, <www.unescap.org/stat/meet/rebase2/rlnas-indonesia.pdf>.
Saleh, Kusmadi, and Supriyanto (2001), Implementation Plans of the 1993 SNA in Indo-nesia, Paper presented at the ADB Regional Workshop on National Accounting, Manila, 7–11 May 2001.
Van der Eng, Pierre (1999), ‘Some Obscurities in Indonesia’s New National Accounts’, Bul-letin of Indonesian Economic Studies35 (2): 91–106.