Full Terms & Conditions of access and use can be found at
http://www.tandfonline.com/action/journalInformation?journalCode=cbie20
Download by: [Universitas Maritim Raja Ali Haji] Date: 17 January 2016, At: 23:17
Bulletin of Indonesian Economic Studies
ISSN: 0007-4918 (Print) 1472-7234 (Online) Journal homepage: http://www.tandfonline.com/loi/cbie20
Diet Transition and Supermarket Shopping
Behaviour: Is There a Link?
Hery Toiba, Wendy J. Umberger & Nicholas Minot
To cite this article: Hery Toiba, Wendy J. Umberger & Nicholas Minot (2015) Diet Transition and Supermarket Shopping Behaviour: Is There a Link?, Bulletin of Indonesian Economic Studies, 51:3, 389-403, DOI: 10.1080/00074918.2015.1111997
To link to this article: http://dx.doi.org/10.1080/00074918.2015.1111997
Published online: 29 Nov 2015.
Submit your article to this journal
Article views: 50
View related articles
ISSN 0007-4918 print/ISSN 1472-7234 online/15/000389-15 © 2015 Indonesia Project ANU http://dx.doi.org/10.1080/00074918.2015.1111997
* We thank Wahida from the Indonesian Center for Agricultural Socio Economic and Pol-icy Studies (ICASEPS) and Randy Stringer from Global Food Studies, at the University of Adelaide, for their invaluable insight and support during the research-design and data-collection phases of this research. We also thank the ICASEPS research team for their as-sistance with all phases of the research project. The project was funded by the Australian Centre for International Agricultural Research (grant ADP/2005/006). All views, interpre-tations, and conclusions are those of the authors and not necessarily those of the support-ing or cooperatsupport-ing institutions.
DIET TRANSITION AND SUPERMARKET
SHOPPING BEHAVIOUR: IS THERE A LINK?
Hery Toiba* Wendy J. Umberger*
Brawijaya University University of Adelaide
Nicholas Minot*
International Food Policy Research Institute
Supermarkets are leading the transformation of food markets in Asia, yet few stud-ies have examined the impact of this so-called supermarket revolution on diet transition and the related nutritional and health implications. We use data from a sample of 1,180 urban households in Indonesia to explore the relation between the increased use of modern food-retail outlets and the emergence of unhealthy dietary patterns. The results of our ordinary least-squares and instrumental vari-ables regressions suggest a negative and signiicant relation between the share of food expenditure at modern food retailers and the healthiness of consumer food purchases, even after we control for other characteristics that may inluence food-consumption decisions.
Keywords: supermarket revolution, consumers, diet quality, Lewbel approach, diet transition JEL classiication: I12, I15, F63, F68, Q13, Q18
INTRODUCTION
Economic growth, urbanisation, and foreign direct investment have all contrib -uted to the rapid rise of domestic and international supermarket chains in devel-oping and emerging economies, including Indonesia (Faiguenbaum, Berdegue, and Reardon 2002; Reardon et al. 2003). The transformation of the food-retail sector, or the so-called supermarket revolution, is having a profound effect on the market conditions faced by both producers and consumers in many
coun-tries (Faiguenbaum, Berdegué, and Reardon 2002). Previous research on the
emergence of supermarkets in developing countries has focused on their impact on smallholder farmers, rural development, small traders, and consumer purchas-ing habits,1 but only a handful of studies have considered their impact on
food-consumption patterns and the related health implications (such as Asfaw 2008; Tessier et al. 2008; Banwell et al. 2013; Zhang, Van der Lans, and Dagevos 2012; and Kelly et al. 2014). There is, however, increasing speculation that supermarket penetration is one cause of the dramatic shift in Asian diets towards more
west-ernised diets, typiied by the increased consumption of reined carbohydrates,
fats, and oils at the expense of grains, fresh fruits, and vegetables (Popkin 1999,
2006; Mendez and Popkin 2004; D’Haese and Van Huylenbroeck 2005; Asfaw
2008).
The World Health Organization is concerned about the impact of dietary
changes on the health status of consumers in many developing Asian coun-tries, because the consumption of highly processed foods has been linked to an increased risk of non-communicable chronic diseases such as cardiovascular dis-ease and Type 2 diabetes (Asfaw 2008). The diffusion of supermarkets can have important dietary implications, both positive (such as more diverse diets, lower food prices, and increased food accessibility) and negative (such as greater ine-qualities in food accessibility and increased consumption of nutrient-poor, highly processed foods) (Hawkes 2008; Banwell et al. 2013).
Previous empirical studies, using data from Tunisia, Guatemala, and Thailand, have examined the relation between supermarket use and diet quality, but their results have been mixed (Tessier et al. 2008; Asfaw 2008; Kelly et al. 2014). Additional research is needed to understand the implications of supermarket-sec-tor growth and diet transition in Indonesia. We use data from a survey of urban households in Java to examine whether a higher share of food expenditures in modern food-retail outlets (supermarkets) is associated with greater consumption
of speciic ‘unhealthy’ food products. We apply methods similar to those of Volpe, Okrent, and Leibtag (2013) to develop household-level measures for, irst, shares of expenditure on ‘healthy’ and ‘unhealthy’ foods, and, second, shares of food
expenditure in supermarkets, which include all types of modern food retailers— hypermarkets, supermarkets, and convenience stores (mini-marts)—in Indonesia.
Indonesia, particularly Java, is an appropriate setting in which to explore the relation between diet quality and supermarket use. Indonesia has been
under-going signiicant economic growth and urbanisation. Furthermore, its food-retail
sector has been transforming since 1998, when the Indonesian government began to allow foreign direct investment in food retailing (World Bank 2007; Reardon
1. For the impact of supermarkets on smallholder farmers, see, for example, the work of Bignebat, Koç, and Lemeilleur (2009); Hernández, Reardon, and Berdegué (2007); and Michelson, Reardon, and Perez (2012). On rural development, see that of Dries, Reardon, and Swinnen (2004); Hu et al. (2004); Neven et al. (2009); Rao and Qaim (2011); Reardon, Stamoulis, and Pingali (2007); Reardon et al. (2003); and Weatherspoon and Reardon 2003). On small traders, see studies by Cadilhon et al. (2006); Faiguenbaum, Berdegué, and Reardon (2002); Gorton, Sauer, and Supatpongkul (2011); Schipmann and Qaim (2011); Suryadarma et al. (2010); and Zhang and Pan (2013). On consumer purchasing habits, see the work of Bai, Wahl, and McCluskey (2008); D’Haese and Van Huylenbroeck (2005); Neven et al. (2006); and Rodriguez et al. (2002).
and Timmer 2014). Between 1999 and 2009, the number of supermarkets increased by 67%, with around three-quarters of these owned by multinational companies (Dyck, Woolverton, and Rangkuti 2012). The growth was much more intense in Java, particularly around the greater Jakarta metropolitan area, Jabotabek, which has a population of around 28 million and includes the cities of Bogor, Depok, Bekasi, and Tangerang.
DATA AND METHODS
Data
The analysis in this article uses data from our survey of urban consumers, which includes a sample of 1,180 urban households in Surabaya, Bogor, and Surakarta, representing large, medium, and small cities, respectively (Umberger et al. 2015). These three cities also represent different stages of urbanisation and supermarket penetration, with higher modern food-retail penetration in Bogor and Surabaya than in Surakarta. In addition, it is likely that there are ethnic and cultural
dif-ferences in the populations of these cities. Within each city, we used stratiied
random sampling to select households, oversampling higher-income neighbour-hoods and areas close to supermarkets. We calculated sampling weights on the basis of the inverse of the probability of selection, and used them to calculate all results presented here.
The survey was implemented from November 2010 to February 2011 by trained and experienced enumerators, who conducted the interviews at the homes of the respondents. The questionnaire covered household composition, housing and asset ownership, shopping behaviour at different types of outlets, food-expendi-ture patterns, and perceptions of each type of food retailer. The food-expendifood-expendi-ture module collected information on the amount that households spent on 67 food
items and the most important type of retailer for each item. We identiied and con -sidered shopping behaviour at seven types of food-retail outlets: hypermarkets, supermarkets, convenience stores, small shops (warung), semi-permanent stands, traditional wet markets, and peddlers. In this study, we use the terms ‘modern
food retailers’ and ‘supermarkets’ to mean hypermarkets, supermarkets, and con -venience stores.2
Econometric Approach
To explore the possible link between diet quality and supermarket use in Indonesia, we estimate the household-level share of food expenditures spent on healthy food products as a function of the household-level share of food
expen-ditures at modern retail outlets. Similar to Volpe, Okrent and Leibtag (2013), we use the United States Department of Agriculture’s Guidelines for Healthy Eating
(USDA 2010) to categorise food items as either healthy or unhealthy. According to these guidelines, healthy items include grains, roots and tubers, fruit, vegetables,
2. Hypermarkets are very large modern stores that occupy more than 8,000 square metres, have at least 10 or more cash registers, and sell both food and other groceries. Supermarkets are medium to large modern stores that occupy between 300 and 8,000 square metres, have 3–9 cash registers, and sell both food and other groceries. Convenience stores, or mini-marts, are small modern stores with 1–2 cash registers (Suryadarma et al. 2010).
unprocessed meat, milk, and eggs. Unhealthy items include sugar, sweetened food and beverages, fats, oils, and processed foods such as snack foods, processed meat, and ready-to-eat meals. The general form of the econometric model used in this study is as follows:
HealthyShare = f (Pct_modern, Female, Age, Age2, Education, Hourjob, Label,
Income, Household_size, Children5, Domestic, Activity, FAFH, Surabaya, Bogor) (1)
Table 1 provides the deinitions, means, and standard errors of all variables. Following the approach of Asfaw (2008) and Volpe, Okrent, and Leibtag (2013),
we use as the dependent variable a continuous variable, HealthyShare, that repre-sents the share of household food expenditures on healthy food products.
Pct_modern is the explanatory variable of interest. It is a continuous variable
representing the household share of food expenditures in supermarkets. Excluded
are food expenditures made at traditional retail outlets, including small shops, semi-permanent stands, traditional wet markets, and peddlers. As discussed ear-lier, consumers who buy a larger share of their food at modern retail outlets may buy fewer healthy food products for their household.
The survey enumerators interviewed the primary person responsible for mak-ing food-purchasmak-ing decisions for each household. We include several variables
representing respondents’ socio-demographic characteristics, because these char
-acteristics may inluence household food expenditures on certain foods (Huston
and Finke 2003; Schroeter, Anders, and Carlson 2013; Umberger et al. 2015). Female is a dummy variable equal to one if the respondent was female. Age and
Age2 represent the age of the respondent and the squared age of the respondent.
The partial effect of age on the share of healthy food expenditures is expected to be positive, because previous studies have shown that individuals become more concerned about the healthfulness of their diet as they get older (Frazao and Allshouse 2003).
Education is the number of years of education completed by the respondent. Respondents with higher levels of education may be more aware of the relation between diet, nutrition and health, and thus decide to buy healthier food for their households (Turrell and Kavanagh 2006). More educated consumers may also have a lower future discount rate, making them more likely to buy healthy food as
an investment in their family’s future (Huston and Finke 2003; Schroeter, Anders,
and Carlson 2013).
Hourjob is the number of hours per week that the respondent spends at work. Respondents who work longer hours may have less time to spend on household food shopping and food-purchasing decisions (Mancino and Kinsey 2004). Label
is a factor score, based on a Likert-scale response, that represents respondents’
attitudes to a series of questions about their use of nutrition labels and their nutri-tion informanutri-tion preferences. Respondents with a larger positive factor show a preference for nutrition information and use nutrition labels more frequently. Respondents who are more concerned about nutrition are expected to spend more on healthy food (Huston and Finke 2003).
We include several household characteristics that may inluence the share of
total food expenditures on healthy food. We use Income as a proxy for per cap-ita household expenditures. Households with higher incomes may face fewer
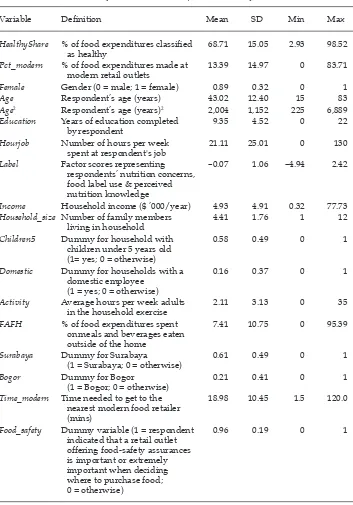
TABLE 1 Deinitions and Descriptive Statistics for Variables
Variable Deinition Mean SD Min Max
HealthyShare % of food expenditures classiied as healthy
68.71 15.05 2.93 98.52
Pct_modern % of food expenditures made at modern retail outlets
13.39 14.97 0 83.71
Female Gender (0 = male; 1 = female) 0.89 0.32 0 1
Age Respondent’s age (years) 43.02 12.40 15 83
Age2 Respondent’s age (years)2 2,004 1,152 225 6,889
Education Years of education completed by respondent
9.35 4.52 0 22
Hourjob Number of hours per week spent at respondent's job
21.11 25.01 0 130
Label Factor scores representing respondents’ nutrition concerns, food label use & perceived nutrition knowledge
–0.07 1.06 –4.94 2.42
Income Household income ($ ’000/year) 4.93 4.91 0.32 77.73
Household_size Number of family members living in household
4.41 1.76 1 12
Children5 Dummy for household with children under 5 years old (1= yes; 0 = otherwise)
0.58 0.49 0 1
Domestic Dummy for households with a domestic employee
(1 = yes; 0 = otherwise)
0.16 0.37 0 1
Activity Average hours per week adults in the household exercise
2.11 3.13 0 35
FAFH % of food expenditures spent on meals and beverages eaten outside of the home
7.41 10.75 0 95.39
Surabaya Dummy for Surabaya (1 = Surabaya; 0 = otherwise)
0.61 0.49 0 1
Bogor Dummy for Bogor (1 = Bogor; 0 = otherwise)
0.21 0.41 0 1
Time_modern Time needed to get to the nearest modern food retailer (mins)
18.98 10.45 1.5 120.0
Food_safety Dummy variable (1 = respondent indicated that a retail outlet offering food-safety assurances is important or extremely important when deciding where to purchase food; 0 = otherwise)
0.96 0.19 0 1
Note: SD = standard deviation
economic barriers to buying healthy food, particularly if healthy food is more expensive than unhealthy food (Smith, Bogin, and Bishai 2005). We include
Household_size because households with more family members to support may
have less disposable income (Schroeter, Anders and Carlson 2013). Children5 is a
dummy variable equal to one if there are children under ive years of age in the
household. Households with young children may make different food-purchasing
decisions, owing to the speciic dietary needs of young children (Umberger et al.
2015). Domestic is a dummy variable equal to one if the household has a domestic employee who helps with household duties, including shopping for food.
Activity is a continuous variable representing the average number of hours per week that adults in the household spend exercising. Households with adults who exercise more may place more value on foods that are healthy, and there-fore may have a higher share of food expenditures on healthy food (Huston and Finke 2003; Komlos, Smith, and Bogin 2004; Mancino and Kinsey 2004). FAFH is an additional measure of the impact of the market environment on
food-consumption behaviour. It is the household’s share of total food expenditures
on food-away-from-home (FAFH), including meals and beverages prepared and eaten outside the home. Previous research has found that individuals who con-sume more FAFH tend to have poorer diets as a result of other factors in the food-market environment (Bezerra and Sichieri 2009; Drichoutis, Nayga, and Lazaridis 2012).
Surabaya and Bogor are dummy variables representing city-level effects. Compared with Surakarta, Surabaya and Bogor are more metropolitan and have more mature modern food-retail sectors. There may also be unobservable city-level factors (such as social norms, cultural traditions, and climatic conditions) that have an effect on food-expenditure shares (Umberger et al. 2015).
Estimation and Instrumental Variables
We irst estimate equation (1) using ordinary least squares (OLS), controlling for the set of observable factors that may inluence food-purchasing decisions. Under the OLS approach, however, the coeficient on the modern-share variable (Pct_ modern) may not accurately measure the effect of shopping at modern retailers on healthfulness of food-consumption patterns, for three reasons. First, there may be reverse causation: a household that prefers to eat unhealthy food may decide to shop at supermarkets, potentially resulting in negative bias of the Pct_modern
coeficient in equation (1). Second, an unobserved variable may be inluencing
both the modern share and the unhealthy share of food spending. For example, if watching television exposes viewers to advertisements for supermarkets as
well as advertisements for unhealthy foods, the OLS coeficient estimate of the
Pct_modern variable will be negatively biased. Third, the estimates of food expen-ditures may be subject to measurement error (Gibson and Kim 2007) and therefore
the OLS estimation of the impact on food-consumption patterns of using modern
retailers will also be biased. In all three cases, the explanatory variable is
corre-lated with the error term, thus violating one of the assumptions behind OLS and giving biased and inconsistent estimates of the coeficient.
We can address these problems by using an instrumental variable (IV) tech-nique, in which we replace the potentially endogenous explanatory variable, Pct_ modern, with an estimated value of the variable. The estimated value is based on a supplementary regression of the potentially endogenous explanatory variable as a function of one or more IVs (or instruments). Under the IV approach, the main equation is as follows:
yi=α0+α1Mi+βiXi+εi (2)
where yi is the share of food expenditures of household i spent on healthy food; Mi
is the estimated share of food expenditures of household i purchased at modern food-retail outlets; Xi is a vector of the independent variables; α0, α1,and βiare
parameters to estimate; and εiis the error term. We estimate Mi as follows:
Mi=βiXi+γZi+υi (3)
where Zi is a vector of instrumental variables, γis an estimated parameter, and υi
is the error term.
One dificulty in implementing IV estimations is inding valid instruments.
Instruments must meet the relevance condition, meaning that they must be strongly correlated with the potentially endogenous explanatory variable (Pct_ modern). They must also meet the exclusion restriction, meaning they cannot be correlated with any omitted variable that may help to explain the dependent vari-able (that is, they must not be correlated with the error terms) (Stock and Watson 2012).
A standard IV used in studying the impact of supermarket use is the distance
from the household to the nearest retail outlet (Volpe, Okrent, and Leibtag 2013).
In Indonesia, however, distance is not a good measure of access to shopping out-lets and food markets, owing to the absence of good public transportation and
related trafic congestion in urban areas. As suggested by Narayan, Rao, and
Sudhir (2012), the cost of buying a product from a particular retail outlet includes the cost of travelling to the store. This suggests that travel time to a particular type of outlet will be negatively related to the likelihood of using that outlet. In this study, we use as an IV a variable representing the time it usually takes the respondent to get to the nearest modern retail outlet, Time_modern, even though using this instrument may raise other concerns. Some consumers, for example, may use different transportation modes to access retail outlets. To address this
issue, we apply different identiication strategies to check the robustness of the
instruments.
We include, as an additional IV, the dummy variable Food_safety, which equals one if the respondent indicated that food-safety assurances are an important or extremely important attribute when deciding where to purchase food. We con-sider this to be a valid IV because previous studies suggest that consumer concerns about food safety have increased the use of modern retail outlets in developing countries (Gorton, Sauer, and Supatpongkul 2011; Minten and Reardon 2008).
Inappropriate IVs could potentially give estimations inferior to OLS results. To mitigate this risk, we also use Lewbel’s (2012) two-stage, heteroskedasticity-based estimator, which involves irst creating ‘higher moment’ internal instruments that
are the product of a set of selected demeaned regressors and the residuals obtained
from the irst-stage regression. According to Lewbel, these instruments should, irst, satisfy the exclusion restriction if they are uncorrelated with the other regres -sors and, second, meet the relevance condition if hetroskedasticty exists in the
irst stage. Lewbel cautions that ‘higher moments can lead to noisier, less reliable estimates than exclusion based on standard exclusion restrictions’ (78). They may
be more appropriate, however, if the usual instruments are weak.
We follow methods used by Emran and Shilpi (2012); Schroeter, Anders, and Carlson (2013); Volpe, Okrent, and Leibtag (2013); and Umberger et al. (2015). We
estimate equation (4) as follows:
Mi=π′Zi+ξi (4)
where Zi is a vector of internal instruments that, according to Lewbel, can be either
a subset of or identical to Xi (Zi=Xi). In this analysis, we consider three exogenous
variables (Education, Income, and Label) for Zi. We estimate equation (4) by
regress-ing (Mi) on this subset of exogenous variables, obtaining the residual ξi. We then
use this residual to generate the higher-moment instruments
Zi−Zi
(
)
ξiˆwhere Ziis the mean of Zi and ˆ
ξiis the residual from equation (4). We use Z!ito denote the higher-moment instruments. We then use two-stage least squares and re-estimate equation (3), substituting Z!ifor Zi in equation (3), in the irst stage,
and then re-estimating equation (2). Finally, to test the robustness of the estimates,
we conduct a fourth estimation, using two-stage OLS: we estimate equation (3)
by using both the original IVs (Time_modern and Food_safety) and the higher-moment instruments (Z!i) in the irst stage. We use the Breusch-Pagan test to test for heteroskedasticity:3
Cov Zi,ξi 2
(
)
≠0(
)
RESULTS
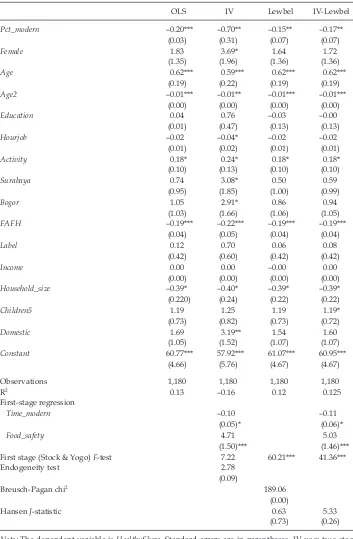
Table 2 reports the results of the estimations of the healthy expenditure share models. As discussed earlier, the Pct_modern variable may be endogenous, and
the OLS results provided in the irst column of table 2 may be biased. We there
-fore provide in the other columns the coeficients estimated using the three IV
methods. These results give an insight into potential biases that may result from endogeneity.
The results are similar across all four models, particularly for our OLS, Lewbel, and IV-Lewbel estimations. The coeficient for the main explanatory variable of
interest, Pct_modern, is consistently statistically signiicant and negative, which suggests that an increase in the share of food expenditures in modern retail outlets is associated with a decrease in the share of food expenditures on healthy food. There are some notable differences between the results of the standard IV
estima-tion and the others. The estimated coeficient for Pct_modern from the standard
IV regression is much larger than the OLS, Lewbel, and IV-Lewbel coeficients.
Additionally, four variables (Hourjob, Domestic, Surabaya, and Bogor) are signii
-cant only in the standard IV estimation. Our results are consistent with those of
other studies (such as Gao and Smyth 2015 and Sabia 2007) in that the Lewbel-
and OLS-estimated coeficients are similar and both much higher than those esti -mated using the standard IV approach.
Before discussing additional signiicant covariates, we consider the validity
of the results of the alternative IV approaches using several test statistics. The
3. We use the ivreg2 command developed by Baum, Schaffer, and Stillman (2010).
OLS IV Lewbel IV-Lewbel
First stage (Stock & Yogo) F-test 7.22 60.21*** 41.36***
Endogeneity test 2.78
Note: The dependent variable is HealthyShare. Standard errors are in parentheses. IV uses two-stage least squares with Time_modern and Food_safety as external instruments. Lewbel uses the heteroskedas-ticity-based estimator, which takes
(
Zi−Zi)
ξias instruments, where Zi includes the variables Education, Income, and Label. IV-Lewbel uses both the external instruments and the Lewbel approach.* p < 0.10; ** p < 0.05; *** p < 0.01.
endogeneity test result (2.78) is signiicant, suggesting that the Pct_modern vari-able is endogenous. The two instruments, Time_Modern and Food_Safety, are both
statistically signiicant in explaining Pct_modern. As we expected, their signs are based on previous literature and suggest that they satisfy the relevance condition.
However, the irst-stage Stock and Yogo (2005) F-test from the standard IV estima-tion (table 2) indicates that these variables are relatively weak instruments. In this case, the endogeneity test is unreliable.
To support our use of the Lewbel and IV-Lewbel models, we consider the results of two additional tests. First, the Breusch-Pagan chi-square statistic (189.06) is
sig-niicant (table 2) and we can reject the null hypothesis of homoskedasticity of the
error term (ξi). Second, the Hansen J statistics, used to test for overidentiication of
all instruments for the Lewbel and the IV-Lewbel models, are not signiicant, which conirms that the sets of instruments included in these models are valid. These
diagnostic test results support the use of the Lewbel and IV-Lewbel approaches as an alternative to the standard IV method.4 Thus, after controlling for various respondent and household characteristics, we ind that a one-percentage-point
increase in the share of food purchased at a modern outlets (Pct_modern) results in a decrease of 0.15 to 0.17 percentage points in the share of healthy food purchases.
This inding supports the notion that increased use of supermarkets for food shop -ping may lead to less healthy food-purchasing behaviour among households.
In both models, the coeficient on Age is positive and signiicant, while the coef
-icient on Age2 is negative and signiicant. This implies that the share of expendi
-tures on healthy food rises and then falls with the age of the person responsible
for shopping for food for the household. More speciically, according to the coef
-icients for the Lewbel and IV-Lewbel models, the healthy share reaches its maxi -mum at the age of approximately 57.5 Contrary to expectations, we found that
older people (above 57) spend less on healthy food for their household, other factors being equal.
The coeficients for Activity are positive and signiicant, which is consistent
with previous studies and suggests that households with active adults are also more likely to buy healthier food. As expected, FAFH was negative and highly
signiicant (at 1%) in both models, implying that households spending more on
food-away-from-home tend to buy less healthy food.
The coeficient on Income was not signiicant in explaining healthy expenditure shares in either estimation. This result is surprising, but there are two possible explanations. First, many low-income households receive food subsidies from the government, especially for rice, allowing them to spend more of their income on other healthy foods (such as unprocessed meats, fresh milk, and eggs).6 Second,
4. The coeficients estimated using the standard IV approach (table 2) are not reliable, ow-ing to weak instruments, and we provide them only for comparison. As such, we focus the remaining discussion on the results from the estimations of the Lewbel and IV-Lewbel models.
5. Taking the derivative of the regression equation with respect to age, the maximum oc-curs when b + 2(a)(Age) = 0, where b is the linear coeficient and a is the quadratic
coefi-cient. Rearranging terms, we get Age = –b/2a = –0.622/0.011 = 56.5.
6. Since 1998, the Indonesian government has provided food subsidies for low-income households as part of its Raskin rice-subsidy program (Sumarto and Bazzi 2011)
high-income households are better able to afford processed foods and conveni-ence foods, which are considered to be less healthy.
A related variable, Household_size, was negative and statistically signiicant in both models, perhaps because, for a given income, larger households have less disposable income to spend on more expensive, healthier foods, so household
members may have poorer diets. The coeficient on the Children5 variable in the
IV-Lewbel model (table 2) is positive and statistically signiicant, suggesting some
evidence of a positive relation between having young children in the household and having healthier household food-expenditure shares.
There was no statistically signiicant difference in the share of healthy food
expenditures in Surabaya, Bogor, and Surakarta. Any differences across cities are due to differences in other explanatory variables.
CONCLUSIONS AND IMPLICATIONS
There is increasing speculation that consumers’ dietary practices and health out -comes can be affected by the strategic decisions of modern retailers. It is unclear from the literature, however, whether there is a connection between the use of
modern retail outlets and unhealthy dietary patterns. Tessier et al.’s (2008) study,
for example, which used data from Tunisia, determined that the diet quality of frequent users of supermarkets was slightly higher than that of less frequent
supermarket users. On the other hand, studies using data from Guatemala (Asfaw
2008), Thailand (Kelly et al. 2014), and Kenya (Rischke et al. 2015) found higher supermarket use to be associated with an increased consumption of highly pro-cessed foods, which are generally considered to be unhealthy.
We have attempted here to build on previous empirical studies and shed light on the relation between supermarket shopping behaviour and diet transition in Indonesia, a topic that has not previously been researched. Using cross-sectional data from a survey of Indonesian urban households, we found a negative and
sig-niicant relation between the share of food expenditures in modern food retailers
and the healthfulness of consumer food expenditures. Given, however, that the
coeficients on the supermarket variables (Pct_modern) estimated using the OLS, Lewbel, and IV-Lewbel models are relatively small, so, too, is the actual
magni-tude or impact of changing food expenditures on diet quality. Speciically, after
controlling for other variables, we found that an increase of one percentage point in the share of food expenditures in supermarkets is associated with a relatively
small decrease (of 0.15 to 0.17 percentage points) in the household’s share of food
expenditures on healthy food.
Nevertheless, our results support those of Asfaw (2008), Kelly et al. (2014), and Rischke et al. (2015). As in Thailand, Guatemala, and Kenya, supermarket penetration in urban areas of Indonesia is relatively high, and supermarkets are generally accessible to both low-income and high-income households. As Kelly et al. (2014) explain, modern food retailers, including hypermarkets, supermarkets, and convenience stores, may be able to compete with traditional retailers by pro-viding less expensive processed foods, which tend to be higher in fat, salt, and sugar content, and fewer fresh foods, particularly fruits and vegetables.
We also found that diet quality is negatively associated with greater food-expenditure shares on meals and beverages bought outside the home.
Policymakers in Indonesia who are concerned about diet transition may want to consider aspects of the food environment other than just supermarket pen-etration. The development of one-stop shopping centres (such as shopping malls where supermarkets are typically co-located with food courts), for example, may exacerbate the negative effects of supermarket penetration on diet quality.
This study has several limitations. We used cross-sectional data, so we were unable to capture dynamic patterns of consumption; panel data would have yielded more robust estimates of causal relations. We did not measure the
quan-tity of food consumed by individuals in households, which made it dificult to
isolate the effect of food expenditure shares on the intake of calories and nutrients. And we focused on urban households in Java, where modern food-retail pen-etration is much greater than in rural areas and in other provinces. The relation between modern food-retail penetration and health outcomes, in Indonesia and elsewhere, requires more research.
REFERENCES
Asfaw, Abay. 2008. ‘Does Supermarket Purchase Affect the Dietary Practices of House-holds? Some Empirical Evidence from Guatemala’. Development Policy Review 26 (2): 227–43.
Bai, Junfei, Thomas I. Wahl, and Jill J. McCluskey. 2008. ‘Consumer Choice of Retail Food Store Formats in Qingdao, China’. Journal of International Food and Agribusiness Market -ing 20 (2): 89–109.
Banwell, Cathy, Jane Dixon, Sam-ang Seubsman, Suttinan Pangsap, Matthew Kelly, and Adrian Sleigh. 2013 ‘Evolving Food Retail Environments in Thailand and Implications for the Health and Nutrition Transition’. Public Health Nutrition 16 (4): 608–15.
Baum, Christopher F., Mark E. Schaffer, and Steven Stillman. 2010. ‘IVREG2: Stata module for extended instrumental variables/2SLS and GMM estimation’. http://ideas.repec. org/c/boc/bocode/s425401.html.
Bezerra, Ilana Nogueira, and Rosely Sichieri. 2009. ‘Eating Out of Home and Obesity: A Brazilian Nationwide Survey’. Public Health Nutrition 12 (11): 2037–43.
Bignebat, Céline, Ahmet Ali Koç, and Sylvaine Lemeilleur. 2009. ‘Small Producers, Super-markets, and the Role of Intermediaries in Turkey’s Fresh Fruit and Vegetable Market’.
Agricultural Economics 40 (s1): 807–16.
Cadilhon, Jean-Joseph, Paule Moustier, Nigel D. Poole, Phan Thi Giac Tam, and Andrew P. Fearne. 2006. ‘Traditional vs. Modern Food Systems? Insights from Vegetable Supply Chains to Ho Chi Minh City (Vietnam)’. Development Policy Review 24 (1): 31–49. D’Haese, Marijke, and Guido Van Huylenbroeck. 2005. ‘The Rise of Supermarkets and
Changing Expenditure Patterns of Poor Rural Households Case Study in the Transkei Area, South Africa’. Food Policy 30 (1): 97–113.
Drichoutis, Andreas C., Rodolfo M. Nayga, Jr, and Panagiotis Lazaridis. 2012. ‘Food Away from Home Expenditures and Obesity among Older Europeans: Are There Gender Dif-ferences?’. Empirical Economics 42 (3): 1051–78.
Dries, Liesbeth, Thomas Reardon, and Johan F. M. Swinnen. 2004. ‘The Rapid Rise of Supermarkets in Central and Eastern Europe: Implications for the Agrifood Sector and Rural Development’. Development Policy Review 22 (5): 525–56.
Dyck, John, Andrea E. Woolverton, and Fahwani Yuliati Rangkuti. 2012. Indonesia’s Mod -ern Retail Food Sector: Interaction with Changing Food Consumption and Trade Patt-erns. Economic Information Bulletin 97. Washington, DC: United States Department of Agriculture.
Emran, M. Shahe, and Forhad Shilpi. 2012. ‘The Extent of the Market and Stages of Agricul-tural Specialization’. Canadian Journal of Economics 45 (3): 1125–53.
Faiguenbaum, Sergio, Julio A. Berdegué, and Thomas Reardon. 2002. ‘The Rapid Rise of Supermarkets in Chile: Effects on Dairy, Vegetable, and Beef Chains’. Development Pol-icy Review 20 (4): 459–71.
Frazao, Elizabeth, and Jane Allshouse. 2003. ‘Strategies for Intervention: Commentary and Debate’. Journal of Nutrition 133 (3): 844S–847S.
Gao, Wenshu, and Russell Smyth. 2015. ‘Education Expansion and Returns to Schooling in Urban China, 2001–2010: Evidence from Three Waves of the China Urban Labor Sur-vey’. Journal of the Asia Paciic Economy 20 (2): 178–201.
Gibson, John, and Bonggeun Kim. 2007. ‘Measurement Error in Recall Surveys and the Relationship between Household Size and Food Demand’. American Journal of Agricul -tural Economics 89 (2): 473–89.
Gorton, Matthew, Johannes Sauer, and Pajaree Supatpongkul. 2011. ‘Wet Markets, Super-markets and the “Big Middle” for Food Retailing in Developing Countries: Evidence from Thailand’. World Development 39 (9): 1624–37.
Hawkes, Corinna. 2008. ‘Dietary Implications of Supermarket Development: A Global Per-spective’. Development Policy Review 26 (6): 657–92.
Hernández, Ricardo, Thomas Reardon, and Julio Berdegué. 2007. ‘Supermarkets, Whole-salers, and Tomato Growers in Guatemala’. Agricultural Economics 36 (3): 281–90. Hu, Dinghuan, Thomas Reardon, Scott Rozelle, Peter Timmer, and Honglin Wang. 2004.
‘The Emergence of Supermarkets with Chinese Characteristics: Challenges and Opportunities for China’s Agricultural Development’. Development Policy Review 22 (5): 557–86.
Huston, Sandra J., and Michael S. Finke. 2003. ‘Diet Choice and the Role of Time Prefer-ence’. Journal of Consumer Affairs 37 (1): 143–60.
Kelly, Matthew, Sam-ang Seubsman, Cathy Banwell, Jane Dixon, and Adrian Sleigh. 2014, ‘Thailand’s Food Retail Transition: Supermarket and Fresh Market Effects on Diet Quality and Health’. British Food Journal 116 (7): 1180–93.
Komlos, John, Patricia K. Smith, and Barry Bogin. 2004. ‘Obesity and the Rate of Time Pref-erence: Is There a Connection?’. Journal of Biosocial Science 36 (2): 209–19.
Lewbel, Arthur. 2012. ‘Using Heteroskedasticity to Identify and Estimate Mismeasured and Endogenous Regressor Models’. Journal of Business & Economic Statistics 30 (1): 67–80.
Mancino, Lisa, and Jean Kinsey. 2004. ‘Diet Quality and Calories Consumed: the Impact of Being Hungrier, Busier and Eating Out’. Working paper 04-02, Food Industry Center, University of Minnesota, St Paul, MN.
Mendez, Michelle A., and Barry M. Popkin. 2004. ‘Globalization, Urbanization and Nutri-tional Change in the Developing World’. Journal of Agricultural and Development Econom -ics 1 (2): 55–80.
Michelson, Hope, Thomas Reardon, and Francisco Perez. 2012. ‘Small Farmers and Big Retail: Trade-Offs of Supplying Supermarkets in Nicaragua’. World Development 40 (2): 342–54.
Minten, Bart, and Thomas Reardon. 2008. ‘Food Prices, Quality, and Quality’s Pricing in Supermarkets versus Traditional Markets in Developing Countries’. Applied Economic
Perspectives and Policy 30 (3): 480–90.
Narayan, Vishal, Vithala R. Rao, and K. Sudhir. 2012. ‘Early Adoption of Modern Grocery Retail in an Emerging Market: Evidence from India’. Johnson School Research Paper 27-2012, Samuel Curtis Johnson Graduate School of Management, Ithaca, NY.
Neven, David, Michael Makokha Odera, Thomas Reardon, and Honglin Wang. 2009. ‘Ken-yan Supermarkets, Emerging Middle-Class Horticultural Farmers, and Employment Impacts on the Rural Poor’. World Development 37 (11): 1802–11.
Neven, David, Thomas Reardon, Jonathan Chege, and Honglin Wang. 2006. ‘Supermarkets and Consumers in Africa: The Case of Nairobi, Kenya’. Journal of International Food &
Agribusiness Marketing 18 (1–2): 103–23.
Popkin, Barry M. 1999. ‘Urbanization, Lifestyle Changes and the Nutrition Transition’. World Development 27 (11): 1905–16.
———. 2006. ‘Global Nutrition Dynamics: The World is Shifting Rapidly toward a Diet Linked with Noncommunicable Diseases’. American Journal of Clinical Nutrition 84 (2): 289–98.
Rao, Elizaphan J. O., and Matin Qaim. 2011. ‘Supermarkets, Farm Household Income, and Poverty: Insights from Kenya’. World Development 39 (5): 784–96.
Reardon, Thomas, Kostas Stamoulis, and Prabhu Pingali. 2007. ‘Rural Nonfarm Employ-ment in Developing Countries in an Era of Globalization’. Agricultural Economics 37 (s1): 173–83.
Reardon, Thomas, and C. Peter Timmer. 2014. ‘Five Inter-Linked Transformations in the Asian Agrifood Economy: Food Security Implications’. Global Food Security 3 (2): 108–17.
Reardon, Thomas, C. Peter Timmer, Christopher B. Barrett, and Julio Berdegué. 2003. ‘The Rise of Supermarkets in Africa, Asia, and Latin America’. American Journal of Agricul -tural Economics 85 (5): 1140–46.
Rischke, Ramona, Simon C. Kimenju, Stephan Klasen, and Matin Qaim. 2015. ‘Supermar-kets and Food Consumption Patterns: The Case of Small Towns in Kenya’. Food Policy 52: 9–21.
Rodriguez, Elsa, Miriam Berges, Karina Casellas, Rosángela Di Paola, Beatriz Lupín, Laura Garrido, and Natacha Gentile. 2002. ‘Consumer Behaviour and Supermarkets in Argen-tina’. Development Policy Review 20 (4): 429–39.
Sabia, Joseph J. 2007. ‘The Effect of Body Weight on Adolescent Academic Performance’. Southern Economic Journal 73 (4): 871–900.
Schipmann, Christin, and Matin Qaim. 2011. ‘Modern Food Retailers and Traditional Mar-kets in Developing Countries: Comparing Quality, Prices, and Competition Strategies in Thailand’. Applied Economic Perspectives and Policy 3 (3): 345–62.
Schroeter, Christiane, Sven Anders, and Andrea Carlson. 2013. ‘The Economics of Health and Vitamin Consumption’. Applied Economic Perspectives and Policy 35 (1): 125–49. Smith, Patricia K., Barry Bogin, and David Bishai. 2005. ‘Are Time Preference and Body
Mass Index Associated? Evidence from the National Longitudinal Survey of Youth’.
Economics & Human Biology 3 (2): 259–70.
Stock, James H., and Mark W. Watson. 2012. Introduction to Econometrics: International Edi-tion, 3rd ed. Boston, MA: Pearson Education.
Stock, James H., and Motohiro Yogo. 2005. ‘Testing for Weak Instruments in Linear IV Regression’. In Identiication and Inference for Econometric Models: Essays in Honor of Thomas Rothenberg, edited by Donald W. K. Andrews and James H. Stock, 80–108. New York: Cambridge University Press.
Sumarto, Sudarno, and Samuel Bazzi. 2011 ‘Social Protection in Indonesia: Past Experi-ences and Lessons for the Future’. Paper presented at the 2011 Annual Bank Conference on Development Economics, Paris, 30 May–1 June.
Suryadarma, Daniel, Adri Poesoro, Sri Budiyati, Meuthia Rosfadhila, and Asep Suryahadi. 2010. ‘Traditional Food Traders in Developing Countries and Competition from Super-markets: Evidence from Indonesia’. Food Policy 35 (1): 79–86.
Tessier, Sophie, Pierre Traissac, Bernard Maire, Nicolas Bricas, Sabrina Eymard-Duvernay, Jalila El Ati, and Francis Delpeuch. 2008. ‘Regular Users of Supermarkets in Greater Tunis Have a Slightly Improved Diet Quality’. Journal of Nutrition 138 (4): 768–74. Turrell, Gavin, and Anne M. Kavanagh. 2006. ‘Socio-Economic Pathways to Diet:
Model-ling the Association between Socio-Economic Position and Food Purchasing Behav-iour’. Public Health Nutrition 9 (3): 375–83.
Umberger, Wendy J., Xiaobo He, Nicholas Minot, and Hery Toiba. 2015. ‘Examining the Relationship between the Use of Supermarkets and Over-nutrition in Indonesia’. Amer
-ican Journal of Agricultural Economics 97 (2): 510–25.
USDA (United States Department of Agriculture). 2010. ‘Healthy Eating Index-2005 Development and Evaluation Technical Report Support Files’. Center for Nutrition Policy and Promotion, USDA. http://origin.www.cnpp.usda.gov/HealthyEatingIndex- 2005report.htm.
Volpe, Richard, Abigail Okrent, and Ephraim Leibtag. 2013. ‘The Effect of Supercenter-For-mat Stores on the Healthfulness of Consumers’ Grocery Purchases’. American Journal of Agricultural Economics 95 (3): 568–89.
Weatherspoon, Dave D., and Thomas Reardon. 2003. ‘The Rise of Supermarkets in Africa: Implications for Agrifood Systems and the Rural Poor’. Development Policy Review 21 (3): 333–55.
World Bank, 2007. Horticultural Producers and Supermarket Development in Indonesia. Report 38543-ID. Washington, DC: World Bank.
Zhang, Qian Forrest, and Zi Pan. 2013. ‘The Transformation of Urban Vegetable Retail in China: Wet Markets, Supermarkets and Informal Markets in Shanghai’. Journal of
Con-temporary Asia 43 (3): 497–518.
Zhang, Xiaoyong, Ivo van der Lans, and Hans Dagevos. 2012. ‘Impacts of Fast Food and the Food Retail Environment on Overweight and Obesity in China: A Multilevel Latent Class Cluster Approach’. Public Health Nutrition 15 (1): 88–96.