A comparison of Asian e-government websites
quality: using a non-parametric test
P.D.D. Dominic* and Handaru Jati
Department of Computer and Information Science, Universiti Teknologi Petronas,
31750, Tronoh, Perak, Malaysia Fax: +605-365-6180
E-mail: [email protected] E-mail: [email protected] E-mail: [email protected]
*Corresponding author
P. Sellappan
Department of Information Technology,
Malaysia University of Science and Technology (MUST), 47301, Petaling Jaya, Selangor, Malaysia
Fax: +603-78801762 E-mail: [email protected]
Goh Kim Nee
Department of Computer and Information Science, Universiti Teknologi Petronas,
31750, Tronoh, Perak, Malaysia
Fax: +605-365-6180 E-mail: [email protected]
Abstract: This research conducts tests to measure the quality of e-government websites of five Asian countries via web diagnostic tools online. We propose a methodology for determining and evaluating the best e-government website based on many criteria of website quality, consisting of linear weightage model (LWM), analytical hierarchy process (AHP), fuzzy analytical hierarchy process (FAHP), and one new hybrid model (NHM). This NHM has been implemented using combination FAHP and LWM to generate the weights for the criteria which are better and more fairly preferred. The results of this study confirmed that most Asian websites are neglecting in performance and quality criteria. By applying the hybrid model approach it has resulted in significant acceleration of implementation, raised the overall effectiveness and enabled more efficient procedure. To compare the ranking methods, a combination of Friedman’s test and Dunn’s multiple comparison procedure is adopted. When applied to the methods presented here, these tests indicate that AHP, FAHP, and Hybrid method methods perform better than LWM.
Reference to this paper should be made as follows: Dominic, P.D.D., Jati, H., Sellappan, P. and Nee, G.K. (2011) ‘A comparison of Asian e-government websites quality: using a non-parametric test’, Int. J. Business Information Systems, Vol. 7, No. 2, pp.220–246.
Biographical notes: P.D.D. Dominic obtained his MSc in Operations Research in 1985, MBA from Regional Engineering College, Tiruchirappalli, India during 1991, Postgraduate Diploma in Operations Research in 2000 and completed his PhD in 2004 in the area of Job Shop Scheduling at Alagappa University, Karaikudi, India. Presently, he is working as a Senior Lecturer in the Department of Computer and Information Science, Universiti Teknologi Petronas, Malaysia. His fields of interest are operations management, KM, and decisions support systems. He has published more than 50 technical papers in international, national journals and conferences.
Handaru Jati obtained his MSc in Information Technology in 2005 and MBA degree in 2001 from Gadjah Mada University Indonesia. Currently, he is pursuing his Doctoral degree from Universiti Teknologi PETRONAS in Computer and Information Science Department, Malaysia. Since 1999, he has held the post of Lecturer in the Department of Electronics and Informatics Engineering Yogyakarta State University Indonesia (formally Yogyakarta Vocational Education Institute). His fields of interest are software quality, image processing and e-learning evaluation. He has published technical papers in international and national conferences.
P. Sellappan obtained his MSc in Computer Science from University of London, UK in 1973, and completed his PhD in 1978 in the area of Interdisciplinary Information Science at University of Pittsburgh, USA. Presently, he is working as an Associate Professor, in the Department of Information Technology, Malaysia University of Science and Technology (MUST), Malaysia. His fields of interest are decisions support systems, web applications and data warehousing. He has published more than 50 technical papers in international, national journals and conferences. He has published more than 15 books in the area of software engineering and programming.
Goh Kim Nee obtained her MSc Information in Human-Computer Interaction from University of Michigan, USA in 2007. She is currently working as a Lecturer in the Department of Computer and Information Sciences, Universiti Teknologi Petronas, Malaysia. Her research interest includes user-centred design, interface and interaction design and usability. She has published technical papers in international, national journals and conferences.
1 Introduction
‘if information can pass a test of quality, it is most likely to prove trustworthy’. And because of this belief, higher quality website should have higher credibility. Thus, the challenge is how to create a method that will guide the internet users to evaluate a website without needing a lot of time. Using the tool consumes a lot of time and cautious consideration is necessary. It takes more than one hour to examine a website thoroughly and apply criteria of the quality. Time taken to do so may be available to information professionals, but for public users they may not be willing to spend such an amount of time.
The evaluation of a website in terms of quality lacks a single point definition. It is the combination of various factors: aesthetic, logic, technology and many other factors. There are many scope of quality, and each measure pertains to a particular website in varying degrees. Here are some of them: the first factor is time; a credible site should be updated frequently. The information about the latest update should be included on the homepage. If the information in the website is not updated frequently, visitors could simply assume that the site manager has no time to update the site.
The second factor is structural; all website components should hold together and all website internal and external links should work well. Clear navigation, legible content, clean page layouts, simple instructions and easy search functions are factors that contribute to user friendliness of a website. Broken links on the webpage is also another factor that can downgrade the website quality. In the year of 2003, discovered that about one link out of every 200 disappeared each week from the internet (McCowen et al., 2005).
The third factor is content or search engine friendliness; the number of links or link popularity is one of the off page factors that search engines are looking for to determine the value of the webpage. The advantages of a large number of links to a site are evident: first, the more sites that link to the website, the more traffic the website can expect to receive, and second, major search engines will improve website ranking when there are more sites that link to the website (Miranda and Bañegil, 2004). To generate income through merchandising sales, institutions need to have quality web traffic first. Search engines are important to websites success. At the very least, website should be search engine friendly. Higher search engine rankings translate into greater traffic to the site and therefore, increase its degree of accessibility (Miranda et al., 2006). Search engines should be able to easily extract the contents available for public and display the relevant pages to fulfil the search queries. Major search engines have their own way of defining relevant search results for particular key-phrase. Approximately 85% of all traffics to websites and 70% of all online business transactions originate from a search engine or directory (like Google, Yahoo or MSN). To improve a website’s ranking, there are some steps to do, firstly by analysing who the target audiences are and then analysing what the keywords or phrases the target audiences are using while searching the web. Secondly, by updating the content regularly and this action can improve the website ranking quite remarkably. This is because most of search engine algorithms give top ranking while indexing the websites if the content is updated frequently. Search engines require a website to have at least two links pointing to the site before they will be placed into their index. The idea is that when a website has increased its link popularity, then it has also proved that the website has high quality content. Number of links to a website improves access growth and helps to generate traffic (Page et al., 1998).
majority of popular pages, and that blocking this content buys a 25%–30% reduction in objects downloaded and bytes, with a 33% decrease in page latency, from 2003 to 2008 the average web page grew from 93.7 K to over 312 K (Josep et al., 2007). Popular sites averaged 52 objects per page, 8.1 of which were ads, served from 5.7 servers (Krishnamurthy and Wills, 2006), and object overhead now dominates the latency of most web pages (Yuan et al., 2005). Table 1 shows that in terms of ranking, link popularity of the e-government website’s are different with the result from Waseda University World for e-government ranking in 2008. Based on Waseda University World e-government, the ranking are Singapore, Korean, Japan, Hong Kong, and Malaysia, while based on link popularity using Google search engine the sequence are: Hong Kong, Singapore, Malaysia, Japan, and the last ranking is Korea. Similar result occurred by using Yahoo search engine with first ranking being Malaysia, followed by Singapore, Japan, Hong Kong, and Korea in the last ranking.
Table1 Ranking of the e-government websites based on search engine
E-government Waseda University Google Yahoo
http://www.gov.sg 1 2 (2,650 links) 2 (105,914 links)
http://www.korea.go.kr 2 5 (454 links) 5 (49,005 links)
http://www.kantei.go.jp 3 4 (1,810 links) 3 (91,038 links)
http://www.gov.hk 4 1 (8,180 links) 4 (59,876 links)
http://www.gov.my 5 3 (2,190 links) 1 (132,804 links)
The fifth factor is stickiness, which is the ability to ensure that the internet user sticks on the website page for a longer period of time. A sticky website is a place that people will come to visit again. By having repeated visitors, this strategy can increase exposure to products or services hence it can create more sales. The positive impacts to having a sticky website are: repeat traffic impact on increased sales, one-to-one relationships are created, and develop performance through feedback.
The sixth factor is design, a site does not only need to make sense visually, it should also appear the same in all web browsers (such as Internet Explorer, Opera, Firefox) and across all computer platforms (PC and Mac). Good design should make a site easy to use and an effective site design should communicate a brand and help to accomplish the site’s objectives and goals. Sites with known brands were also highly rated for both credibility and visual design (Robins et al., 2009). However, creating website with a good design is subjective and it is only through repetitive efforts and testing that we can figure out what works best for the intended audience.
eight-seconds period is a normal time for loading a webpage and it is not tolerable by the user. This fact is supported by many research results mentioning that the mean of tolerable download time by the user is 8.57 seconds with standard deviation of 5.9 seconds (Bouch et al., 2000). A study by Akamai and Jupiter proposed to replace the eight seconds rule, claiming those today, four seconds is the highest acceptable length of time an average online shopper will wait for a web page to load before potentially abandoning a retail site (Akamai, 2006). This also shows that providing information related with waiting time is very important for the users. To download a page which takes longer time, it is better to provide information about how many percent of the webpage has already been downloaded and how much more time is needed to complete the task. Another important aspect is information fit-to-task, which means that information presented on a website is accurate and appropriate for the task at hand (Loiacono et al., 2007). Good architecture is fundamental to deal with a website’s requirements, to ensure structural scalability, flexibility, security, and to fulfil current performance demands and in the future. A completed site should comply with acknowledged programming standards. As the web keeps on growing as a competitive tool for business applications, there is a need to comprehend the relationship between business performance and web usability. Most of the previous researches have discussed the website development from a set of usability factors (Green and Pearson, 2006; Seffah et al., 2006). Online accessibility test can be used to examine whether the web portals have accessibility errors on their respective web pages. The World Wide Web Consortium (W3C) rules are divided into three priority levels which will influence the level of website accessibility. If a website can not satisfy the second priority then users will have some problems to access the website, however if the website already satisfied the third criteria then users will have a little difficulty to access the web (Loiacono and McCoy, 2004).
2 Literature review
2.1 Website evaluation studies
The website evaluation can be approached from users, website designer/administrator or both together (Sayar and Wolfe, 2007). From the user’s perspective, most of the studies on website evaluation focus on the factors for a successful website. These researches concentrate on the development of a website evaluation tool. These studies search for design and content elements of a successful website using exploratory study. The main areas for the website quality evaluation are: accessibility, speed, navigability and site content (Miranda et al., 2009). The model, called web assessment index by manually is accessing evaluating 84 European municipal websites.
Award evaluators use five specific criteria. The criteria includes structure, content, navigation, visual design, functionality, and interactivity. Although content was found to be more important than graphics, evaluation criteria cannot be considered independently (Sinha et al., 2001). The result confirmed that their 154 criteria had high accuracy rate of 84% by applying them to 157 web pages and Webby Award 2000 data set (Ivory and Hearst, 2002).
2.2 Website evaluation tool
The website designer or administrator evaluates a website design during the website is life cycle, so that the website becomes a successful one. In general, the website evaluation can be done through the preliminary review, conformance evaluation, or ongoing monitoring. Preliminary review identifies general problems of a website, and conformance evaluation discovers major violations of guidelines during the website design stage. Conformance evaluation generally checks which level of web content accessibility guidelines (WCAG, W3C, and WCAG 2.0) a website satisfies (Cooper, 2008). Ongoing monitoring tries to make sure that a website maintains a certain level of WCAG. There are two methods of website evaluation: non-automated evaluation and automated evaluation.
2.2.1 Non-automated evaluation
Non-automated website evaluation can be done in two ways. The first approach is user testing. This approach allows website user groups to evaluate a website and collects opinions about evaluation criteria and analyses them. The second approach is heuristic testing. This method asks experts to identify the critical aspects and to offer managerial implications in order for designers to get an effective website (Flavian et al., 2009). Heuristic testing costs is high since it asks experts to conduct an analysis and develop reports after the analysis. Thus, it is difficult for many organisations to employ website professionals for the regular evaluation. Both users testing and heuristic are equally efficient and effective in addressing different categories of usability problems. In fact, there are significant differences found between these two methods, suggesting that the two methods are complimentary and should not be competing (Tan et al., 2009). For the majority of websites neither heuristic testing nor user testing is not practical due to two reasons, first, quick development in the web technology makes the use of sophisticated tools and complex interaction of a website possible, second the life cycle of a website is very short. The website improvement has to be done faster than other software maintenance due to market pressure and the lack of barriers in website development. These characteristics of the website evaluation methods make an automated website evaluation tool compulsory, not a choice.
2.2.2 Automated evaluation
website evaluation tools also allow the website designer or administrator to evaluate many websites and to detect potential problems as well as actual problems.
A comprehensive review on the automation of user interface usability evaluation is discussed in literature including automated website evaluation tools (Ivory and Hearst, 2001). In this survey, the usability evaluation method is summarised and a new methodology is proposed (Ivory and Hearst, 2001). This new methodology, called WebTango, was introduced in previous research (Ivory, 2000). WebTango is a quality checker tool, which purpose to help non-professional designers to develop their sites using quantitative measures of the navigational, informational, and graphical aspects of a website. The usability evaluation approach is used in the field of the software engineering to the website usability evaluation (Brajnik, 2000). The comparison of automated evaluation tools using consistency, adequate feedback, situational navigation, efficient navigation, and flexibility as the characteristic of usability is explored is this research (Brajnik, 2000). Other research proposes an automated website evaluation approach using machine learning to cope with ranking problems (Li and Yamada, 2009). This approach develops a method to obtain evaluation function using ranking support vector machine and automatically ranks websites with the learned classifier. A website evaluation model is developed by applying the software quality model (Brajnik, 2002). The testing method is proposed to determine whether an automated website evaluation tool uses the proper rules and applies it to the LIFT, an automated website evaluation tool (Brajnik, 2001, 2002). The validity of a set of website evaluation criteria is verified using the Webby Award 2000 data set (Ivory and Hearst, 2002). Development and evaluation of a model called web-based quality function deployment (WQFD) is a model to link total quality management (TQM), information technology (IT) and web engineering (WE) (Sudhahar et al., 2009).
2.3 Automated website evaluation tool
evaluates a website’s usability by collecting data through a simulation of a hypothetical user’s experience. The fourth type of tools monitors consistency, availability, and performance of a web server by stressing the server (e.g., TOPAZ). The fifth type of tool is for security testing (e.g., iTrustPage). This is an anti-phishing tool that does not rely completely on automation to detect phishing. Instead, iTrustPage relies on user input and external repositories of information to prevent users from filling out phishing web forms (Troy et al., 2008). And the last tools for classifying a website after learning the classification criteria from other websites [e.g., WebTango (Sinha et al., 2001]. Web criteria, an automated website evaluation tool evaluates the usability of a website by gathering primary statistical data through the simulation model. The primary evaluation criteria include accessibility, load time, and content. NetRaker, another evaluation tool, develops an online survey which permits users to respond to the survey while using the website. NetRaker does not verify HTML code or evaluate statistical data. Instead, it gathers and evaluates user’s survey data of a website.
2.4 Quality standard
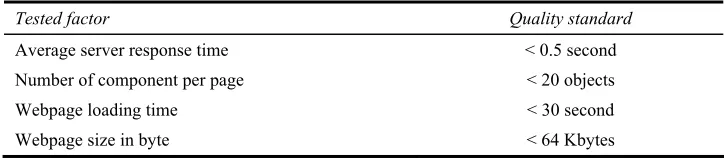
Every webpage design has their own characteristics and these characteristics have drawbacks and benefits. There is a mechanism for measuring the effects of the webpage component towards the performance and quality of website. This mechanism will measure size, component, and time needed by the client for downloading a website. The main factors that will influence download time are page size (bytes), number and types of component, number of server from the accessed web. Research conducted by IBM can be used as a standard for performance measurement of quality (Amerson et al., 2001). Table 2 describes all of the criteria and quality standards that should be fulfilled by a website to be a good quality website. Tested factors consist of: average server response time, number of component per page, webpage loading time, and webpage size in bytes. A standard international download time for this performance can be used as a reference to categorise the tested webpage. Automation in testing for website quality is a new chance and a new method, and should be applied for testing the quality of website. For leveraging the effectiveness of continuous quality improvement, developer community has been aggressive in attaining TQM strategies by implementing ISO 9001:2000 standard (Sakthivel et al., 2007).
Table 2 Standard of the website performance
Tested factor Quality standard
Average server response time < 0.5 second
Number of component per page < 20 objects
Webpage loading time < 30 second
Webpage size in byte < 64 Kbytes
Source: Amerson et al. (2001)
3 Methodology
This research is consisted of several stages, which started with problem identification followed by research procedure and data collection, and ended with analysis of data. Basically our research purpose has threefold aims:
1 to propose a new methodology for evaluating the quality of e-government website 2 to determine the best e-government website based on the proposed criteria in the new
methodology
3 to determine the best ranking method used to evaluate website quality.
This research examined national e-government portals of a selected number of countries in Asia: Singapore, Korean, Japan, Hong Kong and Malaysia. This data of quality website from e-government website were taken more than 30 trials on various occasions on the different period of time. This data has been taken from 3/29/2009 until 5/20/2009. Using website diagnostic tools and four methods proposed (LWM, AHP, FAHP, and hybrid method) the aims of this research were explored. Data was analysed by using non-parametric statistical test. In order to analyse whether there are differences among the ranking composition methods, we ran the Friedman test. When the null-hypothesis is rejected by the Friedman test, we can proceed with a post-hoc test to detect which differences among the methods are significant using Bonferroni’s/Dunn’s multiple comparison technique. All of the data for this research were taken using PC with specification: Processor Pentium Mobile 740, using local area network internet connection with average bandwidth 60 kbps.
3.1 Web diagnostic tools
We used a number of widely available web diagnostic tools online, thus we used widely available website performance tool and webpage speed analyser online service (http://www.websiteoptimization.com). List of performance measured and reported by this service include total size, number of objects (HTML, images, CSS, scripts), and download times on a 56.6 kbps connection. Another available webpage online tool that we used which is for testing quality was: http://validator.w3.org/checklink which was utilised in order to monitor broken links in the HTML code of the portals. The W3C’s HTML validator website (http://validator.w3.org) was used to validate the HTML code of the portals. This standard was set up by the World Wide Web Consortium (W3C), the main international standards organisation for the World Wide Web. Link popularity website (www.linkpopularity.com) was used to determine the amount and quality of links that are made to a single websites, based on the page-rank analysis.
3.2 Sample data
In order to get the data for this research, we examined e-government websites from five Asian countries. The e-government portals were not randomly selected, but a careful process was undertaken. Rather than selecting any generic e-government web portal this research attempted to evaluate the web portals of governments that are considered to be leaders in the area of e-government based on the result of Waseda University World e-government ranking. By doing this approach it was felt that measures of ‘best practices’ could emerge. As explained before, we examined the national e-government portals of a selected number of countries and their web addresses were provided along with the names, which are: Singapore (http://www.gov.sg), Korean (http://www.korea.go.kr/eng), Japan (http://www.kantei.go.jp/foreign/index-e.html), Hong Kong (http://www.gov.hk), and Malaysia (http://www.gov.my).
3.3 Linear weightage model
This model is very easy to use and mostly depended upon the decision-makers’ judgement as they have to assign weights to the criteria that involve in decision-making process. In most cases there are some criteria considered as more important than others, such as load time, response time, traffic, page rank and broken link. Decision-makers should assign weight to each individual criterion in order to determine the relative importance of each one. These weights play a vital role in decision-making process and extremely affect the final decision. First of all decision-makers have to identify all criteria involved in a certain process before performing any other steps. After identifying all the criteria related to website selection decision, decision-makers have to determine threshold for each criterion. In fact, a threshold can be divided into two types, i.e., maximum and minimum. To establish a threshold to criterion, decision-makers should classify all criteria into two groups. The first group known as ‘larger is better’ while the other known as ‘smaller is better’. The load time, response time, markup validation number error, and broken link can be categorised as ‘smaller is better’ and the threshold for this type of criteria must be maximum. On the other hand, others criteria can be considered as ‘larger is better’ such as traffic, page rank, frequency of update and design optimisation where thresholds must be minimum.
3.4 Analytic hierarchy process
intermediate level contains the criteria under which each website is evaluated. In the constantly fluctuating of the website, evaluation cannot survive without a comprehensive quality factor identification and evaluation. The AHP methodology can be demonstrated by applying it to the quality factors on the e-government website problem. Construction of the hierarchy is the first step in the problem-solving process. In this case (Figure 1), the goal of an AHP and also FAHP decision is to select the best e-government during the first level. Response time, load time, size, number of items, markup validation and broken links are the evaluation criteria during the second level of the hierarchy.
3.5 Fuzzy analytical hierarchy process
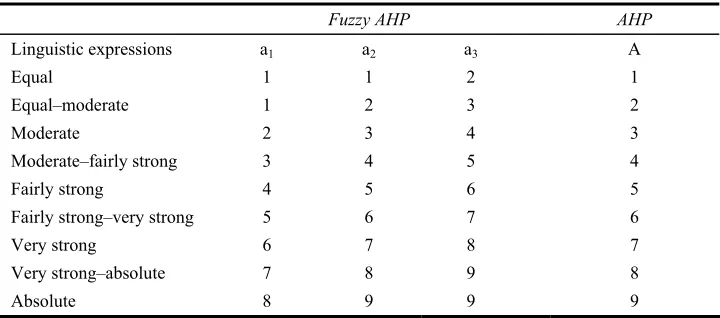
In 1965, Lotfi A. Zadeh introduced a new approach. Fuzzy sets and fuzzy logic are powerful mathematical tools for modelling: nature and humanity, uncertain systems in industry, and facilitators for common-sense reasoning in decision-making in the absence of complete and precise information. The role is significant when applied to complex phenomena that are not easily described by traditional mathematical methods, especially when the goal is to find a good approximate solution (Bojadziev, 1995). The values of fuzzy logic are ranging from zero to one for showing the membership of the objects in a fuzzy set. Complete non-membership is represented by zero, and complete membership is represented by one. Values between zero and one represent intermediate degrees of membership. Weight parameter for AHP and FAHP depicts in this following Table 3.
Table 3 Each of membership functions’ parameter for AHP/FAHP
Fuzzy AHP AHP
Linguistic expressions a1 a2 a3 A
Equal 1 1 2 1
Equal–moderate 1 2 3 2
Moderate 2 3 4 3
Moderate–fairly strong 3 4 5 4
Fairly strong 4 5 6 5
Fairly strong–very strong 5 6 7 6
Very strong 6 7 8 7
Very strong–absolute 7 8 9 8
Absolute 8 9 9 9
Decimal judgements, such as 3.5, are allowed for fine tuning, and judgements greater than nine may be entered, though it is suggested that they should be avoided.
3.6 Hybrid method
3.7 Reliability and validity
After the data was collected, it was then organised and analysed. The data was analysed by using a non-parametric statistical test. In order to analyse whether there are differences among the ranking composition methods, we ran the Friedman test (Demšar, 2006). When the null-hypothesis is rejected by the Friedman test, we can proceed with a post-hoc test to detect which differences among the methods are significant. To answer this problem we used Bonferroni’s/Dunn’s multiple comparison technique (Neave and Worthington, 1989). The Bonferroni’t’ statistic is used to investigate dependent comparisons among means. This test is only good for investigating the difference between two means (i.e., cannot compare Groups LWM and AHP vs. Groups FAHP and Hybrid). The Bonferroni’t’ test is the same as a normal pairwise comparison (t test), but the critical value is different.
4 Result and discussion
First column in Table 4 shows the criteria of the quality website. The criteria involve in the website selection process using proposed model are load time (A), response time (B), page rank (C), frequency of update (D), traffic (E), design optimisation (F), size (G), number of items (H), accessibility error (I), markup validation (J), and broken link (K). The second column shows the measurement unit, and the rest of the columns represent the e-government website performance value.
Table 4 Original data
Criteria Measurement
unit Singapore Korea Japan Hong Kong Malaysia
A Seconds 30.77 0.30 68.93 41.94 77.51
B Seconds 1.94 1.17 1.73 1.03 4.84
C Number 2,870.00 430.00 2,020.00 9,690.00 2,470.00
D Number 60.00 60.00 60.00 1.00 60.00
E Number 62,000.00 39,800.00 223,200.00 499,600.00 228,200.00
F Percentage 37.50 57.00 36.50 33.00 22.00
G Number 128,305.00 511.00 285,645.00 195,384.00 366,825.00
H Number 26.00 1.00 60.00 15.00 22.00
I Number 37.00 0.00 2.00 0.00 15.00
J Number 79.00 5.00 21.00 3.00 80.00
K Number 4.00 0.00 1.00 1.00 9.00
none of e-government website had HTML 4.01 valid entry page as most of it did not have DOCTYPE declarations. Consequences of this problem will be on the portability and development of the website. In terms of broken link, four e-government websites or 80% of the samples have a broken link.
After determining the attributes and performance results, the next step in the evaluation process was to perform a comparison of each attribute. The preference criteria matrix was obtained to compare each criterion against the others. There are four models used in this research, LWM, AHP, FAHP and hybrid model (combination between LWM and FAHP).
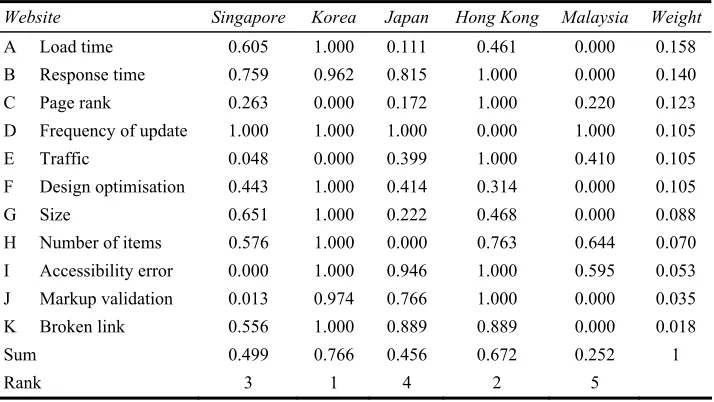
Table 5 Final result for e-government website (LWM)
Website Singapore Korea Japan Hong Kong Malaysia Weight
A Load time 0.605 1.000 0.111 0.461 0.000 0.158
4.1 Linear weightage model analysis
Table 5 presents the weights of e-government website based on LWM model. The load time, response time, markup validation number error, and broken link can be categorised as ‘smaller is better’ and the threshold for this type of criteria must be maximum. On the other hand, other criteria can be considered as ‘larger is better’ such as traffic, page rank, frequency of update and design optimisation where thresholds must be minimum. Once the attribute is considered as maximum type of thresholds, formula 1 should be used.
max
min
ws specific website value that has minimum type of threshold with respect to a particular attribute/criterion.
Specific website specific website that is considered at the time.
max maximum value of particular attribute/criteria among all websites min minimum value of the same attribute among the whole websites. The idea of using formulas 1 and 2 is extremely valuable because they provide a method that enables the comparisons among decision criteria. Usually decision criteria have different units of measure so any comparisons among those criteria are not logically acceptable. By using the data normalisation concept, which is represented in formulas 1 and 2, all the criteria will be having weights instead of a variety of measurement units and then the comparisons can simply be made. When all values of the criteria matrix are calculated, series of calculations should be achieved by multiplying weights Wi of criteria
by the whole values Xi within the matrix. The total score should also be calculated using
formula 3 for each specific website which represents the specific websites’ scores. The final decision table includes a total score for each website and the one who gains the highest score is recommended as the best website overall.
i i i
Total score=
∑
W X∑
W (3)We gave every criterion with the appropriate weight depending on the significant to the total quality of website: load time (9), response time (8), page rank (7), frequency of update (6), traffic (6), design optimisation (6), size (5), number of items (4), accessibility error (3), markup validation (2), and broken link (1). After conducting some calculations during this evaluation process, the last step in this procedure is to compute the final score of each website. Then the sum of each column is obtained and the sum represents the score of each single website.
Table 5 depicts the final scores of websites based on LWM evaluation method. The most important thing with regards the final results, the website which has the highest score is suggested as the best website for LWM model. In accordance with the results generated by the proposed model, Korea e-government website has the highest score of 0.77 in comparison with the rest of e-government websites. As a result, the proposed LWM model rank for e-government website is: Korea (score: 0.77), Hong Kong (score: 0.67), Singapore (score: 0.50), Japan (score: 0.46), and the last rank is Malaysia (score: 0.25).
4.2 AHP model analysis
Table 6 presents the weights of e-government website associated with each of the website quality criteria based on AHP model.
1 Define an unstructured problem and determine its goal.
2 Structure the hierarchy from the top (objectives from a decision-maker’s viewpoint) through intermediate level (criteria on which subsequent level depends on) to the lowest level, which typically contains a list of alternatives.
3 Employ a pairwise comparison approach. Fundamental scale for pairwise comparison was developed to solve this problem (Saaty, 1980). The pairwise comparison matrix A, in which the element aij of the matrix is the relative importance of the ith factor with respect to the jth factor, could be calculated as:
12 1n
4 There are n(n – 1) / judgements required for developing the set of matrices in step 3. Reciprocals are automatically assigned to each pairwise comparison, where n is the matrix size.
Table 6 Weight of criteria and website (AHP)
Website Singapore Korea Japan Hong Kong Malaysia Weight
A Load time 0.260 0.503 0.068 0.134 0.035 0.270
Table 7 depicts the final scores of websites based on AHP evaluation method.
Table 7 Final result evaluation (AHP)
Criteria Singapore Korea Japan Hong Kong Malaysia
A Load time 0.070 0.136 0.018 0.036 0.009
B Response time 0.016 0.056 0.029 0.090 0.006
C Page rank 0.032 0.005 0.011 0.081 0.019
D Frequency of update 0.033 0.020 0.020 0.015 0.020
E Traffic 0.004 0.002 0.014 0.039 0.017
F Design optimisation 0.011 0.027 0.007 0.005 0.003
G Size 0.009 0.024 0.003 0.005 0.001
H Number of items 0.004 0.021 0.001 0.011 0.005
I Accessibility error 0.001 0.010 0.006 0.010 0.003
J Markup validation 0.001 0.007 0.003 0.009 0.001
K Broken link 0.002 0.006 0.004 0.004 0.000
Sum 0.183 0.313 0.115 0.305 0.085
Rank 3 1 4 2 5
4.3 Fuzzy-AHP analysis
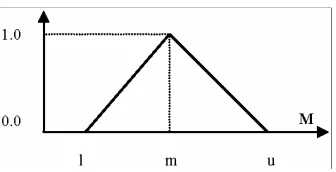
Fuzzy numbers are the special classes of fuzzy quantities. A fuzzy number is a fuzzy quantity M that represents a generalisation of a real number r. Intuitively, M(x) should be a measure of how better M(x) ‘approximates’ r. A fuzzy number M is a convex normalised fuzzy set. A fuzzy number is characterised by a given interval of real numbers, each with a grade of membership between zero and one (Deng, 1999). A triangular fuzzy number (TFN), M is shown in Figure 2.
Figure 2 A triangular fuzzy number M%
TFNs are described by three real numbers, expressed as (l, m, u). The parameters l, m, and u indicate the smallest possible value, the most promising value, and the largest possible value respectively that describes a fuzzy event. Their membership functions are described as:
(
)
0, 1,
( 1) / ( 1), 1 ,
/
( ) / ( ) ,
0,
x
x m x m
μ x M
u x u m m x u
x u
< ⎧
⎪ − − ≤ ≤ ⎪
= ⎨ − − ≤ ≤ ⎪
⎪ >
⎩
In applications, it is easy to work with TFNs because of their simple computation, and they are useful in promoting representation and information processing in a fuzzy environment. In this research, implementation of TFNs in the FAHP is adopted. We have to deal with fuzzy numbers when we want to use fuzzy sets in applications. In this section, three important operations used in this research are illustrated (Tang and Beynon, 2005). If we define, two TFNs A and B by the triplets A = (l1, m1, u1) and B = (l2, m2, u2). In this research the extent FAHP is used. Let X = {x1, x2, x3, …, xn} an object set, and G = {g1, g2, g3, …, gn} be a goal set. According to the method of Chang’s extent analysis, each object is taken and extent analysis for each goal performed respectively. Therefore, m extent analysis values for each object can be obtained, with the following signs:
1 , 2 , , m , 1, 2, , ,
gi gi gi
M M K M i= K n
where Mjgi (j = 1, 2, ..., m) all are TFNs. The steps of Chang’s extent analysis can be
given as in the following:
Step 1 The value of fuzzy synthetic extent with respect to the ith object is defined as:
1
and can be equivalently expressed as follows:
(
2 1)
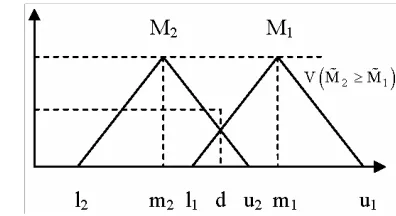
1 2 M2Step 3 The degree possibility for a convex fuzzy number to be greater than k convex fuzzy Mi (i = 1, 2, k) numbers can be defined by
Then the weight vector is given by:
( ) ( )
( )
(
)
T1 2 n
W′= d A , d A′ ′ ,K, d A′ (11)
Figure 3 The intersection between M1 and M2
Figure 3 illustrates equation (9) where d is the ordinate of the highest intersection point D between
1
M
μ and 2
M
μ to compare M1 and M2, we need both the values of V(M1≥ M2) and V(M2≥ M1).
Step 4 via normalisation, the normalised weight vectors are:
( ) ( )
( )
(
)
T1 2 n
W= d A , d A ,K, d A (12)
where W is a non-fuzzy number.
Table 8 presents the weights of e-government websites associated with each of the website quality criteria based on FAHP model.
Table 8 Weight criteria and website (FAHP)
Website quality criteria Singapore Korea Japan Hong Kong Malaysia Weight
A Load time 0.289 0.711 0.000 0.000 0.000 0.377
B Response time 0.000 0.347 0.024 0.628 0.000 0.291
C Page rank 0.092 0.000 0.000 0.908 0.000 0.216
D Frequency of update 0.819 0.181 0.000 0.000 0.000 0.114
E Traffic 0.000 0.000 0.093 0.454 0.454 0.003
F Design optimisation 0.171 0.829 0.000 0.000 0.000 0.000
G Size 0.042 0.958 0.000 0.000 0.000 0.000
H Number of items 0.000 1.000 0.000 0.000 0.000 0.000
I Accessibility error 0.000 0.500 0.000 0.500 0.000 0.000
J Markup validation 0.000 0.427 0.000 0.573 0.000 0.000
K Broken link 0.000 0.598 0.402 0.000 0000 0.000
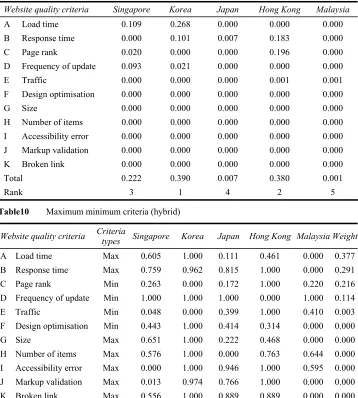
Table 9 depicts the final scores of the websites. The most important thing with is regarding the final results is that the website which has the highest score is suggested as the best website for the proposed FAHP model.
Table 9 Final result (FAHP)
Website quality criteria Singapore Korea Japan Hong Kong Malaysia
A Load time 0.109 0.268 0.000 0.000 0.000
B Response time 0.000 0.101 0.007 0.183 0.000
C Page rank 0.020 0.000 0.000 0.196 0.000
D Frequency of update 0.093 0.021 0.000 0.000 0.000
E Traffic 0.000 0.000 0.000 0.001 0.001
F Design optimisation 0.000 0.000 0.000 0.000 0.000
G Size 0.000 0.000 0.000 0.000 0.000
H Number of items 0.000 0.000 0.000 0.000 0.000
I Accessibility error 0.000 0.000 0.000 0.000 0.000
J Markup validation 0.000 0.000 0.000 0.000 0.000
K Broken link 0.000 0.000 0.000 0.000 0.000
Total 0.222 0.390 0.007 0.380 0.001
Rank 3 1 4 2 5
Table10 Maximum minimum criteria (hybrid)
Website quality criteria Criteria
types Singapore Korea Japan Hong Kong Malaysia Weight
A Load time Max 0.605 1.000 0.111 0.461 0.000 0.377
B Response time Max 0.759 0.962 0.815 1.000 0.000 0.291
C Page rank Min 0.263 0.000 0.172 1.000 0.220 0.216
D Frequency of update Min 1.000 1.000 1.000 0.000 1.000 0.114
E Traffic Min 0.048 0.000 0.399 1.000 0.410 0.003
F Design optimisation Min 0.443 1.000 0.414 0.314 0.000 0.000
G Size Max 0.651 1.000 0.222 0.468 0.000 0.000
H Number of items Max 0.576 1.000 0.000 0.763 0.644 0.000
I Accessibility error Max 0.000 1.000 0.946 1.000 0.595 0.000
J Markup validation Max 0.013 0.974 0.766 1.000 0.000 0.000
K Broken link Max 0.556 1.000 0.889 0.889 0.000 0.000
4.4 Hybrid model analysis
Table 10 depicts the scores of websites using hybrid model evaluation. The most important thing is regarding the final results, the website which has the highest score is suggested as the best website for the proposed hybrid model.
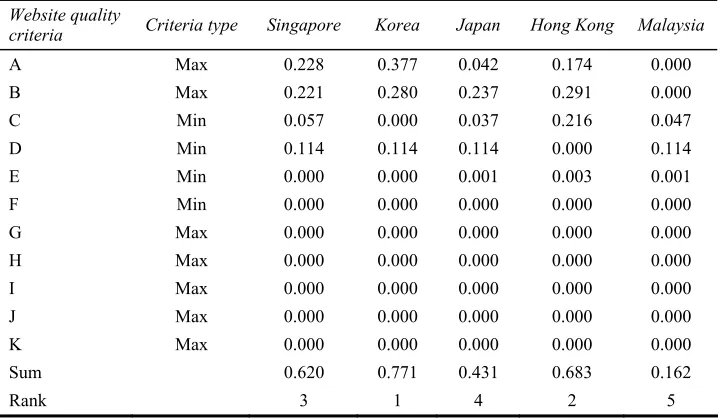
Table11 Final result for e-government website (hybrid model)
Website quality
criteria Criteria type Singapore Korea Japan Hong Kong Malaysia
A Max 0.228 0.377 0.042 0.174 0.000
B Max 0.221 0.280 0.237 0.291 0.000
C Min 0.057 0.000 0.037 0.216 0.047
D Min 0.114 0.114 0.114 0.000 0.114
E Min 0.000 0.000 0.001 0.003 0.001
F Min 0.000 0.000 0.000 0.000 0.000
G Max 0.000 0.000 0.000 0.000 0.000
H Max 0.000 0.000 0.000 0.000 0.000
I Max 0.000 0.000 0.000 0.000 0.000
J Max 0.000 0.000 0.000 0.000 0.000
K Max 0.000 0.000 0.000 0.000 0.000
Sum 0.620 0.771 0.431 0.683 0.162
Rank 3 1 4 2 5
Table 11 depicts the final scores of the websites. The most important thing is regarding the final results, the website which has the highest score is suggested as the best website for the proposed hybrid model. In accordance with the results generated by the proposed model, Korea e-government website has the highest score of 0.771 in comparison with the rest of e-government websites. As a result, the rank for e-government website using the proposed hybrid model is: Korea (score: 0.771), Hong Kong (score: 0.683), Singapore (score: 0.620), Japan (score: 0.431), and the last rank are Malaysia (score: 0.162). 4.5 Website ranking
Table 12 depicts the final ranking of e-government websites based on four specific methods. In accordance with the results generated by the proposed model, Korea website has the highest ranking in comparison with the rest of the e-government websites.
Table12 Final result for e-government websites performance
Method Singapore Korea Japan Hong Kong Malaysia
LWM 0.499(3) 0.766(1) 0.456(4) 0.672(2) 0.252(5)
AHP 0.183(3) 0.313(1) 0.115(4) 0.305(2) 0.085(5)
FAHP 0.222(3) 0.390(1) 0.007(4) 0.380(2) 0.001(5)
Hybrid 0.620(3) 0.771(1) 0.431(4) 0.683(2) 0.162(5)
As a result, the overall ranking of the proposed model is as follows: Korea, Hong Kong, Singapore, Japan, and Malaysia. Consistency of ranking occurred for the all four evaluation models.
Table13 E-government websites ranking based on method
Now to compute the Friedman statistic,
( )
If we find the place on the Friedman table for four columns and five rows, we find that the p-value for χF2 =12.12 is 0.007. Since the p-value is below α = .05, reject the null
hypothesis. Since the computed FR statistic is greater than 7.815, the upper-tail critical value under the chi-square distribution having c – 1 = 3 degrees of freedom (Friedman table), the null hypothesis is rejected at the 0.05 level of significant. We conclude that there are significant differences (as perceived by the raters) with respect to the rating produced at the four evaluation model. Naturally, we must now determine which methods are different from one another. To answer this question we use Bonferroni/Dunn’s multiple comparison technique (Neave and Worthington, 1989). Using this method we test p = 12k(k−1) hypotheses of the form:
H(i, j)1 there is some difference in the mean average correlation coefficients between methods i and j.
The Bonferroni t statistic is used to investigate dependent comparisons among means. This test is only good for investigating the difference between two means (i.e., cannot compare groups LWM and AHP vs. groups FAHP and NHM). The Bonferroni t test is the same as a normal pairwise comparison (t test), but the critical value is different. Because we are allowed to make many comparisons, we have to control for familywise error by reducing the per comparison level. The overall level will be set to 0.05, and the individual per comparison levels will be equal to 0.05 divided by the total number of possible comparisons. We can make a total of 4C2 = 6 different pairwise comparisons between the four means. In practice, we may not do for all of these comparisons, but remember that we will always have to set the error rate according the total number of possible comparisons.
Step 1 calculate the t’ statistics
[
]
Table 14 Significance of difference between two means methods
LWM vs. So our per comparison will be:
FW
Step 3 determine significance of comparisons.
Student’s t tables do not contain a critical value for α=0.0125 so we have to look it up in the Dunn/Bonferroni t’ table. The degrees of freedom = 16, and the number of comparison = 6. This gives a t’ value: 3.008. Result for this test LWM vs. AHP: t’ = 5.780 (significant), LWM vs. FAHP: t’ = 5.202 (significant), LWM vs. hybrid: t’ = –0.578 (insignificant), AHP vs. FAHP: t’ = –0.578 (insignificant), AHP vs. hybrid: t’ = –6.358 (significant), FAHP vs. hybrid : t’ = –5.780 (significant).
5 Conclusions
of website design. This suggests that web developers who are responsible for e-government websites should follow and encourage the use of recognised guidelines when designing websites. To get results on the quality of a website, we measured sample data from e-government website in five Asian countries and calculate load time, response time, page rank, frequency of update, traffic, design optimisation, page size, number of item, accessibility error, markup validation, and broken link. We proposed some methodologies for determining and evaluating the best e-government sites based on many criteria of website quality, consisting of: LWM, AHP, FAHP, and one NHM. This NHM has been implemented using LWM and FAHP to generate the weights for the criteria which are much better and guaranteed more fairly preference of criteria.
Applying hybrid model between LWM and FAHP approach for website evaluation has resulted in significant acceleration of implementation, raised the overall effectiveness with respect to the underlying methodology and ultimately enabled more efficient and significantly equal compared with LWM method. In accordance with the results generated by the proposed model, Korea website has the highest in comparison with the rest of the e-government websites. As a result, in overall ranking for the proposed model rank for e-government website is: Korea, Hong Kong, Singapore, Japan, and Malaysia. Limitation of this research occurred in the number of sample size and time factor. This research used limited sample size of 30 data and taken during a short period of observation time. Therefore, we can conclude that LWM and NHM ranking method are significantly better than AHP and FAHP ranking method, while comparison between LWM to NHM and AHP to FAHP ranking method are insignificantly different.
Future directions for this research are added criteria for evaluating websites quality, such as availability and security aspect, also from the cultural perspective, since culture has an impact upon a website. Another approach can also be conducted for other service sectors such as e-business and academic websites. Moreover, because the ultimate determinant of quality website is the users, future directions for this research also involve the objective and subjective views of the e-government website from the user’s perspective.
Acknowledgements
The authors would like to thank the editor and the anonymous reviewers for their valuable comments on earlier version of this article.
References
Akamai (2006) ‘Akamai and Jupiter Research Identify 4 seconds as the new threshold of acceptability for retail web page response times’, Press Release, Akamai Technologies Inc., available at http://www.akamai.com/html/about/press/releases/2006/press_110606.html. Amerson, M., Fisher, G., Hsiung, L., Krueger, L. and Mills, N. (2001) Design for Performance:
Analysis of Download Times for Page Elements Suggests Ways to Optimize.
Bojadziev, G. (1995) Fuzzy Sets, Fuzzy Logic, Applications, World Scientific Pub Co. Inc.
Brajnik, G. (2000) ‘Automatic web usability evaluation: where is the limit’, The 6th Conference on Human Factors and the Web.
Brajnik, G. (2001) Automatic Web Usability Evaluation: What Needs to be Done?.
Brajnik, G. (2002) ‘Quality models based on automatic web testing’, CHI Workshop, Minneapolis ACM.
Cooper, M. (2008) W3C Web Content Accessibility Guideline (WCAG) 2.0.
Demšar, J. (2006) ‘Statistical comparisons of classifiers over multiple data sets’, The Journal of Machine Learning Research, Vol. 7, pp.1–30.
Deng, H. (1999) Multicriteria Analysis with Fuzzy Pairwise Comparison.
Durkin, M. (2007) ‘In search of the internet-banking customer: exploring the use of decision styles’, International Journal of Bank Marketing, Vol. 22, pp.484–503.
Flavian, C., Gurrea, R. and Orus, C. (2009) ‘A heuristic evaluation of websites design for achieving the web success’, International Journal of Services and Standards, Vol. 5, pp.17–41.
Green, D. and Pearson, J.M. (2006) ‘Development of a web site usability instrument based on ISO-9241-11’, The Journal of Computer Information Systems, Vol. 47, pp.66–72.
Ivory, M. and Hearst, M. (2001) ‘The state of the art in automating usability evaluation of user interfaces’, ACM Computing Surveys, Vol. 33, pp.470–516.
Ivory, M. and Hearst, M. (2002) ‘Statistical profiles of highly-rated web sites’, The SIGCHI Conference on Human Factors in Computing Systems: Changing our World, Changing Ourselves, Minneapolis, ACM, Minnesota, USA.
Ivory, M.Y. (2000) Web TANGO: Towards Automated Comparison of Information-Centric Web Site Designs, ACM New York, NY, USA.
Josep, D., Ana, P., Julio, S. and Jose, G. (2007) ‘A user-focused evaluation of web prefetching algorithms’, Computer Communications, Vol. 30, pp.2213–2224.
Krishnamurthy, B. and Wills, C. (2006) ‘Cat and mouse: content delivery tradeoffs in web access’, The 15th International Conference on World Wide Web, Edinburgh, Scotland.
Li, P. and Yamada, S. (2009) ‘Automated web site evaluation – an approach based on ranking SVM’, IEEE/WIC/ACM International Joint Conferences on Web Intelligence and Intelligent Agent Technologies, WI-IAT’09, p.3.
Loiacono, E. and McCoy, S. (2004) ‘Web site accessibility: an online sector analysis’, Information Technology & People, Vol. 17, pp.87–101.
Loiacono, E.T., Watson, R.T. and Goodhue, D.L. (2007) ‘WebQual: an instrument for consumer evaluation of web sites’, International Journal of Electronic Commerce, Vol. 11, pp.51–87. McCowen, F., Michael, N. and Bollen, J. (2005) ‘The availability and persistence of web
references in D-Lib magazine’, The 5th International Web Archiving Workshop and Digital Preservation (IWAW’05), Viena
McInerney, C. (2000) ‘Establishing and maintaining trust in online systems’, in Williams, M. (Ed.): The 21st National Online Meeting Information Today, Medford, NJ.
Miranda, F.J. and Bañegil, T.M. (2004) ‘Quantitative evaluation of commercial web sites: an empirical study of Spanish firms’, International Journal of Information Management, Vol. 24, pp.313–328.
Miranda, F.J., Cortés, R. and Barriuso, C. (2006) ‘Quantitative evaluation of e-banking web sites: an empirical study of Spanish banks’, Electronic Journal of Information Systems Evaluation, Vol. 9, pp.73–82.
Miranda, F.J., Sanguino, R. and Banegil, T.M. (2009) ‘Quantitative assessment of European municipal web sites’, Internet Research, Vol. 19, pp.425–441.
Neave, H.R. and Worthington, P.L. (1989) Distribution-Free Tests, Routledge London. Ozden, B. and Karpak, B. (2005) ‘An AHP application in vendor selection’, ISAHP, pp.1–21. Page, L., Motwani, R., Brin, S. and Winograd, T. (1998) The Anatomy of a Large-Scale
Ramsay, J., Barbesi, A. and Preece, J. (1998) ‘Psychological investigation of long retrieval times on the world wide web’, Interacting with Computers, Vol. 10, pp.77–86.
Robins, D., Holmes, J., Stansbury, M., Interactive, A.G. and Cleveland, O.H. (2009) ‘Consumer health information on the web: the relationship of visual design and perceptions of credibility’, Journal of the American Society for Information Science and Technology, Vol. 61, pp.13–29. Saaty, T. (1980) The Analytic Hierarchy Process: Planning, Priority Setting, Resources Allocation,
McGraw-Hill, London.
Sakthivel, M., Devadasan, S.R., Vinodh, S., Ramesh, A. and Shyamsundar, S. (2007) ‘ISO 9001:2000 based quality information management responsibility system’, International Journal of Business Information Systems, Vol. 2, pp.217–237.
Sayar, C. and Wolfe, S. (2007) ‘Internet banking market performance: Turkey versus the UK’, International Journal of Bank Marketing, Vol. 25, pp.122–141.
Seffah, A., Donyaee, M., Kline, R. and Padda, H. (2006) ‘Usability measurement and metrics: a consolidated model’, Software Quality Journal, Vol. 14, pp.159–178.
Sinha, R., Hearst, M. and Ivory, M. (2001) ‘Content or graphics?: An empirical analysis of criteria for award-winning websites’, Proceedings of the 7th Conference on Human Factors & the Web.
Sudhahar, C., Kumar, R.S.P., Senthil, V., Devadasan, S.R. and Murugesh, R. (2009) ‘Web-based QFD: a collaborative technique for supporting the adoption of customers’ voices’, International Journal of Business Information Systems, Vol. 4, pp.360–385.
Tan, W., Liu, D. and Bishu, R. (2009) ‘Web evaluation: heuristic evaluation vs. user testing’, International Journal of Industrial Ergonomics, Vol. 39, pp.621–627.
Tang, Y.C. and Beynon, M.J. (2005) ‘Application and development of a fuzzy analytic hierarchy process within a capital investment study’, Journal of Economics and Management, Vol. 1, pp.207–230.
Tobar, L.M., Andrés, P.M.L. and Lapena, E.L. (2008) ‘WebA: a tool for the assistance in design and evaluation of websites’, Journal of Universal Computer Science, Vol. 14, pp.1496–1512. Troy, R., Stefan, S. and Alec, W. (2008) ‘Itrustpage: a user-assisted anti-phishing tool’,
Proceedings of the 3rd ACM SIGOPS/EuroSys European Conference on Computer Systems 2008, Glasgow, ACM, Scotland UK.
Yuan, J., Chi, C. and Sun, Q. (2005) ‘A more precise model for web retrieval’, International World Wide Web Conference, ACM, Chiba, Japan.