SIMULATION OF RIVER POND SCENARIO ON REDUCING
THE DISCHARGE PEAK OF NGOTOK RIVER
Gilang Idfi1and Wasis Wardoyo2 1
Master Student in Civil Engineering Department, ITS Surabaya 2
Civil Enginering Department, ITS Surabaya 1
[email protected] ,[email protected]
Abstract
Ngotok river is a natural channel that act as the waterbody of thirteen river branches and three drainage outlets. The catchment area of Ngotok River is about 722 km2. This river is important for Mojokerto District, since it plays an important role on controlling the yearly flood. Many efforts have been done to solve this flood problems but it remains unsolve satisfactorily yet. Therefore, a research is taken to give one other possibility to overcome the flood effects caused by very high discharge peak at every rainy season. The aim of this research is to distribute the discharge peak by creating some scenarios on releasing the amout of discharge by building pond at any river banch. By these, it can be known the best scenario of distributing the discharge peak based on the time of release and the place of builded pond. It offer 5 scenarios of the amount of ponds i.e. by simulating 2 ponds, 3 ponds, 5 ponds, 6 ponds, 7 ponds at any river banks respectively.. The result of study showed that scenario-3 with 5 ponds is the best scenario to reduce the peak discharge of Ngotok River. This scenario become reduce the peak discharge amount 507.63 m³/s and the depth of water amount 1.460 m
Keyword : Ngotok River, Flood, River Pond
INTRODUCTION
Many efforts have been done to solve this flood problems but it remains unsolve satisfactorily yet. Therefore, a research is taken to give one other possibility to overcome the flood effects caused by very high discharge peak at every rainy season. The aim of this research is to distribute the discharge peak by creating some scenarios on releasing the amout of discharge by building pond at any river banch. It offer 5 scenarios i.e. by simulating 2 ponds, 3 ponds, 5 ponds, 6 ponds, 7 ponds at any river banks respectively. This study made by creating hydrology and hydraulics modeling of Ngotok Catchment Area. The result of this study is known as the best scenario will be implemented to decrease the peak of discharge at Ngotok River.
HYDROLOGICAL CHARACTERISTIC AND ANALYSIS
Areal Rainfall
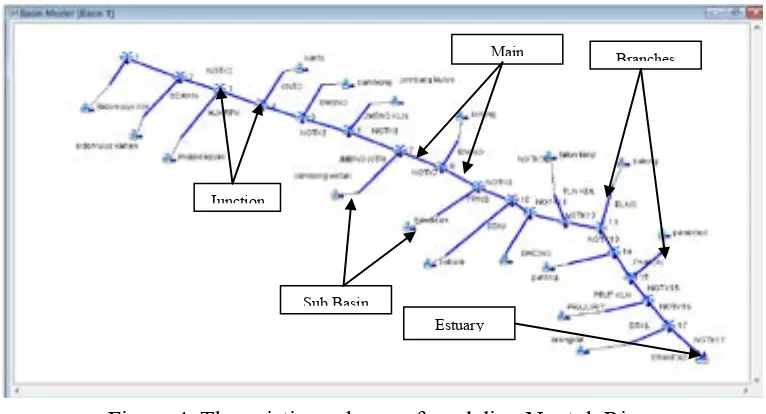
For assessing rainfall can be used Arithmetic Mean, Thiessen Polygon and Isohte Method (Suripin,2004). This study used Thiessen Polygon to calculate the areal rainfall. The Thiessen Polygon method assumes that at any point in a catchment ( can be shown in Figure 3) , the rainfall is the same that at the nearest rain gauge so the depth recorded at a given gauge is applied out to a distance halfway to next gauge in any direction. The relative weight for each gauge is determined from the corresponding area.
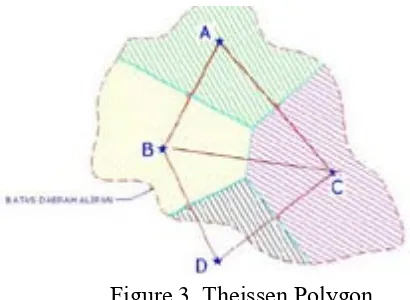
Figure 2. Location of The Ngotok River
If the area within the catchment assigned to each gauge is A, and its rainfall is Ri, the areal average rainfall for the catchment is
………..…(1)
where
Ṝ : average areal rainfall (mm) Ri : areal rainfall (mm)
A : the catchment assigned (km²)
Areal Rainfall
Runoff coefficient is ratio between surface runoff and total of rainfall. The runoff coefficient depend on by soil characteristic, land use and topography. From table 1 can be inform several number a runoff coefficient.
Table 1. Runoff Coefficient
DESCRIPTION OF MODEL
Hydrologics Analysis using HEC-HMS
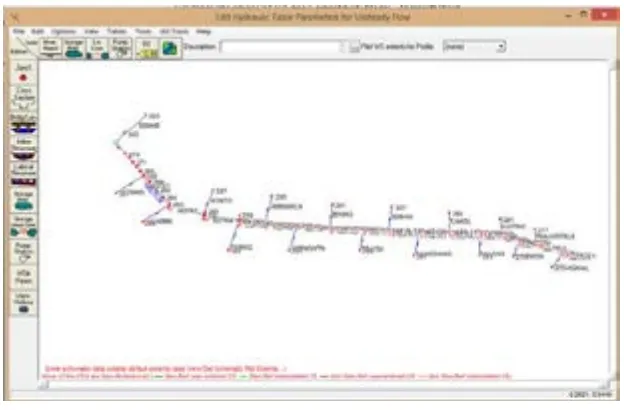
The analysis of hydrologics is supported by using the application software of HEC-HMS. This applicaton is designed to simulate the precipitation-runoff process of dendritic watershed system. The computation procedure in HEC-HMS consists of input data, computation and output as result. Input basin data used here are areal of watershed, lag time, curve number and impervious. Meteorological data consist of depth precipitation and the control specification is time duration of simulation. The existing modeling scheme can be shown in figure 4
Unsteady Flow Analysis using HEC-RAS
The analysis of hydraulics is supported by using the application software of HEC-RAS. Generally, the computation produce in HEC-RAS consists of input data, computation and the output as result. Input data used here are geometri data and boundary data. The geometry data consists of basic map data of study location and channel cross section data from survey result. After processing data, the output is obtained as result. The result can be arranged by using time control, computation interval, hydrograph interval output and detail output interval. The existing modeling scheme can be shown in figure 5
Figure 4. The existing scheme of modeling Ngotok River Junction
Sub Basin
Branches Main
RESULTS
Existing Condition
This condition is modelled by precipitation for return periode of 25 years ( X25 = 108.75 mm) for input basin data in HEC-HMS. The result of computation is flood hydrograph for return periode of years. Flood peak discharge are 719.361 m³/s and hydrograph as shown in figure 5 and 6 below.
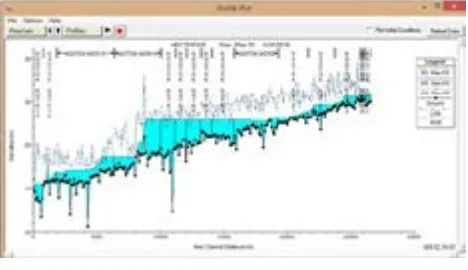
This hydrograph can be used for upstream boundary of Ngotok River in HEC-RAS modeling. The manning coefficient used is 0.02. Figure 7 shows water surface profile in long section of Ngotok River.
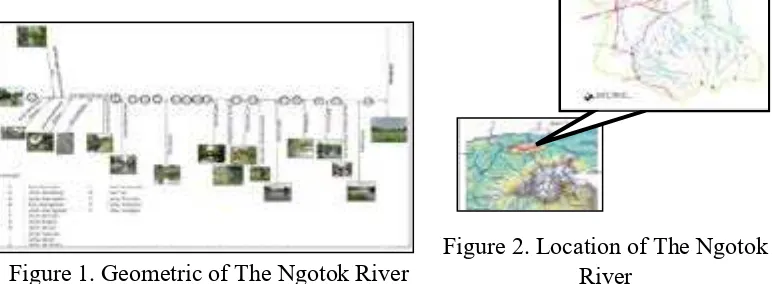
Figure 5. The existing geometric of modeling Ngotok River
Figure 5. Time series Hydrograph
Figure 6. Hydrograph for Return of 25 years
Scenario – 1 : Simulating with ponds at Panemon River and Brangkal River
This condition is modelled by 2 ponds at Panemon River and Brangkal River. Flood peak discharge are 655.493 m³/s and hydrograph as shown in figure 8 and 9 below.
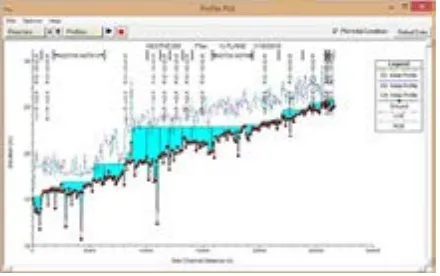
This hydrograph can be used for upstream boundary of Ngotok River in HEC-RAS modeling. The manning coefficient used is 0.02. Figure 10 shows water surface profile in long section of Ngotok River for scenario-1.
Figure 8. Time series Hydrograph
Scenario – 2 : Simulating with 3 ponds
This condition is modelled by 3 ponds at Balong River, Gunting River and Brangkal River. Flood peak discharge are 516.601 m³/s and hydrograph as shown in figure 11 and 12 below.
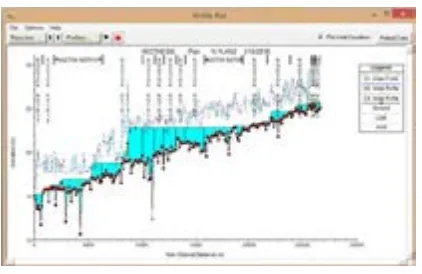
This hydrograph can be used for upstream boundary of Ngotok River in HEC-RAS modeling. The manning coefficient used is 0.02. Figure 13 shows water surface profile in long section of Ngotok River for scenario-2
Scenario – 3 : Simulating with 5 ponds
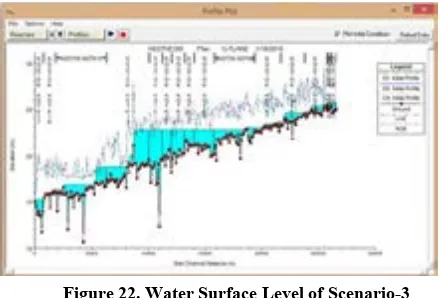
This condition is modelled by 5 ponds at Brangkal River, Gunting River, Panemon River Talun Kidul River and Sambong River. Flood peak discharge are 507.631 m³/s and hydrograph as shown in figure 14 and 15 below.
Figure 11. Time series Hydrograph Figure 12. . Hydrograph for Return of 25 years
Figure 13. Water Surface Level of Scenario-2
1.1
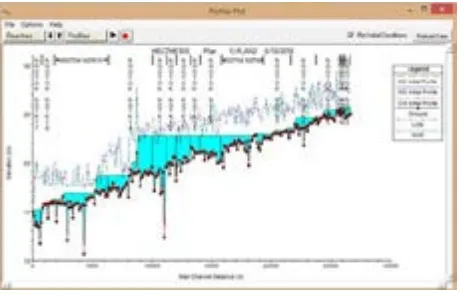
This hydrograph can be used for upstream boundary of Ngotok River in HEC-RAS modeling. The manning coefficient used is 0.02. Figure 16 shows water surface profile in long section of Ngotok River for scenario-3
Scenario – 4 : Simulating with 6 ponds
This condition is modelled by 6 ponds at Balong River, Gunting River, Brangkal River, Sambong River, Talun Kidul River and Jombang Kulon. Flood peak discharge are 468.192 m³/s and hydrograph as shown in figure 17 and 18 below
Figure 14. Time series Hydrograph Figure 15. Hydrograph for Return of 25 years
Figure 16. Water Surface Level of Scenario-4
Q25 year= 507.631 m³/s
This hydrograph can be used for upstream boundary of Ngotok River in HEC-RAS modeling. The manning coefficient used is 0.02. Figure 19 shows water surface profile in long section of Ngotok River for scenario-4
SCENARIO – 5 : SIMULATING WITH 7 PONDS
This condition is modelled by 7 ponds at Balong River, Gunting River, Brangkal River, Sambong River, Talun Kidul River and Jombang Kulon. Flood peak discharge are 431.426 m³/s and hydrograph as shown in figure 20 and 21 below
This hydrograph can be used for upstream boundary of Ngotok River in HEC-RAS modeling. The manning coefficient used is 0.02. Figure 22 shows water surface profile in long section of Ngotok River for scenario-5
Figure 19. Water Surface Level of Scenario-4
Figure 19. Time series Hydrograph
Figure 20. Hydrograph for Return of 25 years
From Table 2 and Figure 23 show the relation between peak discharge and the depht of water on all scenario, while Table 3 and Figure 24 show the change of the depth by each scenario.
Table 2. Peak Discharge and Storage Table 3. Changes Depht and Peak Discharge
CONCLUSION AND RECOMMENDATION
From table 2 can be inform that the existing peak discharge is 719.361 m³/s. If the scenario was implemented, it can be reduce the peak discharge until 431.43 m³/s or 40.026 %. In table 3 shown that the existing depth of water is 1.640 m. The scenario can be reduce until 18.12 cm if it was implemented. But, if we shown in table 2.4, the changes depth of water was produced by the third until fifth scenario not significantly, the deviasion is less than 5 cm. So the third scenario is the best choice, it will be implemented at Ngotok River. The third scenario become reduce the peak discharge amount 29.433 % and the depth of water amount 10.96 %. This study still needed effort to be complete, especially hydrology and hydraulic effect at near area where the river control construction was build.
Fig.23 The peak discharge to Storage Fig.24 Changes Depth to The Peak Discharge Figure 22. Water Surface Level of Scenario-3
Q Q
Eksisting WITH SCENARIO
(m³/s) (m³/s) (m³/s) % (10^6.m³)
1 719.361 655.49 63.868 8.878 28061.8 2 719.361 516.60 202.76 28.186 55077.1 3 719.361 507.63 211.73 29.433 60009.7 4 719.361 468.19 251.169 34.916 64596.7 5 719.361 431.43 287.935 40.026 69459.4
g g
SCENARIO Δ Q REDUCTION STORAGE
27,000
430.00 480.00 530.00 580.00 630.00
S
60.00 110.00 160.00 210.00 260.00
Δ
1 1.6400 1.6372 0.0028 0.1697 63.8680 2 1.6400 1.5528 0.0872 5.3158 202.7600 3 1.6400 1.4603 0.1797 10.9600 211.7300 4 1.6400 1.4596 0.1804 10.9979 251.1690 5 1.6400 1.4588 0.1812 11.0493 287.9350
SCENARIO Δ h REDUCTION Δ Q
REFERENCES
Anggrahini .1997. Hidrolika Saluran Terbuka, CV. Citra Media, Surabaya. Chow, V. T. 1992. Hidrolika saluran Terbuka. Jakarta,Erlangga, Jakarta. Graf, W.H, 1997, Fluvial Hydraulic, John Wiley & Sons, New York.
Jansen, Bendegon, Berg, Vries dan Zanen. 1979. Principle of River Engineering The Non-Tidal Aluvial River,Delft Uitgevers Maatsschappij. Lensley, Ray K, Franzini, Joseph B. 1991. Teknik Sumber Daya Air Jilid II,
CV. Citra Media, Surabaya.
PT. Rancang Semesta Nusantara . 2009. SID Normalisasi Kali Ngotok di Kabupaten Mojokerto, Laporan Antara.
Sri Harto Br. 1993. Analisa hidrologi,PT Gramedia Utama, Jakarta. Soemarto, C.D. 1987. Hidrologi Teknik,Erlangga, Jakarta.
Suhartanto,Ery. 2008. Panduan HEC-HMS dan Aplikasinya di Bidang Teknik Sumber Daya Air, CV Citra, Malang.
Triatmojo, B .2008. Hidrologi Terapan, Beta Offset, Yogyakarta.
USACE. 2000 . Hydrologic Modelling System HEC-HMS Technical Reference manual. http//www.hec.usace.army.mil. Maret 2000
US Army Corp of Enginneering, 2008. HEC-RAS User Manual, Davis, California.