Dynamic Sleep Scheduling on Air Pollution Levels Monitoring
with Wireless Sensor Network
Gezaq Abror, Rusminto Tjatur Widodo, M. Udin Harun Al Rasyid
Politeknik Elektronika Negeri Surabaya Kampus PENS, Jl. Raya ITS, Sukolilo Surabaya
E-mail: [email protected], [email protected], [email protected]
Abstract
Wireless Sensor Network (WSN) can be applied for Air Pollution Level Monitoring System that have been determined by the Environmental Impact Management Agency which is
,
PM10 SO2,O3, NO2 and CO. In WSN, node system is constrained to a limited power supply, so that the node system has a lifetime. To doing lifetime maximization, power management scheme is required and sensor nodes should use energy efficiently. This paper proposes dynamic sleep scheduling using Time Category-Fuzzy Logic (Time-Fuzzy) Scheduling as a reference for calculating time interval for sleep and activated node system to support power management scheme. This research contributed in power management design to be applied to the WSN system to reduce energy expenditure. From the test result in real hardware node system, it can be seen that Time-Fuzzy Scheduling is better in terms of using the battery and it is better in terms of energy consumption too because it is more efficient 51.85% when it is compared with Fuzzy Scheduling, it is more efficient 68.81% when it is compared with Standard Scheduling and it is more efficient 85.03% when compared with No Scheduling.
Keywords: Wireless Sensor Network, dynamic sleep scheduling,
energy efficiency, air pollution monitoring.
1. INTRODUCTION
Wireless Sensor Network (WSN) is a technology that uses wireless communication to transmit the data and enables the reading of the various changes in the atmosphere. Therefore the uses of WSN for highway air pollution levels are needed. The core element of a WSN system is a sensor node, where it consists of three major functional components i.e. sensory abilities, communication and processing. In WSN technology each sensor node is able to collect environmental data with using minimum energy. Sensor nodes can be communicated to each other in the network by using topology. There are few types of topology for ZigBee, like a star, a cluster-tree and a mesh [2]. Because the sensor nodes are often operating in the areas that difficult to reach with small possibility of replacement batteries and a few choice independent power supplies, so power supply planning to achieve long lifetime is becoming a top priority in the design of WSN [3]. Power supply planning can be created with sleep mode feature. Sleep mode allows the application to turn off unused modules in the microcontroller, so it can save power. AVR microcontroller provides various sleep modes that allowing user to adjust power consumption, like Idle mode, Power down mode, Power save mode and Standby mode [4]. In WSN, fuzzy logic can be used to change the sleep time so as to reduce the energy consumption and increase battery duration of the sensor devices [5]. The concept of fuzzy presents membership degree of certain situation variable at a price between 0 and 1. The variables that are abstract and subjective can be expressed numerically. To implement fuzzy logic techniques for real plan application have three stages, namely fuzzyfication, fuzzy inference process and defuzzyfication [6].
The problem of this study is in WSN technology, a node has the ability to be able to perform measurements of environmental parameters with a limited supply. So that each node requires the ability to perform power management so that it can extend the lifetime of a node. With limited selection to increasing battery ability as independent power supplies, the lifetime of the system can be extended through the power management scheme with dynamic sleep scheduling to reducing energy consumption.
The goals of this study is to extended lifetime of the system and obtain the maximum power management design to be applied to the WSN system with dynamic sleep scheduling using Time Category-Fuzzy Logic (Time-Fuzzy) Scheduling to reduce energy expenditure.
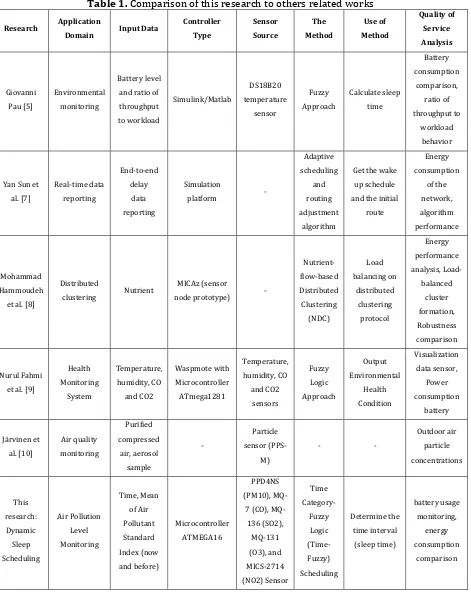
2. RELATED WORKS
throughput to workload. This FLC method is tested by Simulink/Matlab simulation to determine battery level and ratio of throughput to workload. The result shows that proposed method (FLC) can improve energy consumption when compared with other methods.
Yan Sun et al. [7] proposed a scheduling and routing scheme to guarantee delay adaptive dynamic requirements of end-to-end while minimizing energy consumption. They use a wake-up scheduling algorithm to get optimal schedule wake-up early and routes are designed with an adaptive adjustment algorithm. The proposed scheme could save at least 20% energy consumption compared to other adjustment algorithms that already exist.
MohammadHammoudeh et al. [8] proposed the development of routing protocols with provide service assurance application-specific. They present the Route Optimization and Load-balancing protocol that is ROL, which uses a variety of Quality of Service (QoS) metrics. The system is uses combination from routing metrics so it can be configured based on user-level application priority to improve network performance. They use algorithms Nutrient-flow-based Distributed Clustering (NDC) but only a simulation. The simulation results ROL/NDC shows the network lifetime is higher than other schemes, such as Mires ++.
Nurul Fahmi et al. [9] proposed an adaptive scheduling for health monitoring system with the IEEE 802.15.4 standard. This study presents scheduling scheme use Waspmote hardware by using two gas parameters, namely CO and CO2and two environmental parameters such as temperature
and humidity. Fuzzy logic algorithm used to determine the health condition in order to take a decision regarding the level of the health condition. The results are obtained power consumption measurement, for experimental without sleep scheduling is 52%, using sleep scheduling at 13% and with an adaptive sleep scheduling which ranges from 7%. Another research is on air quality monitoring section.
Järvinen et al. [10] introduced a diffusion charger based particle sensors (PPS-M) are used for the measurement of air quality in the neighborhood urban. They are investigating effect of different urban traffic-flow patterns for pollutant dispersion with different winds that applied on a real asymmetric street canyon. The result is used to observe correlation between the raw data of the PPS-M and PM2.5. There are also related research in environmental monitoring for various applications such as environmental conditions, human health, air pollution, and others [11,12,13] and secure data exchange to support environmental monitoring [14].
3. ORIGINALITY
WSN technology can be applied for environmental monitoring. In the previous WSN research on environmental monitoring [9] still used self-determined sensor parameters as measurement parameters, so the study still did not follow the rules set by the Environmental Impact Management Agency regarding the standard parameters. WSN technology is also related with energy consumption. The concept of minimizing energy consumption with fuzzy logic approach has also been proposed by previous researcher [9]. The fuzzy logic is used only to making decisions about the level of pollution of air parameters so as to support the determination of sleep duration, so it is not determining sleep duration. Other researcher [5] is used fuzzy logic to determine only one kind of output of the sleep duration, so it does not have output with other variations.
The contribution of this paper is to implement power management design into WSN system to reduce energy expenditure. Power management scheme in this paper is using dynamic sleep scheduling with Time Category-Fuzzy Logic (Time-Category-Fuzzy) Scheduling. This method is used to determine the time interval automatically based on the sensor readings and data collecting time. This time interval is applied to the node system hardware to determine the length of sleep time. The concept of this method is to combine time category and fuzzy logic so that it can produce 4 different fuzzy outputs based on the sensor readings and data collecting time. The measurement parameters of air pollution are also adjusted to the parameters specified by the Environmental Impact Management Agency, so that the input parameters as the basis for decision making to determining the time interval is using standard parameters. So with this method, WSN system can be adapted against time and data measurement results of Air Pollution Standard Index to reduce energy expenditure.
4. SYSTEM DESIGN
4.1 Air Pollution Level Monitoring System
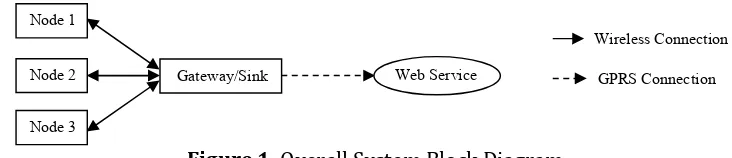
This section will explain about air pollution level monitoring system. In this study used 3 nodes and 1 Gateway/Sink. Node system is working to collect variable test data that will be sent to the Gateway/Sink. The data that already collected by the Gateway/Sink will be accommodated and it will be uploaded to the specific website address that has been provided.
Figure 1 represents hardware system for air pollution level monitoring. For each node will use 5 units of gas sensors that have been determined by the State Minister of Environment which is PM10,SO2,O3, NO2 and CO and it
Figure 1. Overall System Block Diagram
4.1.1 Node System
Node system is the system that to serves collects variable data measurements on a network. Figure 2 represents node system hardware block diagram. Node is using 5 pieces of sensor which integrated with a microcontroller ATMEGA16. The sensor consists of a PPD4NS Sensor (PM10),
MQ-7 Sensor (CO), MQ-136 Sensor (SO2), MQ-131 Sensor (O3), and
MICS-2714 Sensor (NO2). For wireless data transmission used XBee Module with
802.15.4 standard.
Figure 2. Node System Hardware Block Diagram
Node is also equipped with Real Time Clock (RTC) Module to know the time when the data samples were taken, Voltage Regulator which functions as a stabilizer and supply voltage according to the characteristics of the system nodes and LED indicator as an indicator when the node system is turned on.
At first node system will doing warming up step. Then the system nodes must be joined into a sensors network that is already available. Once the nodes incorporated into a sensor network (connected to the Gateway/Sink), then the node will take the data according to five parameters measurement of air pollution. Data will be stored and sent to the Gateway/Sink. Parameter measurement of the air pollution will be used as a reference for determining the length of time that node system performing data measurements and transmitted the data measurements and performing sleep (Time Interval). After sleep according to Time Interval then the node will wake up again and performing data measurement again.
NO2
Sensor
Voltage Input O3
Sensor
LED Indicator Voltage
Regulator CO
Sensor
Xbee Tx ATMEGA16
Microcontroller SO2
Sensor
Real Time Clock PM10
Sensor Node 3
Web Service Gateway/Sink
Node 2 Node 1
4.1.2 Gateway/Sink System
Gateway/Sink is the system that to serves collect data which obtained from the node system, synchronizes scheduling, and transmit measured data package to the web service for information appearance.
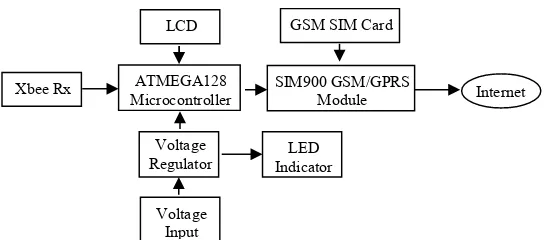
Figure 3. Gateway/Sink System Hardware Block Diagram
Figure 3 represents Gateway/Sink system hardware, Gateway/Sink also equipped with LCD for easy look at the incoming data in the Gateway/Sink, Voltage Regulator which functions as a stabilizer and supply voltage according to the characteristics of the system Gateway/Sink and LED indicator as an indicator when the system Gateway/Sink is turned on. To perform sending data packets to a Web service, SIM900 GSM/GPRS Module is used GSM Card with has already registered Internet data packet. This internet data packet has been provided by the respective cellular phone providers in Indonesia. For wireless communication with node system, Gateway/Sink is used XBee Module with 802.15.4 standard.
At first Gateway/Sink will acts as the sensor network coordinator. Gateway/Sink will send a broadcast message so that nodes can join the network. If there is a request from the node to joining the network, Gateway/Sink will give permission so that nodes can join the network. Gateway/Sink will wait for delivery of data packets carried by the node. Once the entire data packet is received, and then the data packet will be sent to the database using SIM900 GSM/GPRS Module to a Web Service then it will be displayed as information for the public. The data that are sent to the Web Service will be placed on a database to facilitate the processing of the data that will be used as information about air quality measured on the road with air pollution category.
4.1.3 Topology
The topology that used in this study is Star topology. This topology is a design of network topologies where communication occurs from the central node to every nodes or users. In this topology there is a Gateway/Sink that serves as a central node and connecting node to other nodes.
For wireless communications is used XBee Pro Series 1, which uses 802.15.4 standard. For wireless communication, network parameters setting are performed specifically for PAN ID (code: ID), Channel Communication
Voltage Input
LED Indicator Voltage
Regulator
Internet SIM900 GSM/GPRS
Module ATMEGA128
Microcontroller Xbee Rx
(code: CH), Serial Number (code: SH for Serial High and SL for Serial Low), and Destination Address (code: DH for Destination High and DL for Destination Low).
Figure 4. Communication Scheme with Star Topology
Figure 4 represents communication scheme with Star Topology. The experiments were performed with DH of Gateway is addressing to FFFF and DL of Gateway is addressing to 0. DH of node 1 is addressing to SH of Gateway and DL of node 1 is addressing to SL of Gateway. DH of node 2 is addressing to SH of Gateway and DL of node 2 is addressing to SL of Gateway. And DH of node 3 is addressing to SH of Gateway and DL of node 3 is addressing to SL of Gateway.
4.2 Proposed Method
In this research, we proposed dynamic sleep scheduling using Time Category-Fuzzy Logic (Time-Fuzzy) Scheduling. Time Category-Fuzzy Logic (Time-Fuzzy) Scheduling is used to determine the time interval automatically based on the sensor readings and data collecting time. Time Category is used to determine crisp output of fuzzy logic so it can be adapted against time. Fuzzy Logic is used to determine time interval in node system so it can adapt against data measurement results of Air Pollution Standard Index. Time interval will be used to determine the length of a node system in a sleep mode to save energy consumption.
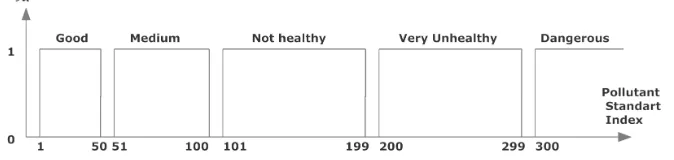
Air Pollution Standard Index is the information that published by the Environmental Impact Management Agency with Number: Kep-45/MENLH/10/1997 about air pollution index (ISPU). This Index may be specified by five categories of measurement results, that are Good, Medium, Not healthy, Very Unhealthy and Dangerous [15]. From the five categories of parameters air pollution measurements can be made classical set of data that is useful as a preparation of membership functions input fuzzy logic. Classical Set Air Pollutant Standard Index can be shown on Figure 5.
Node 3 Gateway/Sink (GW)
Node 2 Node 1
DL=FFFF DH=0
DL=SL(GW)
Figure 5. Classical Set Air Pollutant Standard Index
4.2.1 Time Category-Fuzzy Logic (Time-Fuzzy) Scheduling
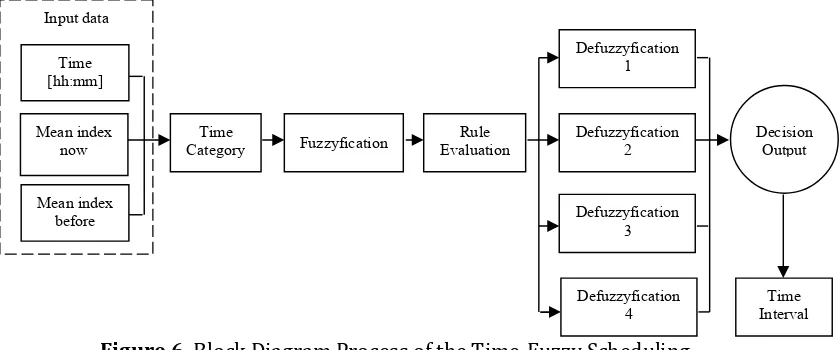
This Time-Fuzzy Scheduling method is implemented when node system is in active state. Figure 6 presents the whole process of the Time-Fuzzy Scheduling method. The data input is time data, mean index now for air pollution index, and mean index before for air pollution index. The first stage is Time Category stage. At this stage, it will be determined defuzzyfication options are used based on time data with 4 options. The second stage is fuzzyfication stage. At this stage, the data input (mean index now for air pollution index and mean index before for air pollution index) is converted to fuzzy input. The third stage is rule evaluation stage. At this stage, fuzzy input is processed by using the rule that already created. The fourth stage is defuzzyfication stage. At this stage consists of 4 defuzzyfication options, and fuzzy output is converted to the decision value output. This defuzzyfication options is based on the results that obtained at Time Category stage. The result of defuzzyfication is decision output that used as the time interval value (sleep duration).
Figure 6. Block Diagram Process of the Time-Fuzzy Scheduling
The first stage is Time Category stage. Time Category stage is used to determine crisp output of fuzzy logic so it can be adapted against time change within 24 hours.
Category 1
Time : 00.01-06.00 Max Crisp Output Fuzzy: 60 minutes
Category 2
Time : 06.01-12.00 Max Crisp Output Fuzzy: 15
minutes
Category 3
Time : 12.01-18.00 Max Crisp Output Fuzzy: 15 minutes
Category 4
Time : 18.01-00.00 Max Crisp Output Fuzzy: 30
minutes
Figure 7. Distribution of Time Category Stage
Figure 7 shows distribution of Time Category stage. Time Category stage is adopts the concept of Slot Scheduling [16], where one day is divided
Input data
Time
into equal time categories with the length of time is the same value. In this study, Time Category stage uses 4 categories of time, where each category is worth 6 hours. Time Category 1 is at 00.01 to 06.00 with maximum crisp output fuzzy is 60 minutes. Time Category 2 is at 06:01 until 12:00 with maximum crisp output fuzzy is 15 minutes refers to the distribution of time intervals for environmental information [17]. Time Category 3 is at 12:01 until 18:00 with maximum crisp output fuzzy is 15 minutes and it is same with time category 2. Time Category 4 is at 18:01 until 12:00 with maximum crisp output fuzzy is 30 minutes.
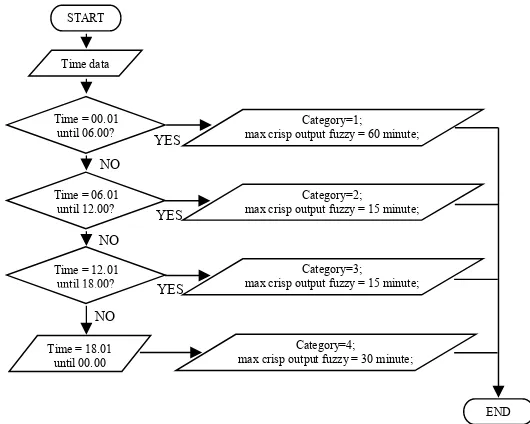
Figure 8. Flowchart of Time Category Stage
Figure 8 shows how Time Category stage is work. At the beginning of Time Category stage, the node will take time data from Real Time Clock hardware, where the captured data is the data of hours and minutes. After hours and minutes are known then matching the time data to the category of time that has been provided. If the category is 1, the maximum time crisp output fuzzy that is 60 minutes (defuzzyfication 1). If category is 2, the maximum time crisp output fuzzy that is 15 minutes (defuzzyfication 2). If category is 3, the maximum time crisp output fuzzy that is 15 minutes (defuzzyfication 3). If category is 4, the maximum time crisp output fuzzy that is 30 minutes (defuzzyfication 4).
After Time Category stage ends, the process will continue to Fuzzy Logic process (fuzzyfication stage, rule evaluation stage, defuzzyfication stage). Fuzzy Logic is used to determine time interval in node system so it can adapt against data measurement results of Air Pollution Standard Index.
Table 2 presents Fuzzyfication based on Air Pollution Standard Index. From the classical set of data that have been made previously by the Air Pollution Standard Index then be made fuzzy logic input membership function by referring to the data classical set.
YES
max crisp output fuzzy = 30 minute; Time = 18.01
until 00.00
Category=3; max crisp output fuzzy = 15 minute; Time = 12.01
until 18.00?
Category=2; max crisp output fuzzy = 15 minute; Time = 06.01
until 12.00?
Category=1; max crisp output fuzzy = 60 minute; Time = 00.01
until 06.00? Time data
Table 2.Fuzzyfication based on Air Pollution Standard Index
Index Category Low Limit High Limit
1-50 Good 0 60
51-100 Medium 41 110
101-199 Not Healthy 91 209
200-299 Very Unhealthy 190 309
300-more Dangerous 290 more
To determine the upper limit of a membership function input fuzzy logic then uses the upper limit of the data classical set Standard Air Pollution Index coupled with 10, as well as to determine the lower limit membership function input fuzzy logic then use the lower limit of the data classical set index Standard Air Pollution is reduced by 10.
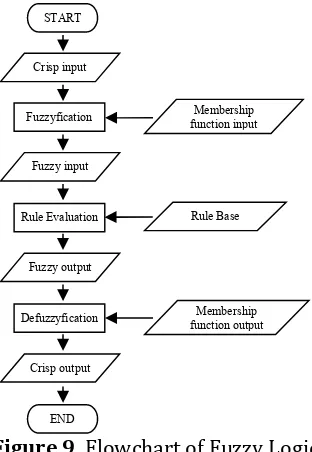
Figure 9. Flowchart of Fuzzy Logic
Figure 9 shows how Fuzzy Logic is work. In fuzzy logic, input data is the crisp data. The crisp data is then carried out by fuzzyfication process involving input membership function fuzzy logic that has been made. Data that already passed fuzzyfication process is called fuzzy input data. Furthermore, the fuzzy input data is evaluated using the Rule base that has been made. Data that has been evaluated based on Rule base is a fuzzy logic output. To change output fuzzy logic into the crisp data goes through a defuzzyfication based membership function outputs that have been made. A result of defuzzyfication process is crisp output fuzzy logic.
At the fuzzyfication stage, the crisp input data is changed into the fuzzy input data. From fuzzyfication process then made input membership function
END Crisp output
Membership function output Defuzzyfication
Fuzzy output
Rule Base Rule Evaluation
Fuzzy input
Membership function input Fuzzyfication
which is mean index now and mean index before based on classical data set of Air Pollution Standard Index.
Figure 10. Fuzzy set of Mean Index Now
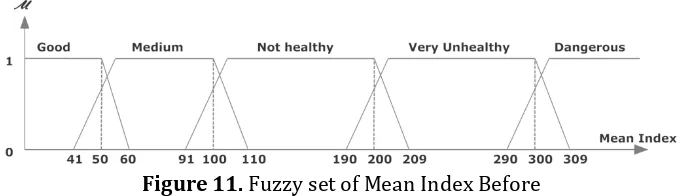
It is created trapezoidal curve for membership input fuzzy logic for both membership functions input, mean index now that can be shown on Figure 10 and mean index before that can be shown on Figure 11.
Figure 11. Fuzzy set of Mean Index Before
For the members of membership function input which is a good index (0 to 60), medium (41 to 110), not healthy (91 and 209), very unhealthy (190 to 309) and dangerous (290 more). To calculate the mean index (applies to mean index now and mean index before) by using the formula on Equation 1.
5 3 2
2
10 indexSO indexCO indexO indexNO
PM index index
mean (1)
Table 3.Rule Base
At the defuzzyfication stage, the output fuzzy data is converted into crisp output data. Membership functions output for each category of time are different. Time Category stage has been set up maximum crisp output fuzzy logic for each category of time.
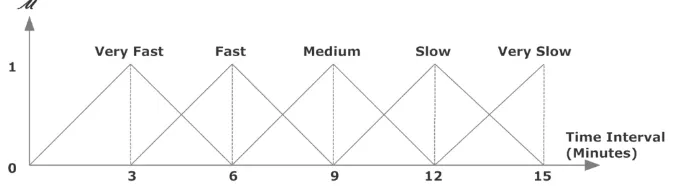
Figure 12. Membership Function Output at Time Category 1
Figure 12 shows membership function output at time category 1. At time category 1, maximum crisp output fuzzy logic (defuzzyfication1) is 60 minutes, and then it’s made the output membership function with a triangular curve. Members of membership function output is very fast (0 to 24 minutes), fast (12 to 36 minutes), medium (24 to 48 minutes), slow (36 to 60 minutes) and very slow (48 minutes up to a maximum).
Figure 13. Membership Function Output at Time Category 2 and Time Category 3
Mean Index Before Mean
Index Now
Good Medium Healthy Not Unhealthy Dangerous Very
Good Very Slow Very Slow Very Slow Medium Medium
Medium Very
Slow Slow Slow Medium Medium
Not Healthy Slow Slow Medium Fast Very Fast
Very
Unhealthy Medium Medium Fast Fast Very Fast
Figure 13 shows membership function output at time category 2 and 3. At the time categories 2 and 3, maximum crisp output fuzzy logic (defuzzyfication2 and defuzzyfication 3) is 15 minutes, and then it’s made the output membership function with a triangular curve. Members of membership function output is very fast (0 to 6 minutes), fast (3 to 9 minutes), medium (6 to 12 minutes), slow (9 to 15 minutes) and very slow (12 minutes up to a maximum).
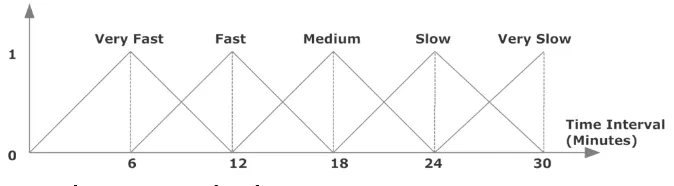
Figure 14. Membership Function Output at Time Category 4
Figure 14 shows membership function output at time category 4. At the time category 4, maximum crisp output fuzzy logic (defuzzyfication4) is 30 minutes, and then it’s made the output membership function with a triangular curve. Members of membership function output is very fast (0 to 12 minutes), fast (6 to 18 minutes), medium (12 to 24 minutes), slow (18 to 30 minutes) and very slow (24 minutes up to a maximum).
To calculate the crisp output value of fuzzy logic at defuzzyfication stage, it is used Centre of Gravity (COG) method. It is a method to find the point that divides the area of the solution into 2 equal parts. COG's formula can be seen on Equation 2.
n
i i
i i
z z z COG
1 ( ) ) (
(2)
Where zi is a fuzzy output and (zi) is a membership function output
fuzzy. After the crisp output value of fuzzy logic is obtained, and then these results will be used as the length of time interval (sleep duration).
RTC module by I²C communication. The node will in sleep state until it gets the wake up signal sent by the RTC module. When the wake up time is met, the alarm feature of the RTC module will send the interrupt signal to the microcontroller node system. When the node microcontroller system receives an interrupt signal it will turn off the sub routine of sleep program, so that the node will wake up and entering active state to perform the data measurement process.
In this research is using Time-Fuzzy Scheduling algorithm namely Algorithm 1. For comparison algorithms used Fuzzy Scheduling algorithm namely Algorithm 2, Standard Scheduling algorithm namely Algorithm 3 and No Scheduling algorithm namely Algorithm 4.
Algorithm 1.Time-Fuzzy Scheduling (Proposed) INPUT : Time, Data Sensor PM10, SO2, CO, O3, NO2 OUTPUT : Data Monitoring, Time Interval, Time Category
PM10, SO2, CO, O3, NO2, mean_index_now, mean_index_before : float; index_PM10, index_SO2, index_CO, index_O3, index_NO2 : float;
index_ before_PM10, index_ before_SO2, index_ before_CO, index_ before_O3, index_ before_NO2 : float;
time_interval : float;
hours, minutes, second, date, month, year, category : unsigned int;
get_data(&PM10,& SO2,& CO,&O3,&NO2); get_index(&PM10,& SO2,& CO,&O3,&NO2);
get_index_before(&PM10,& SO2,& CO,&O3,&NO2);
mean_index_now= (index_PM10+ index_SO2+ index_CO+ index_O3+ index_NO2)/5;
mean_index_before= (index_ before_PM10+ index_ before_SO2+ index_ before_CO+ index_ before_O3+ index_ before_NO2)/5;
fuzzification(mean_index_now, mean_index_before); rtc_get_time(&hours,&minutes,&second);
rtc_get_date(&date,&month,&year); if(time>00:00 && time<=06:00){ category=1;
time_interval=defuzzification_1(); } else if(time>06:00 && time<=12:00){ category=2;
time_interval=defuzzification_2(); } else if(time>12:00 && time<=18:00){ category=3;
time_interval=defuzzification_3(); } else if(time>18:00 && time<=00:00){ category=4;
}
Send data monitoring to gateway; Going to sleep mode: time_interval;
Algorithm 2.Fuzzy Scheduling
INPUT : Time, Data Sensor PM10, SO2, CO, O3, NO2 OUTPUT : Data Monitoring, Time Interval, Time Category
PM10, SO2, CO, O3, NO2, mean_index_now, mean_index_before : float; index_PM10, index_SO2, index_CO, index_O3, index_NO2 : float;
index_ before_PM10, index_ before_SO2, index_ before_CO, index_ before_O3, index_ before_NO2 : float;
time_interval : float;
hours, minutes, second, date, month, year, category : unsigned int;
get_data(&PM10,& SO2,& CO,&O3,&NO2); get_index(&PM10,& SO2,& CO,&O3,&NO2);
get_index_before(&PM10,& SO2,& CO,&O3,&NO2);
mean_index_now= (index_PM10+ index_SO2+ index_CO+ index_O3+ index_NO2)/5;
mean_index_before= (index_ before_PM10+ index_ before_SO2+ index_ before_CO+ index_ before_O3+ index_ before_NO2)/5;
fuzzification(mean_index_now, mean_index_before); rtc_get_time(&hours,&minutes,&second);
rtc_get_date(&date,&month,&year); time_interval=defuzzification();
Send data monitoring to gateway; Going to sleep mode: time_interval;
Algorithm 3.Standard Scheduling
INPUT : Time, Data Sensor PM10, SO2, CO, O3, NO2 OUTPUT : Data Monitoring
PM10, SO2, CO, O3, NO2 : float;
index_PM10, index_SO2, index_CO, index_O3, index_NO2 : float; hours, minutes, second, date, month, year, category : unsigned int;
get_data(&PM10,& SO2,& CO,&O3,&NO2); get_index(&PM10,& SO2,& CO,&O3,&NO2); rtc_get_time(&hours,&minutes,&second); rtc_get_date(&date,&month,&year);
Going to sleep mode: 15 minutes;
Algorithm 4.No Scheduling
INPUT : Time, Data Sensor PM10, SO2, CO, O3, NO2 OUTPUT : Data Monitoring
PM10, SO2, CO, O3, NO2 : float;
index_PM10, index_SO2, index_CO, index_O3, index_NO2 : float; hours, minutes, second, date, month, year, category : unsigned int;
get_data(&PM10,& SO2,& CO,&O3,&NO2); get_index(&PM10,& SO2,& CO,&O3,&NO2); rtc_get_time(&hours,&minutes,&second); rtc_get_date(&date,&month,&year);
Send data monitoring to gateway;
5. EXPERIMENT AND ANALYSIS
Tests were conducted to determine the performance of the real hardware system that has been created. So it can be analyzed based on test results that have been obtained.
5.1 Current Consumption for Each Node
In testing of the hardware node system, current consumption for each node is measured to estimate lifetime for each node. This test aims to determine the main load ratio of the regulator, led indicator, microcontroller, Xbee Module, RTC Module and 5 type of sensor on hardware node system during active condition.
Figure 15. Comparison of Load in Node System
mA, load current of Xbee Module is equal to 56.2 mA and load current of RTC is equal to 7.85 mA. It can be seen on Figure 15 that in comparison to the type of load on the node (without sensor) that the biggest load current is Xbee Transmit with value 120 mA and followed by microcontroller ATMEGA16 and XBee Idle/Receive with the load currents are 57.5 mA and 56.2 mA. For regulators, LED indicators and Real Time Clock load current is below 10 mA.
Do also test the load current of each sensor on the sensor node system. For the sensor being tested are PPD4NS Sensor (PM10), MQ-7 Sensor (CO),
MQ-136 Sensor (SO2), MQ-131 Sensor (O3), and MICS-2714 Sensor (NO2).
Figure 16. Comparison Current Load of Each Sensor
It can be seen on Figure 16 about comparison current load for each sensor nodes that the largest load current sensor is MQ-131 sensor with value 125 mA, followed by MQ-136 sensor with value 92.5 mA, PPD4NS sensor with value 62.5 mA, MQ-7 sensor with value 60 mA and the smallest load current sensor is MICS-2714 sensor with value 23 mA.
A large current load is also present in the use of sensors because the type of sensor is used principle of the heater. Therefore, sensor load management must be done to reduce the level of energy consumption. Sensor load management is supported by switching transistor hardware to control the sensor supply, so the sensor can be switched off while in sleep state and it can be switched on when in active mode. The addition of switching transistor hardware is intended to reduce current load consumption by sensors.
Figure 17 represents schematic of switching transistor hardware. For the transistor type is using NPN transistor. The granting of commands to enable and disable sensors on switching transistor hardware is done by the ATMEGA16 microcontroller on the node system. This command is held by sending HIGH logic (connected to VCC/5V) or LOW logic (connected to ground/0V). When a command with HIGH logic is sent to the switching transistor hardware then the sensor will turn on and when the command with LOW logic is sent to the switching transistor hardware then the sensor will turn off. When the node system is in active condition then the sensor is turned on, while the system node in sleep state then the sensor is turned off.
5.2 Power Management on AVR ATMEGA16 Microcontroller
At testing power management, there are using Sleep Mode parameters that have been provided by ATMEGA16 Chip, some of them are Idle, Standby, Power save and Power down. Testing procedure is measuring current consumption with the state of the microcontroller is active and when the microcontroller enters sleep mode.
Figure 18. Comparison of Power Managements on AVR ATMEGA16
Figure 18 shows comparison of power management on AVR ATMEGA16 Microcontroller. In testing the power management can be known for Idle condition load current is decrease by 12.5 mA, for Standby condition load current is decrease by 25 mA, for Power save condition load current is decrease by 30 mA, and for Power down condition load current is decrease by 35 mA. So it can be seen that lowest current in sleep mode parameters for power management is Power down condition with current consumption is 25 mA.
5.3 Battery Usage
Testing the battery usage conducted to determine how the battery's ability to supplying node system. The battery that used in this experiment has initial voltage (fully voltage condition) with value 12.69 V. Do test of the four conditions, namely: Time-Fuzzy Scheduling: a proposed dynamic sleep scheduling method in this study, which is Time Category-Fuzzy Logic (Time-Fuzzy) Scheduling. Fuzzy Scheduling: a method for sleep scheduling with standard fuzzy logic approach. Standard Scheduling: a standard sleep scheduling method which value of time interval is 15 minutes refers to the distribution of time intervals for environmental information [17]. No Scheduling: a condition where the node system does not perform sleep scheduling method in monitoring and data delivery.
Figure 19. Comparison of Battery Monitoring
Scheduling when compared with Time-Fuzzy Scheduling, Fuzzy Scheduling and Standard Scheduling, that is equal to 0.72 V during 60 minutes test. It can be seen that Time-Fuzzy Scheduling is better in terms of using the battery because the battery voltage obtained is biggest when compared with other methods.
5.4 Energy Consumption
Testing the energy consumption is to determine the level of energy consumption that has been used by the node system, with energy supply is from the battery energy. Energy consumption is the level of energy that has been used by the system node for some unit of time. Do test of the four conditions, namely: Time-Fuzzy Scheduling: a proposed dynamic sleep scheduling method in this study, which is Time Category-Fuzzy Logic (Time-Fuzzy) Scheduling. Fuzzy Scheduling: a method for sleep scheduling with standard fuzzy logic approach. Standard Scheduling: a standard sleep scheduling method which value of time interval is 15 minutes refers to the distribution of time intervals for environmental information [17]. No Scheduling: a condition where the node system does not perform sleep scheduling method in monitoring and data delivery.
Figure 20. Comparison of Energy Consumption
For energy consumption for each method that used in this test can be calculated with Equation 3.
) (sec ) (
) ( )
(Joule V Volt I Ampere t ond
EConsumption (3)
method. Energy efficiency value (%) calculation is using the formula on system. From the test results obtained by comparison of 4 methods that is Time-Fuzzy Scheduling, Fuzzy Scheduling, Standard Scheduling and No Scheduling. It can be seen that Time-Fuzzy Scheduling during the 60 minute test, it is obtained the energy consumption that is equal to 18.10 J. Fuzzy Scheduling for 60 minutes test, it is obtained energy consumption that is equal to 37.60 J. Standard Scheduling for 60 minutes test, it is obtained energy consumption that is equal to 58.05 J. And No Scheduling during 60 minutes test, it is obtained energy consumption that is equal to 120.98 J. From the comparison of energy consumption is obtained energy efficiency value. It can be seen that the energy efficiency on Time-Fuzzy Scheduling is more efficient 51.85% when it is compared with Fuzzy Scheduling, it is more efficient 68.81% when compared with Standard Scheduling and it is more efficient 85.03% when compared with No Scheduling. Fuzzy Scheduling is better than Standard Scheduling with 35.22% energy efficiency value and better than No Scheduling with 68.92% energy efficiency value. While the Standard Scheduling just better than No Scheduling with 52.01% energy efficiency value. Thus, it can be seen that Time-Fuzzy Scheduling is better in terms of energy consumption because it uses the least energy when compared to other methods.
5.5 Decision Making of Time Interval with Time-Fuzzy
This test was conducted to determine the decisions making by the Time-Fuzzy Scheduling method. The decision taken in the form of the time interval value for each category of time based on 25 rules that have been created. Testing was conducted on a hardware node system with LCD (in order to facilitate testing) as a display of decision making value. Decision making of time interval with Time-Fuzzy Scheduling can be shown on Table 4.
Table 4.Decision Making of Time Interval with Time-Fuzzy Scheduling
Rule Index Mean Now Value
Mean Index Before
Value
Time Interval (minutes)
Category 1 Category 2 and
Category 3 Category 4
1 30 30 54.5 14 27.5
2 30 75 54.5 14 27.5
3 30 150 54.5 14 27.5
4 30 250 30.5 8 15.5
5 30 310 30.5 8 15.5
6 75 30 54.5 14 27.5
7 75 75 42.5 11 21.5
8 75 150 42.5 11 21.5
9 75 250 30.5 8 15.5
10 75 310 30.5 8 15.5
11 150 30 42.5 11 21.5
12 150 75 42.5 11 21.5
13 150 150 30.5 8 15.5
14 150 250 18.5 5 9.5
15 150 310 6 1.5 3
16 250 30 30.5 8 15.5
17 250 75 30.5 8 15.5
18 250 150 18.5 5 9.5
19 250 250 18.5 5 9.5
20 250 310 6 1.5 3
21 310 30 18.5 5 9.5
22 310 75 18.5 5 9.5
23 310 150 6 1.5 3
24 310 250 6 1.5 3
25 310 310 6 1.5 3
6. CONCLUSION
Scheduling and it is more efficient 85.03% when compared with No Scheduling.
REFERENCES
[1] Environment Agency of Surabaya,Chapter IV Air, Environment Agency of
Surabaya (Surabaya), 2008.
[2] Toshinori Takabatake, Power Consumption on Topologies for A Sensor-Based Home Network, IAENG International Journal of Computer
Science (IJCS), 39:3, 2012.
[3] Rick Wan Kei Ha, A Sleep-Scheduling-Based Cross-Layer Design Approach for Application-Specific Wireless Sensor Networks, Doctor of Philosophy thesis, University of Waterloo (Waterloo), 2006.
[4] Atmel, Data Sheet 8-bit Microcontroller with 16K Bytes In-System
Programmable Flash ATmega16 ATmega16L, Atmel Corporation, Rev.
2466T–AVR–07/10, 2010.
[5] Giovanni Pau, Power Consumption Reduction for Wireless Sensor Networks Using A Fuzzy Approach, International Journal of Engineering
and Technology Innovation (IJETI), vol . 6, no. 1, pp. 55 – 67, 2016.
[6] Ying Bai, Hanqi Zhuang, and Dali Wang, Advanced Fuzzy Logic Technologies in Industrial Applications, Springer Science & Business
Media (London), 2006.
[7] Yan Sun, Cong Chen, and Hong Luo, Adaptive Scheduling and Routing
Scheme for Delay Guarantee in Wireless Sensor Networks,
International Journal of Distributed Sensor Networks, Hindawi Publishing
Corporation, Volume 2013, Article ID 801758, pp.1-13, 2013.
[8] Mohammad Hammoudeh, Robert Newman, Adaptive Routing in Wireless Sensor Networks: QoS Optimisation for Enhanced Application Performance, Information Fusion 22, Elsevier, pp.3–15, 2015.
[9] Nurul Fahmi, M. Udin Harun Al Rasyid, Amang Sudarsono, Adaptive Sleep Scheduling for Health Monitoring System Based on The IEEE 802.15.4 Standard, EMITTER International Journal of Engineering
Technology, Vol. 4, No. 1, pp.91-114, 2016.
[10] A. Järvinen, H. Kuuluvainen, J.V. Niemi, S. Saari, M. Dal Maso, L. Pirjola, R. Hillamo, K. Janka, J. Keskinen, T. Rönkkö, Monitoring Urban Air Quality with A Diffusion Charger Based Electrical Particle Sensor,
[11] M. Udin Harun Al Rasyid, Achmad Sayfudin, Arif Basofi, Amang Sudarsono, Development of Semantic Sensor Web for Monitoring
Environment Conditions, International Seminar on Intelligent
Technology and Its Applications (ISITIA), Lombok Indonesia, 2016.
[12] Samsul Huda, Nurul Fahmi, Amang Sudarsono, M. Udin Harun Al Rasyid, Secure Data Sensor Sharing on Ubiquitous Environmental Health Monitoring Application, Jurnal Teknologi (Sciences &
Engineering), 78: 6–3, pp.53-58, 2016.
[13] M. Udin Harun Al Rasyid, Isbat Uzzin Nadhori, Amang Sudarsono, Yodhista Tulus Alnovinda, Pollution Monitoring System Using Gas Sensor Based on Wireless Sensor Network, International Journal of
Engineering and Technology Innovation (IJETI), vol. 6, no. 1, pp.79 - 91,
2016.
[14] Amang Sudarsono, Samsul Huda, Nurul Fahmi, M. Udin Harun Al-Rasyid, and Prima Kristalina, Secure Data Exchange in Environmental
Health Monitoring System through Wireless Sensor Network,
International Journal of Engineering and Technology Innovation (IJETI), vol
. 6, no. 2, pp. 103 – 122, 2016.
[15] Environmental Impact Management Agency, Technical Guidelines for Calculation and Reporting and Information of Air Pollution Standards Index, Environmental Impact Management Agency (Jakarta), Decision of the Head of the Environmental Impact Management Agency Number: KEP- 107/KABAPEDAL/11/1997, 1998.
[16] Jong Chern Lim, Chris Bleakley, Adaptive WSN Scheduling for
Lifetime Extension in Environmental Monitoring Applications,
International Journal of Distributed Sensor Networks, Hindawi Publishing
Corporation, pp.1-17, 2012.
[17] Yanheng Liu, Lei Zhang, Aimin Wang and Dayang Sun, An Adjustable Sleep Scheduling Framework for WSN, International Journal of Future
Generation Communication and Networking, Vol.7, No.3, pp.213-228,