FACTORS ASSOCIATED WITH OVERWEIGHT/OBESITY AMONG ADULTS IN URBAN INDONESIA
(FAKTOR-FAKTOR YANG TERKAIT DENGAN OBESITAS PADA ORANG DEWASA DI PERKOTAAN INDONESIA)
Helda Khusun1, Luh Ade Ari Wiradnyani1, dan Nora Siagian2
1SEAMEO RECFON (Regional Center for Food and Nutrition), Universitas Indonesia, Jl. Salemba Raya 6,
Jakarta Pusat 10430, Indonesia,
2SPRIM Indonesia, Crown Palace Blok D 03, Jl. Prof. Dr. Soepomo no. 231, Jakarta Selatan 12870, Indonesia.
E-mail: [email protected]
Diterima: 02-10-2015 Direvisi: 27-11-2015 Disetujui: 03-12-2015
ABSTRACT
Overweight/obesity is increasing in developing countries, including Indonesia, being more prevalent in urban than rural areas. Understanding about associated factors of overweight/obesity is important for intervention purposes. The study objective was to assess factors associated with overweight/obesity in urban Indonesians. This cross-sectional study involved primary data collection among 864 adults aged 18-45 years in five major urban cities of Indonesia. Weight, height, waist and hip circumference were measured, and overweight/obesity was defined as BMI>25 kg/m2. Factors associated to overweight/obesity was ellicited by logistic regression. The study showed that proportion of overweight/obesity was significantly higher among women than men (42.8% and 29.2%). Median total energy intake was 1974 kcal/day, and median fat intake was high (75.3 g; 25th-75th percentile: 49.6-109.4 g). More than 70 percent of subjects consumed high energy dense food/beverages often. Only around 27 percent of the subjects had high intensity physical activity/PA level and more than 50 percent spent >6 hours using TV/computer, indicating low PA level. After adjusting for confounders, often consumption of high energy dense food consistenly showed association, although not signficant, with overweight/obesity. Moreover, men with higher sedentary activities indicated by TV/computer usage >6 hours/day and women with less days of performing vigorous PA had 1.4 and 3 times higher odds to become overweight/obese, respectively. Thus, overweight/obesity prevention should focus on reduction of consumption of high-dense energy food, including fat intake; coupled with increasing PA level by having more days of vigourous recreational PA and reduction of TV/computer usage, especially among married older urban adult.
Keywords: adult, food consumption, overweight, physical activity
ABSTRAK
Kejadian overweight/obesitas terus meningkat di negara-negara berkembang, termasuk Indonesia, dan lebih banyak terjadi di perkotaan. Pemahaman mengenai faktor-faktor terkait overweight/obesitas penting untuk tujuan intervensi. Penelitian ini bertujuan untuk mengukur faktor-faktor yang berhubungan dengan overweight/obesitas di perkotaan Indonesia. Penelitian cross-sectional ini melibatkan pengumpulan data primer pada 864 orang dewasa usia 18-45 tahun di lima kota besar Indonesia yang meliputi pengukuran berat badan, tinggi badan, lingkar pinggang dan perut. Kategori overweight/obesitas adalah BMI>25 kg/m2. Faktor-faktor terkait overweight/obesitas diukur dengan regresi logistik. Hasil penelitian menunjukkan bahwa proporsi overweight/obesitas secara bermakna lebih tinggi pada wanita daripada pria (42,8% dan 29,2%). Median asupan energi total adalah 1974 Kkal/hari, dan median asupan lemak yang tinggi (75,3 g; 25-75 persentil: 49,6-109,4 g). Lebih dari 70 persen subyek mengkonsumsi makanan dengan energi tinggi. Hanya sekitar 27 persen subyek yang melakukan aktivitas fisik berintensitas tinggi, dan lebih dari 50 persen menonton tv/komputer >6 jam/hari, yang mengindikasikan rendahnya tingkat aktivitas fisik. Setelah dikontrol faktor perancu, subyek yang menikah berisiko overweight/obesitas 3 kali lebih tinggi daripada mereka yang tidak menikah. Konsumsi makanan dengan energi tinggi secara konsisten berhubungan dengan overweight/obesitas, meskipun tidak bermakna. Pria yang duduk lama/tidak beraktivitas (yaitu menonton tv atau menggunakan komputer >6 jam/hari), dan wanita yang jarang melakukan aktivitas fisik berintensitas tinggi, berisiko mengalami overweight/obesitas 1,4 dan 3 kali lebih besar. Maka, pencegahan overweight/obesitas perlu difokuskan pada penurunan konsumsi makanan berenergi tinggi, termasuk asupan lemak; didukung dengan peningkatan aktivitas fisik, terutama yang berintensitas tinggi dan mengurangi menonton tv/komputer, terutama pada orang dewasa perkotaan yang menikah. [Penel Gizi Makan 2015, 38(2):95-110]
INTRODUCTION
n the last two decades, a shift in disease incidence from the mainly communicable to non-communicable diseases has been observed1. It is believed that the shift has been affected by demographic and epidemiologic as well as nutritional transition. Nutritional transition, which was marked by changes in dietary pattern, coupled with the changes in physical activity patterns, has shifted the subsequent nutritional disorders from the mainly deficiency disorders to the data availability and data quality, several reviews have noted that oveweight and obesity is increasing at an alarming rate in developing countries both among adults and among the younger groups, being more prevalent in urban than rural areas5,6.
The situation in Indonesia is somewhat similar. According to the 2013 Riset Kesehatan Dasar, the prevalence of overweight and obesity combined (BMI >25 kg/m2) in Indonesia has reached 32.9 percent and 19.7 percent for women and men, respectively7; which had markedly increased from what was reported in 2007 (14.8% in women and 13.9% in men)8. Not only that the prevalence has increased, the problem, which was initially considered as the problem of the well-to-do family, has shifted to lower socioeconomic (SES) segment of population9. Study conducted by Khusun in low socioeconomic status have limited resources to access treatment for degenerative diseases.
Factors associated with the increasing trend remains need to be explored. Studies have shown that determinants of overweight and obesity are multi-factorial, and the factors might play as a single factor or in combination with other factors. However, the most direct factors related to overweight and obesity are food intake and physical activity10.
In relation to food intake, while total energy intake has been postulated as cause of overweight and obesity11,12, more attention has been given towards the food, food groups and dietary habits associated with increased energy intake12. Thus, it suggests that dietary
hypothesis as determinant of overweight and obesity has moved from merely about total energy intake into a wider consumption issues. For Indonesia, a study on determinant of obesity in Indonesia using panel data from 1993-2007 showed that changes in food consumption has been associated with obesity13. Nonetheless, it was still unclear which specific food has been associated with overweight/obesity. Understanding food or food groups associated with obesity will provide a more straightforward information for intervention.
In Indonesia published dietary studies, especially about type of food linked to overweight and obesity was limited. This study is intended to assess factors associated with overweight and obesity among adult Indonesians residing in major cities of Indonesia, especially on food consumption and physical activity level.
METHOD
This was a cross-sectional study, conducting primary data collection in major urban areas, i.e capital city of five provinces with high number of population in Indonesia based on the 2014 data of Central Bureau of Statistics14. The cities were East Jakarta (DKI Jakarta), Surabaya (East Java), Bandung (West Java), Medan (West Sumatera) and Makasar (East Sumatera). The survey was intentionally conducted in urban area, since overweight and obesity prevalence was much higher among urban population5,6 and changes in dietary pattern usually starts from urban area2. Data collection was conducted from December 2014-January 2015.
Subjects included in the survey were Indonesian men and women aged between 18 and 45, living in the selected household at least six months before the interview. Pregnant/ lactating women and subjects with diet restriction (eg. people with illness or in recovery period of illness that influence his/her consumption) were excluded from the study. Sample size and sampling procedure
The sample size was calculated to estimate calorie intake among adult population in Indonesia and their physical activity level. Regarding the calorie intake, the following formula was used to calculate the sample size15.
x DEFF
Figure 1
Flow of the Sampling Procedure at Community Level
The formula above provided the sample size needed under the requirement of population mean interval estimate at (1 − α) confidence level, margin of error E, population variance σ2 and design effect of DEFF. Here, zα∕2 was the 100(1 − α∕2) percentile of the standard normal distribution. In this study margin of error of 5 from the mean was used.
Regarding the proportion of adult having consumption of sweet food more than once per day 1 and the physical activity level, the following formula was used to calculate the sample size15:
n = 1.96²p (1-p) (DEFF) d2
The formula provided the sample size needed with desired level of relative precision or margin of error of d at 95% confidence level with correction for design effect of DEFF as the sampling procedure is not simple random sampling. In this study, margin of error used was relative precision of 10% for proportion of adult consuming more than once sweet food per day and adult having “active” physical activity level, while for sedentary behavior an absolute precision of 5% was used.
Based on the above formula and several references7,16,17, a minimum of 829 sample was
needed in order to answer objectives of this study, with 95% confidence interval, 10% relative precision design effect of 2 and allowing for 10% drop out during data collection. This study managed to include 867 subjects.
Sampling was done using cluster method, with kelurahan as the cluster. Total of 31 clusters were selected using proportionate-to-population size/PPS method. With PPS method, cities with higher number of population had more clusters selected for this survey compared with cities with lower number of population. In each cluster 27-28 households were visited. Selection of household for interview was done using multistage random sampling, in which 4-5 Rukun Warga/RW were randomly selected in each kelurahan. Then, 1 Rukun Tetangga/RT was randomly selected from each RW. As many as 6-8 households were selected in each RT. Flow of sampling procedure were given in Figure 1.
Survey team visited the selected household and in each household, before conducting interview, interviewer filled in household roster form to list all eligible household members aged 18-45 years, and then randomly selected one household member out of all eligible members in the respective
Random selection method PPS method
Randomly selec HH in each RT (List of HH will be obtained from Head of selected RT
Random selection method
List of kelurahan name and number of population in each kelurahan at the 5 cities
List of selected 31 kelurahan
List of selected RWs in each kelurahan (4-5 RWs in each kelurahan)
List of selected RT in each RW (1 RT in each RW)
List of selected household in each RT (6-8 HH in each RT or 27-28 HH in each
household. In a situation when the selected respondents was performed to obtain socio-demographic characteristics, reproductive history, dietary intake as well as physical activity. All of these variables were the independent variables for the analysis, while the dependent variable was overweight status.
Sociodemographic characteristics included age, marrital status, education level, household regularity of income and wealth quintile. Wealth index was constructed from data about housing condition and ownership of items using methodology described in RISKESDAS 20137. The wealth index was then divided into quintiles, with lowest wealth quintile represented the poorest. Reproductive history was collected for women and included data on pregnancy experience and usage of contraceptives.
Dietary intake was assessed using the 24 hours dietary recall and food frequency questionnaire (FFQ). The 24-hour recall was conducted to estimate average Energy intake for the population, including from carbohydrate, protein and fat. Moreover, energy adequacy as also calculated by comparing with the 2013 Indonesian RDA for men and women with the specific age18, and categorized into three, i.e < 70 percent adequacy, 70-120 percent adequacy and >120 percent adequacy (RefL SDT). From the 24-hour recall, dietary diversity score (DDS) was calculated based on consumption of 8 food groups in the preceding days, including staple, meat, fish, egg, milk, vegetable, fruit and sweets, modified from calculation of DDS based on guidelines from Food and Agriculture Organization19. Considering that the median DDS was 4 food groups, the score was categorized into ≥ 4 food groups and < 4 food groups.
Meanwhile, frequency of consumption of several types of food was assessed using FFQ.The FFQ approach asked respondents to report their usual frequency of consumption of each food from a list of foods for period of the preceding 30 days. Information is collected on frequency of consumption in a day, a week or a month. The frequency of consumption was then grouped as often, i.e. frequency of consumption
of certain food/food groups of ≥ 12 times per month, less frequent, i.e frequency of consumption less than 13 times per month. The classification was done based on the assumption that consumption of less than 3 times per week in average was considered as less frequent.
Physical activity level was assessed using the long, 7-day recall of the International Physical Activity Questionnaire (IPAQ) developed by WHO (www.ipaq.ki.se). This questionnaire assesses walking and moderate and vigorous intensity physical activity profiles in three settings (or domains), i.e. activity at work and at home, travel to and from places, and recreational activities, and also assesses sedentary behavior. Prior to data collection some cultural adaptation of the questionnaire was conducted by providing examples which was relevant to the study settings. The physical activities listed were those done for the past 7 days, with minimally 10 minutes of each activity. Scoring and categorization of physical activity was conducted based on the IPAQ Scoring protocol20.
Anthropometric assessments included body weight (using calibrated weighing scale (SECA), body height measurement (using stadiometer) and waist and hip circumference (using standard measuring tape) was assessed with a standardized procedure21. To avoid diurnal variation in anthropometric assessment, measurement will be conducted at the same time of the day or close to it (±2 hours) whenever possible. Body mass index (BMI) and Waist to Hip Ratio (WHR) of subjects was calculated to determine the nutritional status
and abdominal over-fatness.
Overweight/obesity was defined as BMI ≥25 kg/m2, so it included both overweight and obesity combined4; while for abdominal obesity, it was categorized as at risk for CVD if WHR>0.8 for men and >0.9 for women22.
Ethical clearance to conduct the study was obtained from Ethical Committee Faculty of Medicine, University of Indonesia, No 793/UN2.F1/ETIK/2014. Permission has obtained from the local authority health office (suku dinas kesehatan), district/municipality office (kecamatan/kelurahan) and Puskesmas. Informed consent were sought prior to data collection and data for each subject was treated confidentially. distributed data) and median (25-75th percentile) (for not-normally distributed data). Comparison of macronutrient intakes between sex was assessed using Mann-Whitney test since the intake data was not normally distributed. To determine factors associated with overweight/obesity, first bivariate analysis was conducted using simple logistic regression. Variables with was associated with overweight with p-value ≤ 0.2 was entered into multivariate logistic regression to associate dietary data as well as physical activity level to obesity, while also controlling for other possible confounding variables. P<0.05 was set as level of significancy. Because the main objective of the multivariate analysis was to identify factors associated with overweight, especially dietary and physical activity factors, while also controlled for all possible confounding, the multivariate logistic regression used enter method. There is no attempt to develop prediction model in this analysis, however how much of the variation in overweight/obesity among subjects can be explained by the
variables used in the model was seen from the Negelkerke R2.
RESULTS
Socio-demographic characteristics and physical activity
Based on socio-demographic
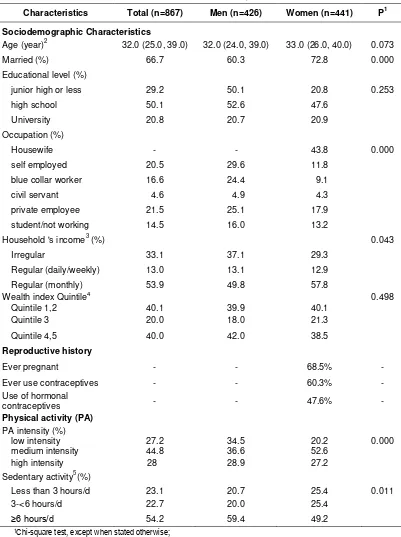
characteristics, Table 1 shows that mean age of subjects were 32 years and around 70 percent had at least high school education. No statistically significant different was found on age, education level, and wealth index between men and women. However, a significantly higher proportion of women than men were married (72.8% vs 60.3%, p=0.000). Occupation was generally different between men and women. Around 43.8 percent of women were housewife, while among men the three most common occupation were self-employed, blue collar worker and private employee. Among female, 68.5 percent had been pregnant and 46.7 percent use hormonal contraceptives during interview.
Table 1
Socio-Demographic Characteristics, Physical Activity and Nutritional Status among Men and Women Aged 18-45 Years in Major Urban Areas of Indonesia
Characteristics Total (n=867) Men (n=426) Women (n=441) P1
Sociodemographic Characteristics
Age (year)2 32.0 (25.0, 39.0) 32.0 (24.0, 39.0) 33.0 (26.0, 40.0) 0.073
Married (%) 66.7 60.3 72.8 0.000
Educational level (%)
junior high or less 29.2 50.1 20.8 0.253
high school 50.1 52.6 47.6
University 20.8 20.7 20.9
Occupation (%)
Housewife - - 43.8 0.000
self employed 20.5 29.6 11.8
blue collar worker 16.6 24.4 9.1
civil servant 4.6 4.9 4.3
private employee 21.5 25.1 17.9
student/not working 14.5 16.0 13.2
Household 's income3 (%) 0.043
Irregular 33.1 37.1 29.3
Regular (daily/weekly) 13.0 13.1 12.9
Regular (monthly) 53.9 49.8 57.8
Wealth index Quintile4 0.498
Quintile 1,2 40.1 39.9 40.1
Quintile 3 20.0 18.0 21.3
Quintile 4,5 40.0 42.0 38.5
Reproductive history
Ever pregnant - - 68.5% -
Ever use contraceptives - - 60.3% -
Use of hormonal
contraceptives - - 47.6% -
Physical activity (PA)
PA intensity (%)
low intensity 27.2 34.5 20.2 0.000
medium intensity 44.8 36.6 52.6
high intensity 28 28.9 27.2
Sedentary activity5(%)
Less than 3 hours/d 23.1 20.7 25.4 0.011
3-<6 hours/d 22.7 20.0 25.4
≥6 hours/d 54.2 59.4 49.2
1Chi-square test, except when stated otherwise;
2Median (25th, 75th percentile), p-value tested by Mann-Whitney test;
3Household income regularity was defined as having regular income as salary weekly or monthly;
4Wealth index was developed from housing condition and household ownership of electronic items and transportation
Note: *p<0.05 (Chi square test); WHR cut-off: >0.8 for men and >0.9 for women
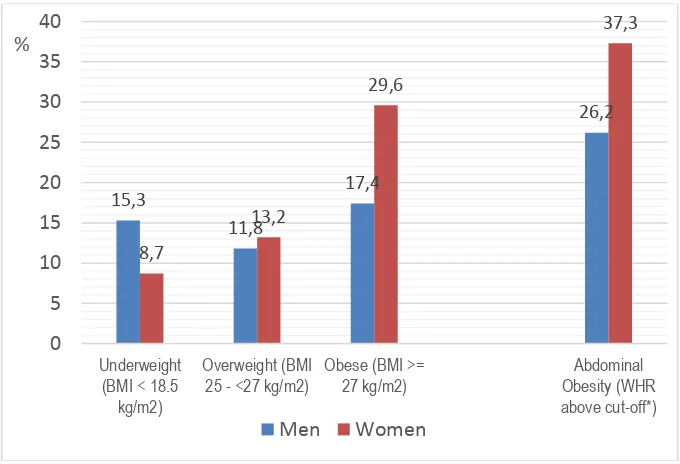
Figure 2
Nutritional Status of Men and Women Aged 18-45 Years in Major Urban Areas of Indoneisa
Energy intake and food consumption
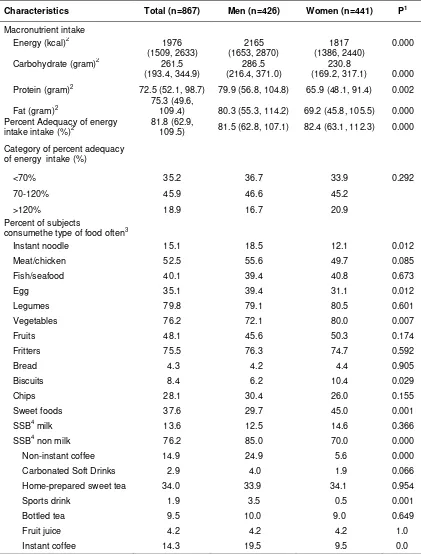
In term of actual intake, men had significantly higher intake of energy, carbohydrate, protein and fat compared to those of the women’s (Table 2). Nevertheless, when the intake was compared towards the Indonesian RDA, proportion of subjects with less energy intake (<70% RDA), moderate energy intake (70-120% RDA) and excess energy intake (>120% RDA) was not significantly different. Men significantly consumed instant noodle, egg, and sugar sweetened beverages (SSB) non milk (particularly coffee) more often than women. Moreover, significantly less men who frequently consumed vegetables, biscuits, and sweet foods. ‘Often consumption’ refers to consumption of ≥13 times a month.
Two of food groups which was known to have high energy density, i.e. fritters and SSB, were consumed a lot in the population. Overall, 74.7 percent of the study subjects consumed fritters often (i.e. at least more than three times a week) and 70 percent consumed SSB often. Of those consuming SSB non-milk, majority of the type of SSB non-milk consumed were sweetened tea, where 34.1 percent of the subjects consumed this type of SSB often. Bottled tea and instant coffee were consumed often by around 9 percent of the subjects, while
other type of SSB non-milk including juice, fruit flavoured drinks, carbonated soft drinks, hawker ice, isotonic drinks/sport drinks and energy drinks was consumed often only by less than 5 percent of the subject.
Factors associated with obesity
Table 3 and 4 show the association of several variables, including socio-demographic, diet-related and physical activity variables with overweight/obesity among men and women separately, as the pattern of overweight/obesity among men and women was very different. Overweight/obesity refers to BMI>25 kg/m2. Thus, the dependent variables included both overweight and obesity combined. For diet variables, only frequency of consumption taken from FFQ was used. For physical activity, physical activity level based on IPAQ criteria was not related to obesity. Therefore, number of days performing vigourous activity and sedentary activity indicated by duration of TV/computer usage was used as indicator. The table shows bivariate associations between each variable and overweight/obesity as well as the multivariate logistics regression result. Parameters shown in the table were the Odds Ratio (OR), i.e. the exponentiated values of the β, with its corresponding confidence interval (CI) and p-values.
15,3
11,8
17,4
26,2
8,7
13,2
29,6
37,3
0
5
10
15
20
25
30
35
40
Underweight (BMI < 18.5
kg/m2)
Overweight (BMI 25 - <27 kg/m2)
Obese (BMI >= 27 kg/m2)
Abdominal Obesity (WHR above cut-off*)
%
Table 2
Macronutrient Intake and Food Group Consumption among Men and Women Aged 18-45Years in Major Urban Areas of Indonesia
Characteristics Total (n=867) Men (n=426) Women (n=441) P1
Macronutrient intake
Energy (kcal)2 1976
(1509, 2633)
2165 (1653, 2870)
1817 (1386, 2440)
0.000
Carbohydrate (gram)2 261.5
(193.4, 344.9)
286.5 (216.4, 371.0)
230.8
(169.2, 317.1) 0.000
Protein (gram)2 72.5 (52.1, 98.7) 79.9 (56.8, 104.8) 65.9 (48.1, 91.4) 0.002
Fat (gram)2
75.3 (49.6,
109.4) 80.3 (55.3, 114.2) 69.2 (45.8, 105.5) 0.000 Percent Adequacy of energy
intake intake (%)2
81.8 (62.9,
109.5) 81.5 (62.8, 107.1) 82.4 (63.1, 112.3) 0.000
Category of percent adequacy
of energy intake (%)
<70% 35.2 36.7 33.9 0.292
70-120% 45.9 46.6 45.2
>120% 18.9 16.7 20.9
Percent of subjects
consumethe type of food often3
Instant noodle 15.1 18.5 12.1 0.012
Meat/chicken 52.5 55.6 49.7 0.085
Fish/seafood 40.1 39.4 40.8 0.673
Egg 35.1 39.4 31.1 0.012
Legumes 79.8 79.1 80.5 0.601
Vegetables 76.2 72.1 80.0 0.007
Fruits 48.1 45.6 50.3 0.174
Fritters 75.5 76.3 74.7 0.592
Bread 4.3 4.2 4.4 0.905
Biscuits 8.4 6.2 10.4 0.029
Chips 28.1 30.4 26.0 0.155
Sweet foods 37.6 29.7 45.0 0.001
SSB4 milk 13.6 12.5 14.6 0.366
SSB4 non milk 76.2 85.0 70.0 0.000
Non-instant coffee 14.9 24.9 5.6 0.000
Carbonated Soft Drinks 2.9 4.0 1.9 0.066
Home-prepared sweet tea 34.0 33.9 34.1 0.954
Sports drink 1.9 3.5 0.5 0.001
Bottled tea 9.5 10.0 9.0 0.649
Fruit juice 4.2 4.2 4.2 1.0
Instant coffee 14.3 19.5 9.5 0.0
1Chi-square test, except when stated otherwise;
2Median (25th, 75th percentile), p-values tested by Mann-Whitney Test;
Table 3
Bivariate and Multivariate Result of Factors Associated with Overweight/Obesity among Men Aged 18-45 Years in Major Urban Areas of Indonesia
Variable
Overweight/Obesity: 0=No, 1=Yes
Bivariate Multivariate*
N OR (95% CI) p OR (95% CI) p
Sociodemographic Background
Age group
18-35 268 1 1
36-45 157 1.92 (1.16 - 3.19) 0.01 1.10 (0.59 - 2.05) 0.76
Marital Status
Never married 160 1 1
Ever Married 265 3.05 (1.64 - 5.67) <0.001 3.26 (1.53 - 6.92) 0.002
Education Level
Junior High School or less 70 1 1
Senior High School 223 1.2 (0.63-2.42) 0.528 1.55 (0.75 - 3.21) 0.233
University 88 3.16 (1.54-6.49) 0.002 3.27 (1.34 - 7.97) 0.009
Wealth quintile
Low 157 1 1
Medium 128 1.27 (0.66 - 2.45) 0.473 1.15 (0.57 - 2.33) 0.690
High 138 1.88 (1.02 - 3.45) 0.043 1.21 (0.57 - 2.58) 0.622
Food Consumption
Consumption of Noodles
Less Frequent 27 1 1
Often 398 2.12 (0.89 - 5.04) 0.09 2.38 (0.90 - 6.29) 0.079
Consumption of Chips
Less Frequent 299 1 1
Often 126 1.57 (0.93 - 2.66) 0.091 1.36 (0.76 - 2.41) 0.297
Consumption of sweet food
Less Frequent 297 1 1
Often 128 0.64 (0.36 - 1.16) 0.143 0.58 (0.31 - 1.08) 0.088
consumption of sweetend tea
Less Frequent 142 1 1
Often 283 1.56 (0.93 - 2.61) 0.104 1.58 (0.91 - 2.77) 0.105
Dietary Diversity Score
<4 groups 138 1.64 (0.98 - 2.75) 0.058 1.66 (0.95 - 2.89) 0.073
>= 4 groups 287 1 1
Physical activity
Using TV computer
<6 hours 351 1 1
>= 6 hours 74 1.54 (0.84 - 2.84) 0.178 1.39 (0.71 - 2.73) 0.337
Table 4
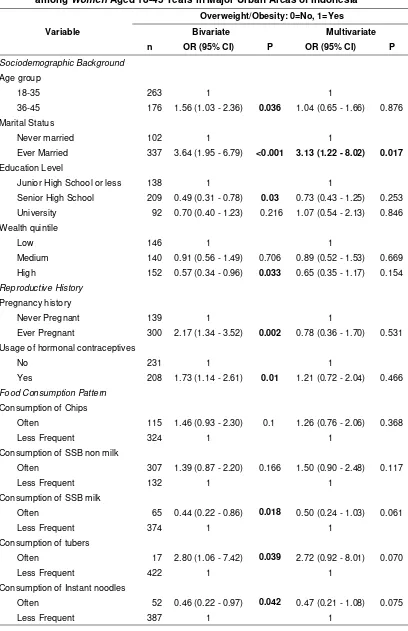
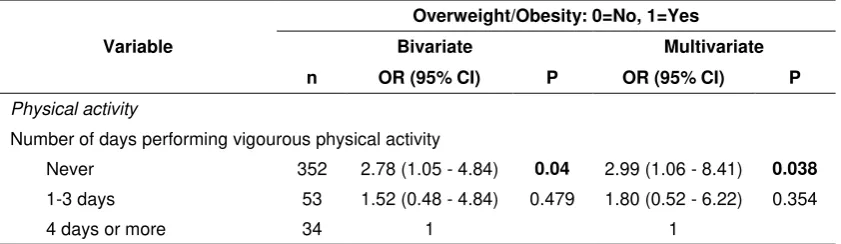
Bivariate and Multivariate Result of Factors Associated with Overweight/Obesity among Women Aged 18-45 Years in Major Urban Areas of Indonesia
Variable
Overweight/Obesity: 0=No, 1=Yes
Bivariate Multivariate
n OR (95% CI) P OR (95% CI) P
Sociodemographic Background
Age group
18-35 263 1 1
36-45 176 1.56 (1.03 - 2.36) 0.036 1.04 (0.65 - 1.66) 0.876
Marital Status
Never married 102 1 1
Ever Married 337 3.64 (1.95 - 6.79) <0.001 3.13 (1.22 - 8.02) 0.017
Education Level
Junior High School or less 138 1 1
Senior High School 209 0.49 (0.31 - 0.78) 0.03 0.73 (0.43 - 1.25) 0.253
University 92 0.70 (0.40 - 1.23) 0.216 1.07 (0.54 - 2.13) 0.846
Wealth quintile
Low 146 1 1
Medium 140 0.91 (0.56 - 1.49) 0.706 0.89 (0.52 - 1.53) 0.669
High 152 0.57 (0.34 - 0.96) 0.033 0.65 (0.35 - 1.17) 0.154
Reproductive History
Pregnancy history
Never Pregnant 139 1 1
Ever Pregnant 300 2.17 (1.34 - 3.52) 0.002 0.78 (0.36 - 1.70) 0.531
Usage of hormonal contraceptives
No 231 1 1
Yes 208 1.73 (1.14 - 2.61) 0.01 1.21 (0.72 - 2.04) 0.466
Food Consumption Pattern
Consumption of Chips
Often 115 1.46 (0.93 - 2.30) 0.1 1.26 (0.76 - 2.06) 0.368
Less Frequent 324 1 1
Consumption of SSB non milk
Often 307 1.39 (0.87 - 2.20) 0.166 1.50 (0.90 - 2.48) 0.117
Less Frequent 132 1 1
Consumption of SSB milk
Often 65 0.44 (0.22 - 0.86) 0.018 0.50 (0.24 - 1.03) 0.061
Less Frequent 374 1 1
Consumption of tubers
Often 17 2.80 (1.06 - 7.42) 0.039 2.72 (0.92 - 8.01) 0.070
Less Frequent 422 1 1
Consumption of Instant noodles
Often 52 0.46 (0.22 - 0.97) 0.042 0.47 (0.21 - 1.08) 0.075
Variable
Overweight/Obesity: 0=No, 1=Yes
Bivariate Multivariate
n OR (95% CI) P OR (95% CI) P
Physical activity
Number of days performing vigourous physical activity
Never 352 2.78 (1.05 - 4.84) 0.04 2.99 (1.06 - 8.41) 0.038
1-3 days 53 1.52 (0.48 - 4.84) 0.479 1.80 (0.52 - 6.22) 0.354
4 days or more 34 1 1
*Logistic regression analysis using enter method, Negelkerke R2=0.119
Table 3 shows that before adjustment, risk of overweight/obesity in men was significantly higher among those aged above 35 years old, married, with university education and from the highest two wealth quintile (p<0.05). None of the food groups consumption was associated significantly with overweight/obesity. However, food groups which has borderline significancy (p<0.1) to be associated with higher risk of overweight/obesity were noodles and chips. Consumption of sweetened tea showed tendency of association with overweight/obesity with p<0.2 and was included in the multivariate analysis, and so did the consumption of sweet foods, although the tendency was toward lower risk of overweight/obesity. Overweight/obesity risk was also higher among those with higher dietary diversity score. In terms of physical activity in men, only sedentary activity indicated by longer hours of TV/computer usage showed
tendency to be associated with
overweight/obesity with p<0.2 and thus included in the multivariate analysis. After adjustment for all variables in multivariate analysis, only marrital status and education level were associated with overweight/obesity among men, all other variables showed no significant association. Ever married men had 3.26 (CI: 1.53 – 6.92) times higher odds to be overweight/obese than the non married one; while men with university education also had 3.27 (CI: 1.34 – 7.97) times higher odds to be overweight/obese than those with junior high school education or less.
However, consumption of noodles among men still showed strong Odds Ratio (2.38; CI: 0.90 – 6.29), but with borderline significant (p<0.1). The same was shown for the association between dietary diversity score and overweight/obesity among men, whereas men with lower DDS had 1.67 times higher odds to be overweight/obese than men with higher DDS.
Among women, bivariate analysis in Table 4 shows that risk of overweight/obesity was
consumption of cereals, SSB milk and instant noddles “often” showed a tendency to be associated with lower risk of obesity (p<0.1), while consumption of tubers was associated with higher risk of obesity, even after adjustment for SES variables.
DISCUSSION
This study showed that the proportion of overweight and obesity combined (BMI>25 kg/m2) among adult Indonesian in five major urban cities being surveyed (Bandung, Jakarta, Surabaya, Medan and Makassar) were 29.2 percent and 42.8 percent for men and women, respectively. This proportion was much higher than the national prevalence reported by the Riskesdas 2013, i.e. 19.7 percent for men and 32.9 percent for women7. The same applies for abdominal obesity. However, the proportion of overweight/obesity found in this survey were still lower than the proportion found in studies in the urban slum Jakarta, where the proportion of overweight and obesity combined reached almost 80 percent16,23. Many studies have shown that in developing countries urban residents have a higher prevalence of obesity compared to rural residents24,25. The difference is marked in many developing countries, even when the population is compared at the same socioeconomic level26,27. This different prevalence may be related to differences in the characteristics of urban and rural areas. In many societies, urban areas are the place where modernisation initially took place before reaching rural areas28. As a result, there are typical differences between urban and rural areas, which include population size, density and heterogeneity, different access to education, employment and health services as well as alteration in the social and built environment29. In this study, it was noted that the educational level of the subjects was higher than the general Indonesian population30.
The study population generally had very high sedentary activities, with those performing sedentary activity (as indicated by TV/computer watching) more than 6 hours a day were more than 50 percent, which was double the proportion of those with sedentary activity more than 6 hours from RISKESDAS 20137. This may be related to the higher urbanicity of the surveyed area compared to RISKESDAS 2013 and higher education level which lead to more sedentary occupational physical activities. High sedentary activities leads to low physical activity level and low energy expenditure, as was shown by a review on the relationship between television viewing, physical inactivity and obesity31. As much as 27 percent of the
study population had low intensity physical activity level with men had higher prevalence (>30%) than women (20%), similar to the findings from RISKESDAS 2013, whereas as much as 26.1 percent of the Indonesian population had low intensity physical activity level7. Majority of the women was housewife, and thus generally considered having medium intensity physical activity level since many of the household chores fall under the criteria for medium physical activity. However, for both men and women, the prevalence of those performing high intensity physical activity level was only 27%, which was correlated well with the high sedentary activity of this population.
Considering that overweight/obesity was much higher among women in this study, thus women was more at risk for under reporting energy and fat intake than men, leading to underestimation of their real energy intake. Third, the possibility of reverse causality may be present. Overweight/obese individual may have changed their dietary habit already at the time of survey. Since the survey is cross sectional, it can not ensured whether current dietary habit was related to their nutritional status or their nutritional status was the result of their dietary habit. Thus, a significant and meaningful association between dietary intake and overweight/obesity can not be established.
The same explanation applies for the association between physical activity level and overweight/obesity. Moreover, methodological difficulties in reliably estimating physical activity level has been the drawback in many studies35. The level of physical activity as measured by IPAQ in the study population also showed a monotonous pattern, with median physical activity level for most domain of 0 MET-minutes/week, indicating a very sedentary behaviour, especially among women. Therefore effort was made to find specific physical activity aspects that was associated with obesity. The analysis showed that for men, those with longer TV/computer viewing/usage duration tended to be more obese than those with shorter duration. This result was consistent with other studies which showed that increased TV-viewing time in a household had been positively correlated with obesity31. Meanwhile among women, because their physical activity was more sedentary than men, aspect of physical activity which was correlated with obesity was vigourous physical activity. Women with more frequency of vigourous physical activity in a week, had significantly lower risk for obesity than those without vigourous physical activity. This different domain of leisure time physical activity aspect among men and women provides important insight for specific messages to be delivered for each groups to increase their physical activities.
In terms of food intake, several food groups showed association during bivariate analysis but lost the signficiancy during multivariate analysis. This could mean that the differences in the food groups consumption was actually associated with other variables, such as age and SES level. Therefore when it was inlcuded in the regression analysis with these variables, the association lost their signficancy. Consumption of high energy dense food such as chips and sugar sweetened beverages (SSB), consistenly showed
association, although not signficant, with overweight/obesity. This result confirmed what has been found by other studies36,37. Thus, the importance of these high energy dense food in developement of obesity can not be just ignored. More studies need to be conducted to reveal the role of these high energy dense food on obesity.
On the contrary, some processed food such as sweet food, SSB milk and Instant noodles was associated with lower obesity. This does not mean that this food was a good food to prevent obesity. Further analysis showed that these food was consumed by younger aged populations, who naturally had lower risk of obesity than the older population. The fact that younger population consumed these type of food, and lower consumption of fruit and vegetables was worrying. The habit of these young adult may be carried over when they were older, when consequences of bad eating habit such as obesity and non communicable diseases started to emerged. Thus, the mesage from this study is clear that an improvement for better eating habit for younger adult as well as older adult is necessary in this study population.
One interesting observation was that in both men and women, obesity was much higher among the married individual and the effect size was high even after adjusting for age and SES variables. This result was similar with the study of Roemling and Qaim which found that eductaion level, age and marital status was the indirect factos associated with obesity among Indonesian13. Marriage in one side may influence food habit of individual38, especially in the eastern culture like Indonesia. Married individual may have more steady food pattern, with eating at home become a more feasible option and probably more enjoyable. For women, marriage also correlated very much with pregnancy experience. In our study, pregnancy experience was strongly associated with overweight. A systematic review showed that the result of studies on pregnancy weight gain and obesity is still inconsistent39. In this study population, considering the result of our analysis, the impact of pregnancy weight gain among women can not be dismissed and need further studies to clarify this phenomena.
could be related to the possibility that the indicator used in this study could not captured all dimensions of the variables intended to be measured in this study. Thus, only small fraction of dimensions of the variables were represented by the measurement, therefore explanability could be low. Secondly, there was error in measurement during data collection. Nonetheless, some quality assurance measures had already been implemented during data collection. Error in measurement could also be related to the inability of the measurement to capture the daily variation of the variables intended to be measured, i.e. Food intake and Physical activity. Thirdly, there are other variables that were not assessed in this study which was related to obesity, such as genetic and environment factors.
CONCLUSION
This study showed that overweight/obesity was not associated with any single factor, and was generally due to multiple factors coming together, including age, marital status, food consumption and physical activity. The alarming fact was that the urban population being surveyed had a higherfat intake as compared tothe general Indonesian population and consumption of high-dense energy food (i.e. fritters and sugar sweetened beverages, especially home-prepared coffee and tea) were very frequent. At the same time, the intensity of physical activity was considered low. Therefore it is quintessential to prioritize the balance of energy intake and physical activity foroverweight/obesity prevention.
The study also provided a clear message that for overweight/obesity prevention it is important to reduce consumption of high energy dense food, to increase vigorous physical actvities and reduce sedentary activities, especially among older married adult population. These messages supported the messages from the Indonesian Pola Hidup Bersih dan Sehat (PHBS= Clean and Healthy Lifestyle Pattern).
There was an urgent need to explore the effect of food intake, including intake of high dense energy food on overweight/obesity using method which can avoid reverse causality, such as using cohort study. Furthermore, the different food consumption pattern between the younger and older individual will also need further exploration in relation to overweight/obesity.
ACKNOWLEDGEMENT
We acknowledge the financial support from PT. Coca-CoIa Indonesia in making this study possible.
REFERENCES
1. Lozano R, Naghavi M, Lim S, Shibuya K, Aboyans V, Abraham J, et al. Global and regional mortality from 235 causes of death for 20 age groups in 1990 and 2010: a systematic analysis for the global burden of disease study 2010. Lancet. 2013; 380: 2095-2128.
2. PopkinBM. The nutrition transition: an overview of world patterns of change. Nutr Rev. 2004; 62:S140-3.
3. PopkinBM and Gordon-Larsen P. The nutrition transition: worldwide obesity dynamics and their determinants. Int J
Obes Relat Metab Disord. 2004; 28:S2-9.
4. World Health Organization. Obesity and overweight [cited July 16, 2015]. Available from: http://www.who.int/mediacentre/ factsheets/fs311/en/.
5. Prentice AM. The emerging epidemic of obesity in developing countries. Int J
Epidemiol. 2006; 35:93-9.
6. Asia Pacific Cohort Study Collaboration. The burden of overweight and obesity in the Asia-Pacific region. Obes Rev. 2007; 8:191-6.
7. Indonesia, Badan Penelitian dan Pengembangan Kesehatan, Kementrian Kesehatan RI. Laporan hasil riset kesehatan dasar Indonesia (RISKESDAS)
2013. Jakarta: Badan Penelitian dan
Pengembangan Kesehatan, 2013.
8. Indonesia, Badan Penelitian dan Pengembangan Kesehatan, Kementrian Kesehatan RI. Laporan hasil riset kesehatan dasar Indonesia (RISKESDAS) 2007. Jakarta: Badan Penelitian dan Pengembangan Kesehatan, 2008.
9. Khusun H. Explaining the heterogeneity in overweight and underweight amongst adult Indonesians 1993-2007: the influence of compositional and contextual factors.Dissertation.Queensland: The University of Queensland, 2011.
Com-parative quantification of health risk: global and regional burden of disease attribution
to selected major risk factors. Geneve:
WHO Publication, 2004.
11. James WPT. The fundamental drivers of the obesity epidemic. Obes Rev. 2008;9:6-13.
12. Jebb SA. Dietary determinants of obesity.
Obes Rev, 2007. 8: p. 93-7.
13. Roemling K and Qaim M. Direct and indirect determinants of obesity: the case of Indonesia. GlobalFood discussion paper
no.4. Goettingen: Georg-August-University
RTG 1666 GlobalFood, June 2011.
14. Indonesia, Badan Pusat Statistik. Penduduk Indonesia menurut provinsi 2014 [citedNovember 2014]. Available from:http://www.bps.go.id/tab_sub/view.ph p?tabel=1&id_ subyek=12
15. Lemeshow S. Adequacy of sample size in
health studies. Geneva: WHO, 1990.
16. Yulia. Differences in food consumption
Pengembangan Kesehatan, Kementrian Kesehatan RI. Laporan hasil riset kesehatan dasar Indonesia (RISKESDAS)
2010. Jakarta: Badan Penelitian dan
Pengembangan Kesehatan, 2011.
18. Indonesia, Kementrian Kesehatan. Permenkes tentang angka kecukupan gizi [cited September 30, 2015]. Available from:http://gizi.depkes.go.id/permenkes-tentang-angka-kecukupan-gizi
19. Food and Agriculture Organization. Guidelines for measuring household and individual dietary diversity [cited September 30, 2015]. Rome: Food and Agriculture Organization, 2010. Available from: http://www.fao.org/3/a-i1983e.pdf 20. International Physical Activity
Questionnaire (IPAQ). Guidelines for Data
Processing and Analysis of the
International Physical Activity
Questionnaire (IPAQ). [Place unknown]:
IPAQ, 2005.
21. Gibson R. Principle of nutritional
assessment. Auckland: Oxford University
Press, 2005.
22. World Health Organization. Waist circumference and wasit-hip ratio. Report
of a WHO expert consultation. Geneve:
WHO, 2011
23. Anggraini R. Association between food marketing, food choice and dietary pattern among adult women in urban slum area.
Thesis.Jakarta: Universitas Indonesia,
2015.
24. Martorell R. Obesity in the developing world.In Popkin BM and Caballero B, editors.Nutrition transition: diet and
disease in the developing world.
Amsterdam: Academic press, 2002.
25. Mendez MA and Popkin BM.
Globalization, urbanization and nutritional
change in the developing
world.ElectronicJournal of Agricultural and
Development Economics. 2004;1:220-241.
[cited September 30, 2015]. Available from: ftp://ftp.fao.org/docrep/fao/007/ ae225e/ae225e00.pdf
26. Arambepola C. Urban living and obesity: is it independent of its population and lifestyle characteristics?. Trop Med Int
Health. 2008; 13:448-57.
27. Aekplakorn W. Trends in obesity and associations with education and urban or rural residence in Thailand. Obesity (Silver Spring). 2007; 15:3113-21.
28. Mendez MA, Monteiro CA and Popkin BM. Overweight exceeds underweight among women in most developing countries. Am
J Clin Nutr. 2005; 81:714-21.
29. Vlahov D and Galea S. Urbanization, urbanicity, and health. J Urban Health. 2002; 79:S1-S12.
30. Indonesia, Badan Pusat Statistik. Jumlah penduduk Indonesia berdasarkan tingkat
pendidikan dan jenis kelamin [cited July Television viewing, physical inactivity and obesity.International Journal of Obesity
and Related Metabolic Disorders.1999;
23:437-440
32. Indonesia, Badan Penelitian dan Pengembangan Kesehatan, Kementrian Kesehatan RI. Laporan hasil survei diet
total (SDT) 2014. Jakarta: Badan
Penelitian dan Pengembangan
Kesehatan, 2014. intake biomarkers to evaluate the extent of dietary misreporting in a large sample of adults: the OPEN study. Am J Epidemiol. 2003:158:1-13. doi: 10.1093/aje/kwg092 35. Wareham N. Physical activity and obesity
36. Drewnowski A and Specter SE. Poverty and obesity: the role of energy density and energy costs. Am J Clin Nutr. 2004;79:6– 16.
37. Rosenheck R. Fast food consumption and increased caloric intake:a systematic review of a trajectorytowards weightgain and obesity risk. Obes Rev. 2008; 9:535–
547.
38. Roos E, Lahelma E, Virtanen M, Prattala R, and Pietinen P. Gender, socioeconomic status and family status as determinants of food behavior. Social Science and
Medicine. 1998; 46:1519–1529