E-S-QUAL
A Multiple-Item Scale for Assessing
Electronic Service Quality
A. Parasuraman
University of MiamiValarie A. Zeithaml
Arvind Malhotra
University of North Carolina at Chapel Hill
Using the means-end framework as a theoretical founda-tion, this article conceptualizes, constructs, refines, and tests a multiple-item scale (E-S-QUAL) for measuring the service quality delivered by Web sites on which customers shop online. Two stages of empirical data collection re-vealed that two different scales were necessary for captur-ing electronic service quality. The basic E-S-QUAL scale developed in the research is a 22-item scale of four dimen-sions: efficiency, fulfillment, system availability, and pri-vacy. The second scale, E-RecS-QUAL, is salient only to customers who had nonroutine encounters with the sites and contains 11 items in three dimensions: responsive-ness, compensation, and contact. Both scales demonstrate good psychometric properties based on findings from a variety of reliability and validity tests and build on the re-search already conducted on the topic. Directions for fur-ther research on electronic service quality are offered. Managerial implications stemming from the empirical findings about E-S-QUAL are also discussed.
Keywords: e-service quality; online stores; customer ser-vice; scale development
Although no longer believed to be the revolution previ-ously conceived, the Internet remains a critical channel for selling most goods and services. Companies such as Ama-zon distribute products and services solely through Web channels, and virtually all companies are creating Web channels as sources for prepurchase information (cars), alternative ways to buy products (retailers such as GAP, Talbot’s, and Eddie Bauer), approaches to expand services (industrial products), and ways to capture time-conscious and upscale consumers (online banking). If these channels are to be viable, they must be perceived by consumers as effective and efficient.
Even though low price and Web presence were initially thought to be the drivers of success, service quality issues soon became pivotal. When consumers could not com-plete transactions, products were not delivered on time or at all, e-mails were not answered, and desired informa-tion could not be accessed, the viability of Web channels was jeopardized. Mounting business and academic evi-dence demonstrated a widespread lack of adequate ser-vice quality delivered through the Internet (Ahmad 2002; Lennon and Harris 2002; LoCascio 2000; Pastore 2001). This problem still persists (Cox 2002; Gaudin 2003; InternetNewsBureau 2003). If Web channels are to be
The authors gratefully acknowledge research grants from the Marketing Science Institute and DellStar, without which this research could not have been conducted. They also thank three anonymous reviewers for their constructive and helpful comments.
Journal of Service Research, Volume 7, No. X, Month 2005 1-21 DOI: 10.1177/1094670504271156
accepted by consumers, companies must shift the focus of business from commerce—the transactions—to e-service—all cues and encounters that occur before, dur-ing, and after the transactions.
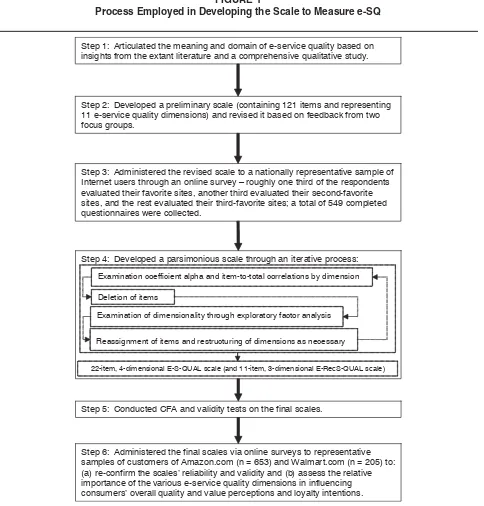
To deliver superior service quality, managers of compa-nies with Web presences must first understand how con-sumers perceive and evaluate online customer service. Although there are many different types of Internet sites, the research described in this article focuses only on online shopping sites. The article does not deal with other Inter-net sites—such as online newspapers, portals, free down-load sites, customer-to-customer sites such as eBay or Topica, sites that are collections of links, or job sites such as Monster.com—that exist for purposes other than online shopping and that are advertiser supported. The purpose of this article is to describe the development, refinement, psychometric evaluation, properties, and potential appli-cations of a multiple-item scale for measuring e-service quality (e-SQ) of sites on which customers shop online. The process that produced the scale involved a sequence of steps consistent with conventional guidelines for scale development (Churchill 1979; Gerbing and Anderson 1988). Figure 1 provides an overview of the steps.
The remainder of this article consists of five sections. The first section provides a synopsis of the extant literature on traditional SQ and e-SQ. Drawing on insights from the extant literature and a comprehensive qualitative study, the second section offers a formal definition of e-SQ and delineates its domain (Step 1 in Figure 1). The next section describes a preliminary scale, the process used in refining it through both qualitative and empirical research, and the scale’s psychometric properties (Steps 2 through 5). The fourth section discusses additional empirical research that was conducted to further assess the refined scale’s reliabil-ity and validreliabil-ity, and to explore the nature and extent of e-SQ’s impact on customers’ overall quality and value per-ceptions, as well as their loyalty intentions (Step 6). The final section offers directions for future research and dis-cusses managerial implications.
TRADITIONAL SERVICE QUALITY
VERSUS ELECTRONIC SERVICE QUALITY
Extensive research on traditional SQ has been con-ducted during the past 20 years (see Parasuraman and Zeithaml 2002 for a review). In contrast, only a limited number of scholarly articles deal directly with how cus-tomers assess e-SQ and its antecedents and consequences. In this section, we briefly overview the relevant aspects of traditional SQ and describe the reasons why that research needs to be repeated in the electronic context.
Traditional Service Quality
By traditional SQ we are referring to the quality of all non-Internet-based customer interactions and experi-ences with companies. Early scholarly writings on SQ (Grönroos 1982; Lehtinen and Lehtinen 1982; Lewis and Booms 1983; Parasuraman, Zeithaml, and Berry 1985; Sasser, Olsen, and Wyckoff 1978) suggested that SQ stems from a comparison of what customers feel a pany should offer (i.e., their expectations) with the com-pany’s actual service performance. Using insights from these studies as a starting point, Parasuraman, Zeithaml, and Berry (1988, 1991) conducted empirical studies in several industry sectors to develop and refine SERV-QUAL, a multiple-item instrument to quantify customers’ global (as opposed to transaction-specific) assessment of a company’s SQ. This scale measures SQ along five dimen-sions: reliability, responsiveness, assurance, empathy, and tangibles. The SERVQUAL instrument and its adaptations have been used for measuring SQ in many proprietary and published studies. It has also generated debate in the litera-ture about the most appropriate ways to assess SQ (Brown, Churchill, and Peter 1993; Carman 1990; Cronin and Taylor 1992; Parasuraman, Berry, and Zeithaml 1991, 1993; Parasuraman, Zeithaml, and Berry 1994a, 1994b; Teas 1993.
Three broad conclusions that are potentially relevant to defining, conceptualizing, and measuring perceived e-SQ emerge from the traditional SQ literature: (a) The notion that quality of service stems from a comparison of actual service performance with what it should or would be has broadconceptualsupport, although some still question the empiricalvalue of measuring expectations and operation-alizing SQ as a set of gap scores; (b) the five SERVQUAL dimensions of reliability, responsiveness, assurance, em-pathy, and tangibles capture the general domain of SQ fairly well, although (again from an empirical stand-point) questions remain about whether they are five dis-tinct dimensions; and (c) customer assessments of SQ are strongly linked to perceived value and behavioral intentions.
critical in increasing customer trust. However, the items in the scale were changed to adapt to the electronic context (e.g., tangibles were represented in part by an item about appearance of the Web site), and therefore the scales were not comparable across the research contexts. For this and other reasons discussed below, studying e-SQ requires scale development that extends beyond merely adapting offline scales.
Why e-SQ?
Insights from studies dealing with people-technology interactions imply that customer evaluation of new tech-nologies is a distinct process. For instance, findings from an extensive qualitative study of how customers interact with, and evaluate, technology-based products (Mick and Fournier 1995) suggest that (a) customer satisfaction with
Step 4: Developed a parsimonious scale through an iterative process:
Step 1: Articulated the meaning and domain of e-service quality based on insights from the extant literature and a comprehensive qualitative study.
Step 2: Developed a preliminary scale (containing 121 items and representing 11 e-service quality dimensions) and revised it based on feedback from two focus groups.
Step 3: Administered the revised scale to a nationally representative sample of Internet users through an online survey – roughly one third of the respondents evaluated their favorite sites, another third evaluated their second-favorite sites, and the rest evaluated their third-favorite sites; a total of 549 completed questionnaires were collected.
22-item, 4-dimensional E-S-QUAL scale (and 11-item, 3-dimensional E-RecS-QUAL scale)
Step 5: Conducted CFA and validity tests on the final scales.
Step 6: Administered the final scales via online surveys to representative samples of customers of Amazon.com (n = 653) and Walmart.com (n = 205) to: (a) re-confirm the scales’ reliability and validity and (b) assess the relative importance of the various e-service quality dimensions in influencing consumers’ overall quality and value perceptions and loyalty intentions.
Deletion of items
Reassignment of items and restructuring of dimensions as necessary Examination of dimensionality through exploratory factor analysis Examination coefficient alpha and item-to-total correlations by dimension
FIGURE 1
Process Employed in Developing the Scale to Measure e-SQ
such products involves a highly complex, meaning-laden, long-term process; (b) the process might vary across dif-ferent customer segments; and (c) satisfaction in such con-texts is not always a function of preconsumption compari-son standards. Another major qualitative study by the same authors (Mick and Fournier 1998), focusing on peo-ple’s reactions to technology, suggests that technology may trigger positive and negative feelings simultaneously. Moreover, other research involving both qualitative and empirical components demonstrates that customers’ pro-pensity to embrace new technologies (i.e., their technol-ogy readiness) depends on the relative dominance of posi-tive and negaposi-tive feelings in their overall technology beliefs (Parasuraman 2000). Earlier studies focusing on specific technologies have also shown that consumers’ beliefs about, and reactions to, the technology in question are distinct and positively correlated with acceptance (Cowles 1989; Cowles and Crosby 1990; Dabholkar 1996; Eastlick 1996). Other research shows that perceived use-fulness and ease of use are correlated significantly with self-reported (Davis 1989) and actual (Szajna 1996) usage of technology.
Collectively, the findings of these studies reveal impor-tant differences in acceptance and usage of technologies across customers depending on their technology beliefs and suggest that similar differences might exist in the eval-uative processes used in judging e-SQ. In other words, customer-specific attributes (e.g., technology readiness) might influence, for instance, the attributes that customers desire in an ideal Web site and the performance levels that would signal superior e-SQ.
Research on e-SQ
Some academic researchers have developed scales to evaluate Web sites. Loiacono, Watson, and Goodhue (2000) created WebQual, a scale for rating Web sites on 12 dimensions: informational fit to task, interaction, trust, response time, design, intuitiveness, visual appeal, inno-vativeness, flow-emotional appeal, integrated communi-cation, business processes, and substitutability. However, this scale’s primary purpose is to generate information for Web site designers rather than to measure service quality as experienced by customers. The research that produced the scale involved students visiting Web sites to evaluate them rather than actual purchasers evaluating their experi-ences. Therefore, although some WebQual dimensions might influence perceived service quality, other dimen-sions (e.g., innovativeness, business processes, and sub-stitutability) are at best tangential to it. Moreover, the scale developers excluded a dimension calledcustomer service because it could not be measured under the research
meth-odology that was used. For the same reason, WebQual does not include fulfillment as a dimension.
Barnes and Vidgen (2002) developed a completely dif-ferent scale to measure an organization’s e-commerce offering, which they also call WebQual. This scale pro-vides an index of a site’s quality (customer perceptions weighted by importance) and has five factors: usability, design, information, trust, and empathy. Data used in developing and testing the questionnaire were obtained from convenience samples of university students and staff who were directed to visit one of three bookstore sites, to collect some information about a book of their choice, and then to rate their experience on the scale items. The scale is designed to be answered without a respondent needing to complete the purchasing process and is therefore a trans-action-specific assessment of a site rather than a compre-hensive evaluation of the service quality of a site.
Yoo and Donthu (2001) developed a nine-item SITE-QUAL scale for measuring site quality on four dimen-sions: ease of use, aesthetic design, processing speed, and security. As in the case of Barnes and Vidgen’s (2002) WebQual scale, data for developing and testing SITE-QUAL were gathered from convenience samples. Specifi-cally, students enrolled in marketing classes were asked to visit and interact with three Internet shopping sites of their own choice and then evaluate each site. Like WebQual, SITEQUAL does not capture all aspects of the purchasing process and therefore does not constitute a comprehensive assessment of a site’s service quality.
Using an online survey, Szymanski and Hise (2000) studied the role that customer perceptions of online conve-nience, merchandising (product offerings and product in-formation), site design, and financial security play in e-satisfaction assessments. This study did not include aspects of customer service or fulfillment; rather, it dealt only with aspects of the Web site. Furthermore, it mea-sured satisfaction rather than service quality.
dimensions—security/privacy and reliability/fulfillment— show strong face validity and are highly descriptive of the items they represent, the other two dimensions appear less internally consistent and distinct. Web site design, for example, embraces aspects of in-depth information, level of personalization, selection, and speed of completing transactions. The factor called customer service contains items relating to the company’s willingness to respond to customer needs, the company’s interest in solving prob-lems, and the promptness with which inquiries are answered. These dimensions, as well as other items that might be relevant to customer assessment of service qual-ity on Web sites, need to be tested further.
Thus, although past studies provide insights about cri-teria that are relevant for evaluating e-SQ, the scales devel-oped in those studies also raise some important questions that call for additional research on the topic. On the basis of a comprehensive review and synthesis of the extant lit-erature on e-SQ, Zeithaml, Parasuraman, and Malhotra (2002) detailed five broad sets of criteria as relevant to e-SQ perceptions: (a) information availability and content, (b) ease of use or usability, (c) privacy/security, (d) graphic style, and (e) reliability/fulfillment. A number of studies have examined various aspects of these criteria. Some have been hypothesized to be critical, whereas the impor-tance of others has been demonstrated empirically. Avail-ability and depth of information appear to be important because when users can control the content, order, and duration of product-relevant information, their ability to integrate, remember, and thereby use information im-proves (Ariely 2000). Ease of use appears relevant because Internet-based transactions are complex and intimidating to many customers. Privacy (the protection of personal information) and security (the protection of users from the risk of fraud and financial loss) have been shown empiri-cally to have a strong impact on attitude toward use of online financial services (e.g., Montoya-Weiss et al. 2003). Graphic style—which embodies such issues as color, layout, print size and type, number of photographs and graphics, and animation—has also been shown to affect customer perceptions of online shopping (Hoffman and Novak 1996; Hoque and Lohse 1999; Schlosser and Kanfer 1999). Finally, reliability/fulfillment has been cited as an important facet of e-SQ (Palmer, Bailey, and Faraj 1999; Wolfinbarger and Gilly 2003). In fact, Wolfinbarger and Gilly (2003) found that reliability/ fulfillment ratings were the strongest predictor of cus-tomer satisfaction and quality, and the second strongest predictor of intentions to repurchase at a site.
Insights from the research on e-SQ reviewed above and a comprehensive conceptual study of the nature and struc-ture of e-SQ (Zeithaml, Parasuraman, and Malhotra 2000) formed the starting point for developing the e-SQ scale
that is the focus of this article. The following sections describe in detail the various scale-development steps out-lined in Figure 1.
DEVELOPMENT AND REFINEMENT OF A SCALE TO MEASURE e-SQ
Definition and Domain of e-SQ
The extant literature and extensive focus group re-search in Zeithaml, Parasuraman, and Malhotra’s (2000) study suggested that customers’assessment of a Web site’s quality includes not only experiences during their inter-actions with the site but also postinteraction service aspects (i.e., fulfillment, returns). As such, e-SQ is defined broadly to encompass all phases of a customer’s interac-tions with a Web site:The extent to which a Web site facili-tates efficient and effective shopping, purchasing, and delivery.
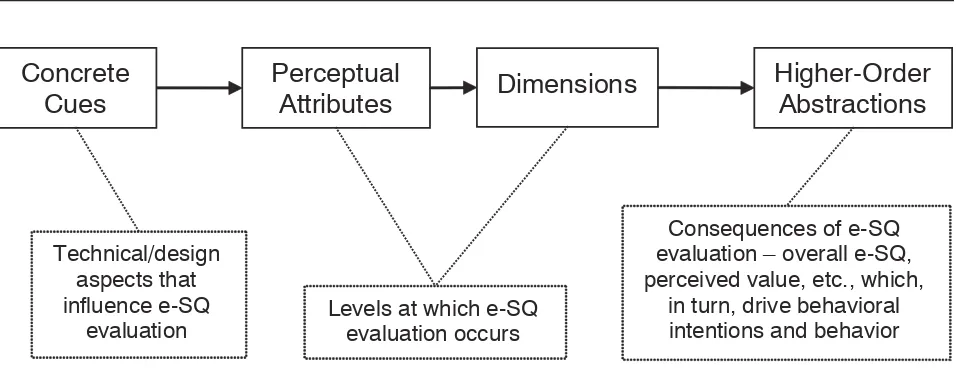
In discussing what they considered to be desirable characteristics of Web sites, the focus group participants in Zeithaml, Parasuraman, and Malhotra’s (2000) study mentioned a variety of features—ranging from specific, concrete cues (e.g., tab structuring, search engines, one-click ordering), to more general perceptual attributes (e.g., perceived ease of finding what one is looking for, per-ceived transaction speed) to broad dimensions (e.g., ease of navigation in general, responsiveness to customer needs), to higher-order abstractions (e.g., overall per-ceived quality and value). To represent the full range of evaluative criteria emerging from their focus groups, the researchers proposed a theoretical framework that is anchored in the means-end-chain approach to understand-ing consumers’ cognitive structures. This approach holds that consumers retain product information in memory at multiple levels of abstraction (Olson and Reynolds 1983; Young and Feigen 1975). The proposed framework is summarized in Figure 2.
The antecedents of e-SQ are specific concrete cues— such as one-click ordering, Trust-e symbols, and search engines—that trigger perceptual attributes. Evaluations of e-service quality along the perceptual attributes coalesce into evaluations along more abstract dimensions. The attribute- and dimension-level evaluations lead to more global assessments at higher levels of abstraction (e.g., overall assessment of e-SQ and perceived value), which in turn influence behavioral intentions and actual behavior (Zeithaml, Parasuraman, and Malhotra 2000).
evaluative process for assessing e-SQ encompasses the perceptual and dimensional levels. Concrete cues, in effect, are antecedents that influence this process, whereas the higher-order abstractions are consequences of the pro-cess. Therefore, Web site features associated with the core evaluative process—in particular, the perceptual attrib-utes—constituted the domain of items for the e-SQ scale.
The specification of perceptual-level attributes as the domain of scale items is appropriate for several additional reasons. First, perceptual attributes are more enduring evaluative aspects than are concrete cues. The reason is that although the concrete cues associated with Web sites will change as technology changes, the more abstract per-ceptual attributes triggered by those cues do not them-selves change. For example, one perceptual attribute of a Web site may be “easy to maneuver through the site”; the concrete cues that currently signal this attribute could include tab structuring, site map, search engine, layering of information, and number of clicks to get to the correct location, among others. Although these specific concrete cues will change (or be replaced by new cues) with advances in technology, the perceptual attribute “easy to maneuver through the site” will still be relevant as an evaluative criterion. Second, because concrete cues asso-ciated with Web sites are generally of a technical nature, not all customers might be aware of them or be able to assess how good they are. Perceptual attributes, by virtue of their being more experiential than technical, are more readily assessable by all customers. Moreover, perceptual attributes are more “scaleable” than are concrete cues— that is, they can be rated along a continuum; in contrast,
many concrete cues such as one-click ordering and Trust-e symbols are either present or absent. Third, compared to dimension-level assessments, perceptual-attribute ratings are more specific and can offer finer-grained insights about e-SQ shortfalls; at the same time, when dimension-level e-SQ assessments are needed, they can be obtained easily by aggregating the appropriate perceptual-attribute ratings. Fourth, the linkages implied in the theoretical framework (Figure 2) between the e-SQ evaluative pro-cess (i.e., perceptual/dimension-level assessments) and its consequences (i.e., higher-order abstractions) consti-tute a natural “nomological net” for verifying the construct validity of an e-SQ scale consisting of perceptual-attribute level items. The verification is done by empirically exam-ining the effects of perceptual-attribute level (and hence dimension-level) ratings on endogenous constructs such as perceived value and loyalty intentions (more on this later).
Zeithaml, Parasuraman, and Malhotra’s (2000) study identified dozens of Web site features at the perceptual-attribute level and categorized them into 11 e-SQ dimensions:
1. Reliability: Correct technical functioning of the site and the accuracy of service promises (having items in stock, delivering what is ordered, delivering when promised), billing, and product information.
2. Responsiveness:Quick response and the abil-ity to get help if there is a problem or question.
Concrete
Cues
Perceptual
Attributes
Dimensions
Higher-Order
Abstractions
Technical/design
aspects that
influence e-SQ
evaluation
Levels at which e-SQ
evaluation occurs
Consequences of e-SQ
evaluation – overall e-SQ,
perceived value, etc., which,
in turn, drive behavioral
intentions and behavior
FIGURE 2
A Means-End Framework for Understanding the Domain and Consequences of e-SQ
3. Access:Ability to get on the site quickly and to reach the company when needed.
4. Flexibility:Choice of ways to pay, ship, buy, search for, and return items.
5. Ease of navigation:Site contains functions that help customers find what they need without difficulty, has good search functionality, and allows the customer to maneuver easily and quickly back and forth through the pages. 6. Efficiency: Site is simple to use, structured
properly, and requires a minimum of informa-tion to be input by the customer.
7. Assurance/trust: Confidence the customer feels in dealing with the site and is due to the reputation of the site and the products or ser-vices it sells, as well as clear and truthful infor-mation presented.
8. Security/privacy: Degree to which the cus-tomer believes the site is safe from intrusion and personal information is protected. 9. Price knowledge:Extent to which the customer
can determine shipping price, total price, and comparative prices during the shopping process.
10. Site aesthetics:Appearance of the site. 11. Customization/personalization: How much
and how easily the site can be tailored to indi-vidual customers’ preferences, histories, and ways of shopping
The collection of Web site attributes pertaining to these 11 dimensions served as the e-SQ domain from which we drew items for the e-SQ scale (Table 2 in Zeithaml, Parasuraman, and Malhotra (2000, pp. 17-21) lists these attributes).
Preliminary Scale
A set of 121 items representing all facets of the e-SQ domain formed our initial scale. We incorporated this scale into two questionnaire versions with different scale anchors and formats. We then evaluated the alternative versions in two focus group interviews with graduate stu-dents at a major university in the eastern United States.
The specific goals of the focus groups were to (a) understand respondents’ reactions to alternative ways of phrasing scale items and anchors (Likert-type scale versus low-high performance anchors); (b) reword items to improve clarity; (c) eliminate redundant items; and (d) obtain feedback on the length, format, and clarity of the instructions and initial questionnaire draft. On the basis of insights from the focus groups, we simplified the direc-tions, eliminated some confusing items, reworded some others, and chose a Likert-type scale format for collecting responses. The revised questionnaire had 113 items with
5-point scales ranging from 1 (strongly disagree) to 5 (strongly agree).
Sample Design and Data Collection
In the next stage of the scale-development process we hired a marketing research firm to administer the revised questionnaire to a random sample of Internet users through an online survey. The research firm contacted potential respondents and screened them to determine if they had sufficient online shopping experience (specified as having used the Internet at least 12 times during the past 3 months and made at least three purchases within that period). Qualified respondents were asked to list three sites with which they were most familiar. To get adequate variance in the data, we established a quota-sampling plan. One third of the respondents were asked to evaluate their favorite sites, one third were asked to evaluate their second favorite sites, and one third were asked to evaluate their third favorite sites.
To collect the data, respondents were directed to a Web site containing the revised questionnaire, which they then self-administered. To encourage participation, respon-dents who filled out the surveys were entered into a ran-dom drawing to receive one of several cash prizes. This process yielded a total of 549 completed questionnaires. By virtue of the aforementioned quota-sampling plan, these questionnaires covered a range of sites that varied in terms of both perceived quality and product variety (apparel, books, CDs, computer software and hardware, drugs, electronics, flowers, groceries, toys).
Data Analysis and Scale Reduction
half of the respondents did not respond to these items, pre-sumably because they had not experienced the issues cov-ered by the items (the e-retailing study by Wolfinbarger and Gilly [2003] also reported an average missing-value rate of 32% for similar items). Because recovery was an important aspect of service, we set aside these items for separate analysis to develop an e-recovery service scale. We conducted further analyses with the remaining items to develop an e-core service quality scale (E-S-QUAL).
We next conducted exploratory factor analysis on the items, using principal component analysis as the extrac-tion method and oblimin (with Kaiser normalizaextrac-tion) as the rotation method. We used the breaks-in-eigenvalues criterion to determine the initial number of factors to re-tain. We then went through a series of iterations, each involving elimination of items with low loadings on all factors or high cross-loadings on two or more factors, fol-lowed by factor analysis of the remaining items. This itera-tive process resulted in the final E-S-QUAL Scale, consist-ing of 22 items on four dimensions, which we labeled and defined as follows:
1. Efficiency:The ease and speed of accessing and using the site.
2. Fulfillment:The extent to which the site’s prom-ises about order delivery and item availability are fulfilled.
3. System availability:The correct technical func-tioning of the site.
4. Privacy:The degree to which the site is safe and protects customer information.
We conducted confirmatory factor analysis (CFA) to fur-ther assess the factor structure of the E-S-QUAL Scale.
We next analyzed the items we had set aside earlier for constructing a scale for measuring the quality of recovery service provided by Web sites. For this analysis, we used only the subset of respondents (approximately 50% of the full sample) who had completed these items. Following the same iterative process used in developing E-S-QUAL, we created an e-recovery service quality scale (E-RecS-QUAL) consisting of 11 items on three dimensions:
1. Responsiveness:Effective handling of problems and returns through the site.
2. Compensation: The degree to which the site compensates customers for problems.
3. Contact:The availability of assistance through telephone or online representatives.
As in the case of E-S-QUAL, we conducted CFA analysis to verify the factor structure of the E-RecS-QUAL Scale.
Reliability and Validity Assessment
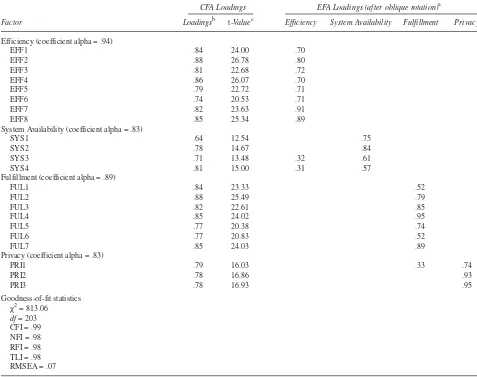
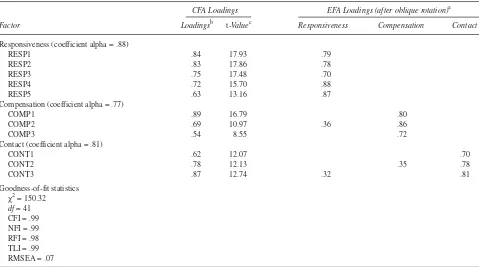
The first two sections of the appendix contain the scale items for E-S-QUAL and E-RecS-QUAL. Table 1 presents the CFA results for E-S-QUAL, as well as coefficient alpha values for the four dimensions and item loadings from the exploratory factor analysis (EFA). Table 2 pres-ents the corresponding results for the E-RecS-QUAL Scale.1The coefficient alpha values range from .83 to .94 for E-S-QUAL and .77 to .88 for E-RecS-QUAL, exceed-ing the conventional minimum of 0.7 (Nunnally and Bernstein 1994) and demonstrating high internal consis-tency and hence reliability of each dimension. These val-ues together with the strong loadings of the scale items on their corresponding factors (in both EFA and CFA) sup-port the convergent validity of each scale’s component dimensions. The various fit indices for the CFA are also very good, with the possible exception of the root mean square error of approximation (RMSEA), which is slightly above the cutoff value of .06 suggested by Hu and Bentler (1999), although it is well within the criteria suggested by Browne and Cudeck (1993) for inferring acceptable fit. Collectively, these findings provide good support for the soundness of both scales’ factor structures.2
The interfactor correlations between pairs of dimen-sions in the CFA ranged from .67 to .83 for the E-S-QUAL dimensions and .68 to .73 for the E-RecS-QUAL dimen-sions. To assess the discriminant validity of the scales, we constrained each of these correlations (one at a time) to unity in the measurement model (leaving all other parame-ters to be free) and repeated the CFA. In every case, the constrained CFA produced an increase in the chi-square statistic (∆χ2with 1df) that was significant atp < .01.
These results support the distinctiveness of each scale’s component dimensions.
In addition to the item pool from which E-S-QUAL and E-RecS-QUAL were constructed, the survey included two global measures: (a) overall quality of the site, rated by respondents on a 10-point scale (1 =poor, 10 =excellent), and (b) overall value of the site, rated by respondents on a 10-point scale (1 =poor, 10 =excellent). To assess the pre-dictive validity of the two scales, we correlated each of these global measures with summed dimensional scores for each of the four dimensions of E-S-QUAL and the three dimensions of E-RecS-QUAL. This analysis revealed positive and statistically significant (p< .01) cor-TABLE 1
CFA and EFA Results for the E-S-QUAL Scale
CFA Loadings EFA Loadings (after oblique rotation)a
Factor Loadingsb t-Valuec Efficiency System Availability Fulfillment Privacy
Efficiency (coefficient alpha = .94)
EFF1 .84 24.00 .70
EFF2 .88 26.78 .80
EFF3 .81 22.68 .72
EFF4 .86 26.07 .70
EFF5 .79 22.72 .71
EFF6 .74 20.53 .71
EFF7 .82 23.63 .91
EFF8 .85 25.34 .89
System Availability (coefficient alpha = .83)
SYS1 .64 12.54 .75
SYS2 .78 14.67 .84
SYS3 .71 13.48 .32 .61
SYS4 .81 15.00 .31 .57
Fulfillment (coefficient alpha = .89)
FUL1 .84 23.33 .52
FUL2 .88 25.49 .79
FUL3 .82 22.61 .85
FUL4 .85 24.02 .95
FUL5 .77 20.38 .74
FUL6 .77 20.83 .52
FUL7 .85 24.03 .89
Privacy (coefficient alpha = .83)
PRI1 .79 16.03 .33 .74
PRI2 .78 16.86 .93
PRI3 .78 16.93 .95
Goodness-of-fit statistics χ2= 813.06
df= 203 CFI = .99 NFI = .98 RFI = .98 TLI = .98 RMSEA = .07
NOTE: CFA = confirmatory factor analysis; EFA = exploratory factor analysis; CFI = Comparative Fit Index; NFI = Normed Fit Index; RFI = Relative Fit Index; TLI = Tucker-Lewis Index; RMSEA = root mean square error of approximation.
a. Total variance extracted by the four factors = 74%; rotation method: oblimin with Kaiser normalization; average interfactor correlation = .51; loadings < .30 not shown.
b. These are standardized loading estimates from CFA using the Amos software package.
c. Based on one-tailed tests,t-values greater than 1.65 are significant atp< .05;t-values greater than 2.33 are significant atp< .01.
relations in all instances. The correlations of the E-S-QUAL dimensions with the overall measures ranged from .47 to .60 for quality and .44 to .54 for value. Likewise, the correlations of the E-RecS-QUAL dimensions with the overall measures ranged from .40 to .57 for quality and .33 to .49 for value. These results are indicative of the predic-tive validity of each scale’s component dimensions.
ADDITIONAL ASSESSMENT OF THE REFINED SCALES
We conducted additional empirical research to further examine the scales’ structure and properties. Specifically, the goals of this research were (a) to reconfirm the refined scales’reliability and validity in the context of two specific online companies (in contrast to the respondent-specified company contexts that produced the data used in develop-ing and refindevelop-ing the scales) and (b) to examine the relative importance of the various e-SQ dimensions in influencing customers’ overall quality and value perceptions and loy-alty intentions.
Sample Design and Data Collection
We selected two online stores—amazon.com and walmart.com—to verify the psychometric properties of the E-S-QUAL and E-RecS-QUAL Scales. Several con-siderations led to the choice of these two online stores. While walmart.com has a well-known physical counter-part, amazon.com does not, thereby allowing coverage of the two major types of online retailing. The two sites also differ in terms of the types and variety of products they sell. The dissimilarities across the sites provided a more robust context for testing the refined scales than a single site or two similar sites would have. Yet another consider-ation in choosing these two sites was their popularity—at the time of the study, they were among the most visited sites according to “100 Hot Sites.” This consideration was important because lists of users of specific sites were unavailable and, as such, the sampling frame for the study consisted of individuals in the general population who had Internet access. Therefore, sites with high incidence rates within the population of Internet users were necessary for generating sufficiently large samples.
TABLE 2
CFA and EFA Results for the E-RecS-QUAL Scale
CFA Loadings EFA Loadings (after oblique rotation)a Factor Loadingsb t-Valuec Responsiveness Compensation Contact
Responsiveness (coefficient alpha = .88)
RESP1 .84 17.93 .79
RESP2 .83 17.86 .78
RESP3 .75 17.48 .70
RESP4 .72 15.70 .88
RESP5 .63 13.16 .87
Compensation (coefficient alpha = .77)
COMP1 .89 16.79 .80
COMP2 .69 10.97 .36 .86
COMP3 .54 8.55 .72
Contact (coefficient alpha = .81)
CONT1 .62 12.07 .70
CONT2 .78 12.13 .35 .78
CONT3 .87 12.74 .32 .81
Goodness-of-fit statistics χ2= 150.32
df= 41 CFI = .99 NFI = .99 RFI = .98 TLI = .99 RMSEA = .07
NOTE: CFA = confirmatory factor analysis; EFA = exploratory factor analysis; CFI = Comparative Fit Index; NFI = Normed Fit Index; RFI = Relative Fit Index; TLI = Tucker-Lewis Index; RMSEA = root mean square error of approximation.
a. Total variance extracted by the three factors = 72%; rotation method: oblimin with Kaiser Normalization; average interfactor correlation = .46; loadings < 0.30 not shown.
b. These are standardized loading estimates from CFA using the Amos software package.
We hired a marketing research firm with expertise in conducting nationwide surveys to assist with the data col-lection. This firm (a) generated a list of a representative cross section of U.S. residents with Internet access, (b) contacted individuals on the list and screened them to determine if they had sufficient experience with walmart.com or amazon.com to qualify for the study (potential respondents had to have visited the site at least three times during the past 3 months and made at least three purchases from the site during that period), (c) directed them to a Web site containing the online question-naire (two separate Web sites were set up—one each for the walmart.com and amazon.com surveys—and qualified respondents were requested to visit the appropriate site and complete the survey). To have a sufficient number of observations for verifying the factor structures and dimensionality of the refined scales through confirmatory factor analysis, we set a minimum sample size of 200 respondents for each site. This sample size exceeded the conventional requirement that around five observations per scale item are needed for conducting factor analyses (Hair et al. 1998; Stevens 1996).
In the general population with Internet access, the inci-dence of visits to walmart.com was considerably lower than that for amazon.com. Therefore, to meet the mini-mum sample size requirement for each site, the research firm used the following protocol in choosing and qualify-ing respondents from the samplqualify-ing frame: Each potential respondent was selected randomly from the sampling frame and asked the screening questions pertaining to walmart.com. If the respondent qualified, he or she was directed to the Web site containing the survey for walmart.com. If the respondent did not qualify for walmart.com, he or she was asked the screening questions pertaining to amazon.com and, if qualified, was directed to the Web site containing the survey for amazon.com. As an incentive for participation, respondents completing the surveys were entered into a random drawing to receive one of several cash prizes. Respondents not qualifying for either online store were dropped from the study. This pro-cedure was continued until both stores had at least 200 completed questionnaires.
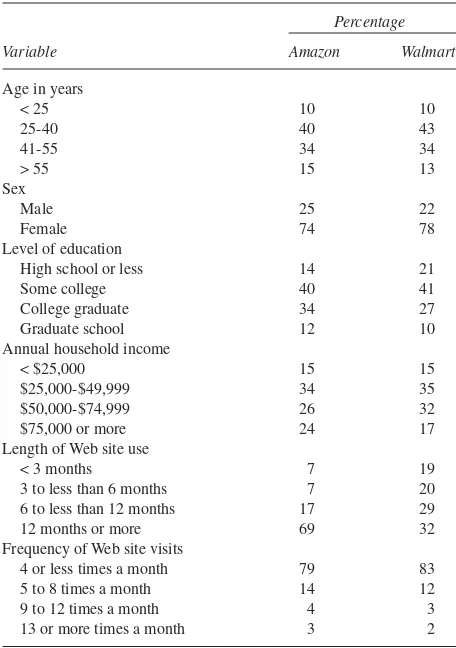
The final sample sizes for walmart.com and amazon. com were 205 and 653, respectively. Table 3 contains descriptive profiles of the two samples. The samples are similar, except in terms of length of patronage—whereas 69% of the amazon.com sample had been using that site for 12 months or more, only 32% of the walmart.com sam-ple had been doing so (this finding is not surprising in view of the fact that amazon.com had been in existence sub-stantially longer than had walmart.com at the time of the study).
Measures Included in the Study
The survey instrument had four parts. The first part consisted of the 22 E-S-QUAL items shown in the appen-dix. The second part began with a dichotomous screening question asking respondents if they had experienced any problem or needed help with the site. Those answering yes were asked to respond to the 11-item E-RecS-QUAL bat-tery shown in the appendix.
The third part contained multiple-item measures of two constructs—perceived value and loyalty intentions—that were used subsequently in assessing the scales’ validity. The perceived value construct was measured with four items similar to those used in previous research (e.g., Dodds, Monroe, and Grewal 1991; Sirdeshmukh, Singh, and Sabol 2002). The items, included in the third section of the appendix, are consistent with the conceptualization of perceived value as a customer trade-off between bene-fits and costs (Zeithaml 1988) and focus on customers’
TABLE 3
Profiles of the Two Samplesa
Percentage Variable Amazon Walmart
Age in years
< 25 10 10
25-40 40 43
41-55 34 34
> 55 15 13
Sex
Male 25 22
Female 74 78
Level of education
High school or less 14 21
Some college 40 41
College graduate 34 27
Graduate school 12 10
Annual household income
< $25,000 15 15
$25,000-$49,999 34 35
$50,000-$74,999 26 32
$75,000 or more 24 17
Length of Web site use
< 3 months 7 19
3 to less than 6 months 7 20
6 to less than 12 months 17 29
12 months or more 69 32
Frequency of Web site visits
4 or less times a month 79 83
5 to 8 times a month 14 12
9 to 12 times a month 4 3
13 or more times a month 3 2
higher order evaluations that have been posited to contrib-ute to the perceived value of Web sites: perceptions of overall price, convenience, and control (Zeithaml, Parasuraman, and Malhotra 2000). The loyalty intentions construct was measured through a five-item Behavioral Loyalty Scale developed by Zeithaml, Berry, and Parasuraman (1996). The loyalty scale items are shown in the last section of the appendix.
The fourth part consisted of demographic and usage questions that produced the descriptive sample profiles shown in Table 3. In addition to the information in Table 3, one other sample characteristic is worth noting: In both samples the incidence of respondents experiencing diffi-culties with the sites was quite low. Only about 8% of the amazon.com sample of 653 and 16% of the walmart.com sample of 205 had experienced problems with, or sought assistance from, the sites. Therefore, the sample sizes for the E-RecS-QUAL portion of the survey were quite small—51 for amazon.com and 34 for walmart.com. The effective sample size was even smaller for some of the E-RecS-QUAL scale items (e.g., those relating to product returns) for which several respondents checked the “not applicable” response category depending on the nature of the problem or difficulty experienced. The restricted sam-ple sizes limited the extent to which we could meaning-fully assess E-RecS-QUAL’s psychometric properties, especially in terms of conducting CFAs and structural equation modeling (SEM) analyses (the recommended minimum observations-to-variables ratio for meaning-fully conducting such analyses is five [Hair et al. 1998; Stevens 1996]).
Reassessment of Reliability and Validity
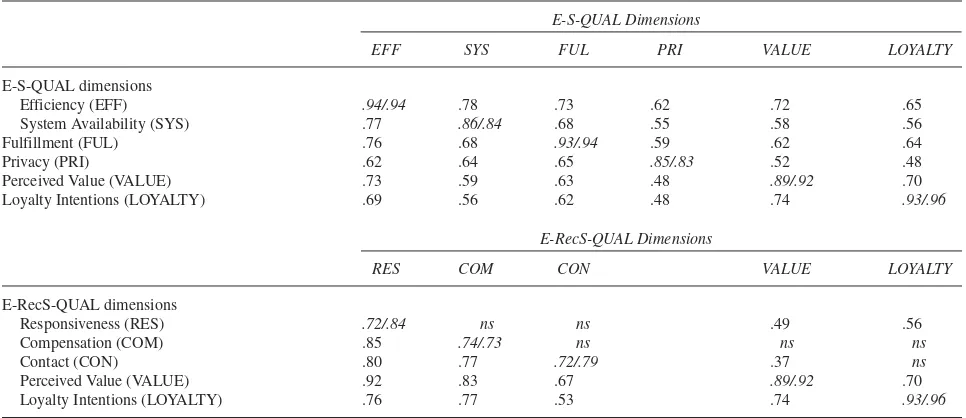
Table 4 presents coefficient alpha values for, and inter-correlations among, the four E-S-QUAL dimensions, the three E-RecS-QUAL dimensions, and the measures of perceived value and loyalty intentions. The coefficient alpha values for all measures in both samples exceed the minimum standard of .7 (Nunnally and Bernstein 1994), suggesting that the measures are reliable. The four dimen-sions of E-S-QUAL have consistently strong and positive correlations with perceived value (.52 to .72 for ama-zon.com and .48 to .73 for walmart.com) and loyalty intentions (.48 to .65 for amazon.com and .48 to .69 for walmart.com). These results attest to E-S-QUAL’s pre-dictive validity.
The correlations for the three E-RecS-QUAL dimen-sions with perceived value and loyalty intentions are all large and significant for walmart.com, but only three of the six corresponding correlations are significant for ama-zon.com, perhaps because the number of respondents for several of these items was quite small for that site. More-over, as mentioned before, insufficient sample size for E-RecS-QUAL hindered reconfirming the scale’s factor structure and construct validity through CFA and SEM analyses. Thus, although the results from the scale-devel-opment phase of our research (Step 5 in Figure 1) provided equally strong support for the reliability and validity of both E-S-QUAL and E-RecS-QUAL, there is a need for further psychometric assessment of E-RecS-QUAL in contexts involving Web sites that have a higher incidence of service problems than did the two sites included in our TABLE 4
Reliabilities and Intercorrelationsa,b
E-S-QUAL Dimensions
EFF SYS FUL PRI VALUE LOYALTY
E-S-QUAL dimensions
Efficiency (EFF) .94/.94 .78 .73 .62 .72 .65
System Availability (SYS) .77 .86/.84 .68 .55 .58 .56
Fulfillment (FUL) .76 .68 .93/.94 .59 .62 .64
Privacy (PRI) .62 .64 .65 .85/.83 .52 .48
Perceived Value (VALUE) .73 .59 .63 .48 .89/.92 .70
Loyalty Intentions (LOYALTY) .69 .56 .62 .48 .74 .93/.96
E-RecS-QUAL Dimensions
RES COM CON VALUE LOYALTY
E-RecS-QUAL dimensions
Responsiveness (RES) .72/.84 ns ns .49 .56
Compensation (COM) .85 .74/.73 ns ns ns
Contact (CON) .80 .77 .72/.79 .37 ns
Perceived Value (VALUE) .92 .83 .67 .89/.92 .70
Loyalty Intentions (LOYALTY) .76 .77 .53 .74 .93/.96
a. The alpha reliabilties are shown in italics (on the diagonals), and estimates for Amazon are presented first.
study. Analyses discussed in the remainder of the article focus on just E-S-QUAL.
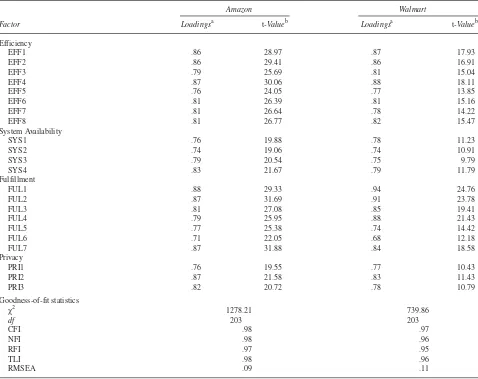
Table 5 presents CFA results for the E-S-QUAL items.3 The loadings generated are all high and significant (p <
.01) in both samples. These results, along with the high coefficient alpha values for the four dimensions in both samples (Table 4), offer support for E-S-QUAL’s conver-gent validity. The pairwise interfactor correlations pro-duced by the CFA ranged from .38 to .63. Fixing each of these correlations to 1 and redoing the CFA produced a significant increase in the chi-square statistic in every in-stance (∆χ2values with 1dfwere all significant atp< .01)
demonstrating high discriminant validity across the four E-S-QUAL dimensions. Finally, values for the various fit indices, with the possible exception of RMSEA, exceed Hu and Bentler’s (1999) criteria for good fit. Together, these results reinforce the support obtained in the scale-development phase for the psychometric soundness of E-S-QUAL.
TABLE 5
CFA Results for the E-S-QUAL Scale
Amazon Walmart
Factor Loadingsa t-Valueb Loadingsa t-Valueb
Efficiency
EFF1 .86 28.97 .87 17.93
EFF2 .86 29.41 .86 16.91
EFF3 .79 25.69 .81 15.04
EFF4 .87 30.06 .88 18.11
EFF5 .76 24.05 .77 13.85
EFF6 .81 26.39 .81 15.16
EFF7 .81 26.64 .78 14.22
EFF8 .81 26.77 .82 15.47
System Availability
SYS1 .76 19.88 .78 11.23
SYS2 .74 19.06 .74 10.91
SYS3 .79 20.54 .75 9.79
SYS4 .83 21.67 .79 11.79
Fulfillment
FUL1 .88 29.33 .94 24.76
FUL2 .87 31.69 .91 23.78
FUL3 .81 27.08 .85 19.41
FUL4 .79 25.95 .88 21.43
FUL5 .77 25.38 .74 14.42
FUL6 .71 22.05 .68 12.18
FUL7 .87 31.88 .84 18.58
Privacy
PRI1 .76 19.55 .77 10.43
PRI2 .87 21.58 .83 11.43
PRI3 .82 20.72 .78 10.79
Goodness-of-fit statistics
χ2 1278.21 739.86
df 203 203
CFI .98 .97
NFI .98 .96
RFI .97 .95
TLI .98 .96
RMSEA .09 .11
NOTE: CFA = confirmatory factor analysis; CFI = Comparative Fit Index; NFI = Normed Fit Index; RFI = Relative Fit Index; TLI = Tucker-Lewis Index; RMSEA = root mean square error of approximation.
a. These are standardized loading estimates from CFA using the Amos software package.
b. Based on one-tailed tests, t-values greater than 1.65 are significant atp< .05; t-values greater than 2.33 are significant atp< .01.
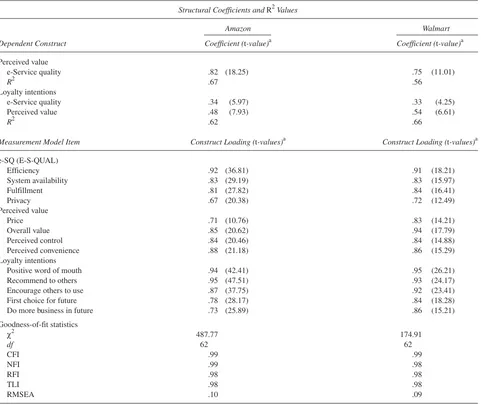
To test the nomological validity of E-S-QUAL, we for-mulated a structural model consistent with the relation-ships implied in the latter stages of the means-end frame-work (Figure 2). Specifically, we modeled e-SQ as an exogenous construct that influences the higher order con-structs of perceived value and loyalty intentions. In addi-tion, consistent with extant theories, we modeled per-ceived value as an antecedent of loyalty intentions. The three constructs were treated as latent constructs in the structural model. For perceived value and loyalty inten-tions, their corresponding scale items served as indicator variables. For e-SQ, we first computed scores for effi-ciency, system availability, fulfillment, and privacy by adding the ratings on their corresponding scale items. We then used the summed scores for the four dimensions as indicators of the latent e-SQ variable.4The results of the SEM analyses for the two samples are summarized in Table 6.
The overall goodness-of-fit statistics and results from the structural-model portion of Table 6 (i.e., the structural coefficients andR2values) imply that the data from each of the two samples fit the proposed model reasonably well— all fit indices are well above conventional cutoff values (Hu and Bentler 1999), although the RMSEA values are somewhat high.5Furthermore, the uniformly high and sig-nificant item-construct loadings in the
measurement-model portion of Table 6 suggest that the three latent con-structs are reflected well by their corresponding indicator variables. The results collectively support E-S-QUAL’s nomological validity. In other words, the fact that the empirical findings provide strong support for the proposed nomological net—consisting of theoretically derived links among e-SQ (measured with the newly developed E-S-QUAL), perceived value, and loyalty intentions (both measured with adaptations of previously well-established scales)—offers further evidence of the psychometric soundness of E-S-QUAL.
RELATIVE IMPORTANCE
OF THE E-S-QUAL DIMENSIONS
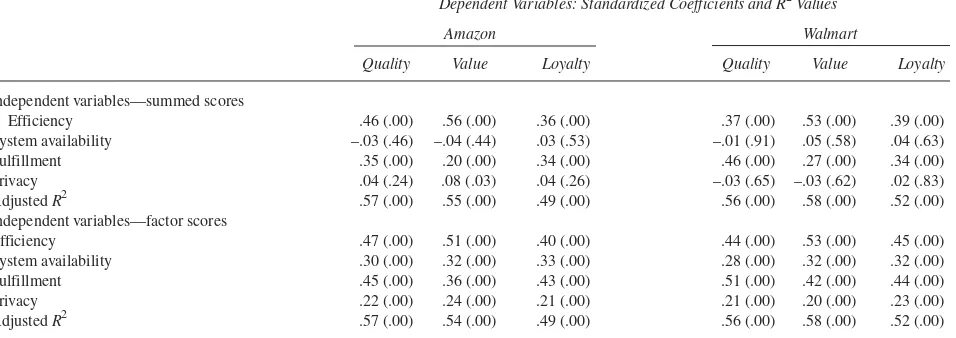
The means-end theoretical framework posits, and the results in Table 6 verify, that E-S-QUAL assessments made at the dimensional level have an impact on higher-order evaluations. To determine the extent to which each E-S-QUAL dimension contributes to this impact, we con-ducted three multiple regression analyses in which the summed scores on the four dimensions were the independ-ent variables and each of the following, in turn, served as the dependent variable: (a) a single-item overall quality measure (QUALITY) with a 10-point scale (1 =poor, 10 = excellent), (b) the summed score on the four-item per-ceived value measure (VALUE), and (c) the summed score on the five-item loyalty-intentions measure (LOYALTY). The top half of Table 7 summarizes the regression results.
The effects of efficiency and fulfillment on all three dependent variables are positive and significant, whereas the effects of system availability and privacy are nonsignificant, in both samples. The consistent lack of sig-nificance of the latter effects was surprising. As Table 4 shows, the pairwise correlations of system availability and privacy with perceived value and loyalty intentions, although somewhat lower than that of efficiency and ful-fillment, are of the same order of magnitude. Therefore, multicollinearity due to the strong correlations among the summed-score measures of the four E-S-QUAL dimen-sions seemed to be a plausible explanation for the non-significant effects of system availability and privacy. To determine the degree of multicollinearity, we computed the variance inflation factor (VIF) for each independent variable in regression equations. The mean VIF value across the four independent variables was 2.59 for the Amazon sample and 2.74 for the Walmart sample. These 4. It might have been preferable to treat e-SQ as a second-order latent
construct in the structural model, with the four E-S-QUAL dimensions serving as the first-order constructs, which in turn are represented by the 22 scale items. But estimating such a complex model given the limited sample sizes, especially for Walmart, was problematic (Hu and Bentler 1999). We therefore opted to use summed scores for the four E-S-QUAL dimensions as indicators of e-SQ. It should be noted, however, that the use of improper item parcels as indicator variables could lead to misspecified models and biased parameter estimates (Kim and Hagtvet 2003). On the other hand, to the extent that item parcels are based on an appropriate initial conceptualization of the item domain (which was the case in the present study) and are not derived through a purely post hoc, data-driven basis, the risk of misspecifications and biased estimates is mitigated (Kim and Hagtvet 2003).
5. Regarding the somewhat high RMSEA values, it is worth noting that the interpretation of any fit index in isolation could be problematic because trade-offs between Type I and Type II errors call for the interpre-tation ofcombinationsof indexes in various model contexts (Hu and Bentler [1999] and McQuitty [2004] offer insightful discussions of this issue and recommend interpretation guidelines). A related issue is statis-tical power, which depends on sample size as well as the degrees of free-dom in the structural model and can be either too low (leading to non-rejection of incorrect models) or too high (leading to non-rejection of correct models) (McQuitty 2004). As such,
situations in which power is overly great (i.e., > 0.9) may require a more relaxed interpretation of fit than is typical. Conversely, a more stringent interpretation of fit statistics is required when power is low, especially when goodness-of-fit statistics are not exemplary. (McQuitty 2004, p. 182)
McQuitty (2004) offers a table (Table 5 in his article) that summarizes the minimum sample sizes necessary for achieving specified levels of statis-tical power in testing structural models with varying degrees of freedom. Interpolating from this table, the statistical power turns out to be well
values imply the presence of at least a moderate degree of multicollinearity.6
To circumvent the problem of multicollinearity, we conducted a factor analysis (with varimax rotation) of the ratings on the 22 items and extracted four orthogonal fac-tors. In both samples, (a) the rotated loadings evidenced a relatively clean factor structure—with few exceptions, the items loaded very strongly on factors corresponding to
their a priori dimensions and weakly on the other dimen-sions, (b) the four factors together accounted for about 75% of the variance in the items, and (c) the correlation between the factor-score measure of each dimension and its corresponding summed-score measure ranged from .77 to .89 (in contrast, correlations between factor-score mea-sures and noncorresponding summed-score meamea-sures ranged from .21 to .47).7Because each factor-score mea-sure is, in effect, a weighted combination of all 22 items, its interpretation is not synonymous with that of the corre-sponding summed-score measure. On the other hand, TABLE 6
SEM Analysis to Examine E-S-QUAL’s Nomological Validity
Structural Coefficients andR2Values
Amazon Walmart
Dependent Construct Coefficient (t-value)a Coefficient (t-value)a
Perceived value
e-Service quality .82 (18.25) .75 (11.01)
R2 .67 .56
Loyalty intentions
e-Service quality .34 (5.97) .33 (4.25)
Perceived value .48 (7.93) .54 (6.61)
R2 .62 .66
Measurement Model Item Construct Loading (t-values)a Construct Loading (t-values)a
e-SQ (E-S-QUAL)
Efficiency .92 (36.81) .91 (18.21)
System availability .83 (29.19) .83 (15.97)
Fulfillment .81 (27.82) .84 (16.41)
Privacy .67 (20.38) .72 (12.49)
Perceived value
Price .71 (10.76) .83 (14.21)
Overall value .85 (20.62) .94 (17.79)
Perceived control .84 (20.46) .84 (14.88)
Perceived convenience .88 (21.18) .86 (15.29)
Loyalty intentions
Positive word of mouth .94 (42.41) .95 (26.21)
Recommend to others .95 (47.51) .93 (24.17)
Encourage others to use .87 (37.75) .92 (23.41)
First choice for future .78 (28.17) .84 (18.28)
Do more business in future .73 (25.89) .86 (15.21)
Goodness-of-fit statistics
χ2 487.77 174.91
df 62 62
CFI .99 .99
NFI .99 .98
RFI .98 .98
TLI .98 .98
RMSEA .10 .09
NOTE: SEM = structural equation modeling; CFI = Comparative Fit Index; NFI = Normed Fit Index; RFI = Relative Fit Index; TLI = Tucker-Lewis Index; RMSEA = root mean square error of approximation.
a. Based on one-tailed tests,t-values greater than 1.65 are significant atp< .05;t-values greater than 2.33 are significant atp< .01.
6. There is no formal, theory-based cutoff value for the variance infla-tion factor (VIF), although values exceeding 10 are often regarded as indicating severe multicollinearity; however, VIF values greater than 2.5 are cause for concern (Allison 1999). Moreover, Netter et al. (1996) sug-gested that VIF values considerably larger than 1 are indicative of serious multicollinearity.
given the aforementioned results, it is reasonable to inter-pret each factor-score measure aspredominantly repre-senting the corresponding E-S-QUAL dimension. There-fore, regression analyses with the orthogonal factor-score measures (rather than the summed-score measures) as independent variables will provide a clearer picture of the relative contributions of the four E-S-QUAL dimensions in explaining the variance in the dependent measures (i.e., quality, value, and loyalty).
The bottom half of Table 7 summarizes the results from the three regression analyses in which the factor-score measures were the independent variables. These results show that all four factor-score measures have significant positive effects on the three dependent measures in both samples. The pattern of effects is consistent across de-pendent variables and samples and suggests that the fac-tors representing efficiency and fulfillment have the stron-gest effects, followed by the factors representing system availability and then privacy.
Wolfinbarger and Gilly’s (2003) etailing study— wherein their 14 eTailQ scale items were grouped into four dimensions labeledWeb site design,fulfillment/reliability, security/privacy, and customer service—found that (a) Web site design and fulfillment/reliability had significant effects on overall quality, satisfaction, and loyalty inten-tions (with the effect of Web site design being much stron-ger on loyalty intentions than on quality and satisfaction); (b) security/privacy had no significant effect on any of the dependent variables; and (c) customer service had sig-nificant but relatively weak effects on quality and loyalty intentions, and no effect on satisfaction. To the extent that eTailQ’s Web site design and reliability/fulfillment dimen-sions have some conceptual and content overlap with
E-S-QUAL’s efficiency and fulfillment dimensions, the results about the relative importance of dimensions of the two scales are similar. On the other hand, there are several important differences between the two scales as described below.
First, the two studies show different results as they re-late to the significance of privacy. In the present study, regression analyses using factor-score measures as inde-pendent variables clearly and consistently show that the factor representing privacy plays a significant role in cus-tomers’ higher-order evaluations pertaining to Web sites. Second, eTailQ’s three-item customer service dimension is represented in the present study by a distinct scale—E-RecS-QUAL, consisting of 11 items grouped into three dimensions—that is intended for assessing the quality of a Web site’s service in response to problems or ques-tions experienced by customers. The relatively low im-portance of the customer service dimension observed in Wolfinbarger and Gilly’s (2003) study might be an artifact of a high incidence of missing values for the customer-service questions due to those questions being asked of all respondents rather than only those who had problems or questions.8The separate E-RecS-QUAL Scale, in addition to being relevant only for recovery service (thereby mini-mizing if not eliminating the incidence of missing values), can offer a finer-grained assessment of recovery service quality. Third, E-S-QUAL’s four-item system-availability dimension, the factor representing which has an even stronger effect on the dependent measures than does the TABLE 7
Regression Analyses of Quality, Value, and Loyalty on Summed and Factor Scores for E-S-QUAL Dimensions
Dependent Variables: Standardized Coefficients and R2Values
Amazon Walmart
Quality Value Loyalty Quality Value Loyalty
Independent variables—summed scores
Efficiency .46 (.00) .56 (.00) .36 (.00) .37 (.00) .53 (.00) .39 (.00)
System availability –.03 (.46) –.04 (.44) .03 (.53) –.01 (.91) .05 (.58) .04 (.63)
Fulfillment .35 (.00) .20 (.00) .34 (.00) .46 (.00) .27 (.00) .34 (.00)
Privacy .04 (.24) .08 (.03) .04 (.26) –.03 (.65) –.03 (.62) .02 (.83)
AdjustedR2 .57 (.00) .55 (.00) .49 (.00) .56 (.00) .58 (.00) .52 (.00)
Independent variables—factor scores
Efficiency .47 (.00) .51 (.00) .40 (.00) .44 (.00) .53 (.00) .45 (.00)
System availability .30 (.00) .32 (.00) .33 (.00) .28 (.00) .32 (.00) .32 (.00)
Fulfillment .45 (.00) .36 (.00) .43 (.00) .51 (.00) .42 (.00) .44 (.00)
Privacy .22 (.00) .24 (.00) .21 (.00) .21 (.00) .20 (.00) .23 (.00)
AdjustedR2 .57 (.00) .54 (.00) .49 (.00) .56 (.00) .58 (.00) .52 (.00)
NOTE: Numbers in parentheses are significance levels.
factor representing privacy, is not explicitly and fully re-flected in eTailQ; at best, it is subsumed under the more general Web site design dimension.
DISCUSSION
Informed by insights from the extant literature and using the means-end framework as a theoretical founda-tion, we set out to conceptualize, construct, refine, and test a multiple-item scale (E-S-QUAL) for measuring the ser-vice quality delivered by Web sites. In the preliminary stage of scale development, a large number of respondents did not provide ratings on a subset of the initial pool of items. An examination of these items revealed that they all pertained to nonroutine or recovery service encounters that many respondents apparently had not experienced. Therefore, in subsequent stages of scale development and refinement, we created a subscale of E-S-QUAL—called E-RecS-QUAL—containing items focusing on handling service problems and inquiries, and being salient only to customers who had had nonroutine encounters with the sites. The basic E-S-QUAL Scale (relevant for a Web site’s entire customer base) is a four-dimensional, 22-item scale, whereas E-RecS-QUAL (relevant for the portion of the customer base with recovery service experience) is a three-dimensional, 11-item scale. We hope that the two scales will stimulate and facilitate additional scholarly research on e-SQ and also assist practitioners in systemati-cally assessing and improving e-SQ. We next offer direc-tions for further research on e-SQ and discuss the practical implications of our findings.
Directions for Further Research
Both scales demonstrate good psychometric properties based on findings from a variety of reliability and validity tests. However, the E-RecS-QUAL Scale should be viewed as a preliminary scale because the small samples of customers with recovery-service experience at the sites used in later stages of scale testing did not permit a com-prehensive psychometric assessment of that scale. We selected amazon.com and walmart.com for the confirma-tory phase of our research because they were among the most frequently visited Web sites at that time, and inci-dence of visits to sites among the general population was critical for sampling efficiency because we did not have access to site-specific customer lists. However, although the two chosen sites enjoyed high frequency of visits, it turned out that they both also had a low incidence of prob-lem encounters, probably because the sites were among the most reputed sites at the time of the study. There is thus a need to further examine the reliability and validity of
E-RecS-QUAL in the context of more diverse Web sites that have a higher incidence of problem encounters and to refine the scale if necessary.
To capture the full range of customer-service issues (e.g., product returns), all phases of our research focused on Web sites that sold physical products (in contrast to pure-service sites such as those offering financial or infor-mation services). As such, an important research priority is to examine the scales in the context of pure-service sites, make any necessary modifications, and assess the psycho-metric properties of the modified scales. As a starting point for such research, an examination of the scale items in the appendix suggests that (a) all items under the effi-ciency, system availability, and privacy dimensions of E-S-QUAL and the contact dimension of E-RecE-S-QUAL are germane to pure-service sites as well; (b) several of the items under the other three dimensions (fulfillment, re-sponsiveness, and compensation) should also be applica-ble to pure-service sites; and (c) the remaining items could be modified or eliminated (and perhaps supplemented with additional items if necessary). Adapted scale ver-sions based on the above suggestions need to be created and formally evaluated in the context of pure-service sites, including online newspapers, customer-to-customer sites, portals, and other such sites.
The purpose of E-S-QUAL (and E-RecS-QUAL) is solely to measure theservice qualityof Web sites. Other experiential aspects such as fun or pleasure do not fall within the conceptual domain of service quality because such hedonic aspects are distinct benefits that may not be relevant in all contexts or to all customers. On the other hand, understanding the interplay between benefits sought from a site and the site’s service quality is a potentially fruitful avenue for research. For instance, are some e-SQ dimensions more critical than others when customers seek hedonic benefits from a Web site (e.g., an entertainment site), as opposed to when they engage in strictly goal-directed shopping interactions? Does the nature of the benefits sought (hedonic vs. goal-directed) moderate the impact of a Web site’s service quality on customers’ evalu-ation of the benefits? These and related questions are worth exploring.
Managerial Implications
As the discussion in the preceding section illustrates, there is a need for further research to deepen our under-standing of the assessment, antecedents, and conse-quences of e-SQ. However, the findings from the present study have several important, even if broad, implications for practitioners.
Of the four E-S-QUAL dimensions, customers’ assess-ments of a Web site on these two dimensions have the strongest influence not only on overall quality perceptions but also on perceived value and loyalty intentions. The consistency of these results underscores the need for com-panies to place extra emphasis on Web site attributes per-taining to these two dimensions. In this regard, it is note-worthy that whereas the efficiency attributes deal with designing the Web site–customer interface, virtually all the fulfillment attributes relate to the Web site’s behind-the-scenes infrastructure (see appendix). Thus, earning a high-quality image for a company’s Web site involves much more than creating an excellent façade for the site. Second, the system availability facet of Web sites is also a critical contributor to customers’ perceptions of overall quality, value, and loyalty intentions. The four per-ceptual attributes that constitute system availability sug-gest that companies may not have full control over perfor-mance on this dimension; the equipment at the customer’s end (e.g., type of computer and Internet connection) is also likely to affect performance on this dimension. Companies should be (a) sensitive to potential deleterious effects of sophisticated Web site design features on system avail-ability and (b) proactive in identifying aspects of system availability that are beyond their control and devising ap-propriate communication scripts to appease complaining customers.
Third, although privacy is the least critical of the four E-S-QUAL dimensions, our regression results show that the factor representing this dimension still has a significant influence on customers’ global evaluations of Web sites. Previous research has argued that privacy of Web sites may not be critical for more frequent users (Wolfinbarger and Gilly 2003). Experience may indeed mitigate con-cerns about Web site security. However, the fact that the respondents in our amazon.com and walmart.com surveys were prescreened for sufficient experience with the sites, coupled with the consistent findings from both surveys that privacy perceptions do influence customers’ overall quality/value perceptions and loyalty intentions, empha-sizes the need for companies to continue to reassure cus-tomers through Web site design cues and external com-munications signaling the privacy/security of their sites.
Fourth, the three recovery-service dimensions (respon-siveness, compensation, and contact) and the perceptual attributes they contain imply service aspects that mirror aspects of traditional service quality (e.g., ready access to company personnel, concern for solving customers’ prob-lems). Therefore, although online companies might be able to deliver superior e-service during routine transac-tions with little or no human contact—in fact, none of the four basic E-S-QUAL dimensions and their corresponding
attributes call for personal service—excelling in recovery service might require the human touch.
Fifth, E-S-QUAL and E-RecS-QUAL are generic and parsimonious scales, intended for obtaining a global (as opposed to transaction-specific) assessment of a Web site’s service quality. Online companies can best use the scales in tandem (with the latter being administered only to customers who have had problems or questions) to track over time—and across competing Web sites—customers’ overall e-SQ perceptions. Trends in the dimensional- and attribute-level ratings from such tracking studies will help identify Web sites’ strengths and weaknesses and suggest ideas for improvement. Such tracking studies may have to be supplemented with more specific studies when nec-essary (e.g., to pinpoint the reasons for deficiencies on a particular dimension or perceptual attribute, to evaluate customer reactions to a new Web site feature, etc.). Com-panies can also enhance the diagnostic value of the per-ceptual ratings from the two scales by comparing those ratings with customers’ minimum- and desired-service levels (Parasuraman, Zeithaml, and Berry 1994a). The minimum- and desired-service levels can be obtained by periodically incorporating into the tracking studies two additional ratings for each perceptual attribute (Parasuraman, Zeithaml, and Berry 1994a).
APPENDIX
Measures of Study Constructs
E-S-QUAL
Respondents rated the Web site’s performance on each scale item using a 5-point scale (1 =strongly disagree, 5 =strongly agree). The items below are grouped by dimension for expositional con-venience; they appeared in random order on the survey. The sym-bols preceding the items correspond to the variable names in Tables 1 and 5 in the body of the article.
Efficiency
EFF1 This site makes it easy to find what I need. EFF2 It makes it easy to get anywhere on the site. EFF3 It enables me to complete a transaction quickly. EFF4 Information at this site is well organized. EFF5 It loads its pages fast.
EFF6 This site is simple to use.
EFF7 This site enables me to get on to it quickly. EFF8 This site is well organized.
System Availability
SYS1 This site is always available for business. SYS2 This site launches and runs right away. SYS3 This site does not crash.