© The Author 2013. Published by Oxford University Press on behalf of the American Association for Public Opinion Research. All rights reserved. For permissions, please e-mail: [email protected]
CAN INTERVIEWERS EFFECTIVELY RATE
THE LIKELIHOOD OF CASES TO COOPERATE?
STEPHANIE ECKMAN*
JENNIFER SINIBALDI
ALEKSA MÖNTMANN-HERTZ
Abstract This paper explores how well interviewers can judge which cases are likely to cooperate with a survey request and which are unlikely. Interviewers in a telephone survey rated the response likeli-hood of each case after every call they placed on a scale from zero to 100, where zero meant that the case would never cooperate and 100 meant that the case certainly would. Analyses of the ratings reveal that they do correlate with the cooperation rate among the cases, and that the likelihood ratings are influenced in the expected directions by case- and call-level attributes. However, there are also strong interviewer effects. The ratings show promise for use in responsive design procedures.
Introduction
This study investigates the viability and usefulness of a new type of inter-viewer observation: interinter-viewer ratings of how likely each case is to cooperate. Interviewers probably already form impressions about the response likeli-hood of the cases assigned to them (Campanelli, Sturgis, and Purdon 1997, pp. 4–39). In this study, we capture and analyze these expectations.
There are at least two reasons why survey researchers might be interested in such observations. First, interviewer expectations of response likelihood might affect interviewer behavior during recruitment. There is evidence that inter-viewers who think recruiting cases for a given survey will be easy have higher response rates (Singer, Frankel, and Glassman 1983; Hox and de Leeuw 2002).
Stephanie Eckman is a Senior Researcher at the Institute for Employment Research (IAB) in Nuremberg, Germany. Jennifer Sinibaldi is a researcher and GradAB scholar at the Institute for Employment Research (IAB) in Nuremberg, Germany. Aleksa Möntmann-Hertz is a Senior Project Manager with the LINK Institute in Frankfurt, Germany. The authors would like to thank Susan Kenney McCollouch, Frauke Kreuter, and three reviewers for helpful comments. *Address correspondence to Stephanie Eckman, Institute for Employment Research, Weddigenstraße 20–22, Nuremberg, Germany 90478; e-mail [email protected].
doi:10.1093/poq/nft012 Advance Access publication 3 June 2013
at Jordan University of Science and Technology on July 26, 2016
http://poq.oxfordjournals.org/
Kennickell (2012) takes this line of reasoning one step further and argues that when interviewers have control over the recruitment process, their expecta-tions about how likely each case is to respond can introduce nonresponse bias: Because interviewers are pressured to reach target response rates, they recruit cases that seem like cooperators, that is, that are similar to the cases that have already completed the survey. Thus, the field should better understand how interviewers form expectations about which cases are more likely to cooper-ate. Second, if interviewer ratings of response likelihood are reasonably accu-rate, they may be useful for targeting cases in responsive design protocols that aim to reduce data-collection costs and decrease bias (Groves and Heeringa 2006), especially in telephone surveys where few case-level characteristics are available for the calculation of response propensity models.
Only a few surveys have directly asked interviewers to estimate cases’ response likelihoods. The 2004 Health and Retirement Survey asked inter-viewers to make weekly ratings using a three-point scale: low, medium, and high (Wagner and Guyer 2005). The 2010 Survey of Consumer Finances had interviewers rate their cases on a five-point scale of likelihood to participate
(Kennickell 2012). Cycle 7 of the National Survey of Family Growth rated
all incomplete cases before nonresponse subsampling in each quarter of data collection (J. Wagner, personal communication, January 7, 2013). The Dioxin Exposure Study collected a four-point rating of resistance after each contact in a nonresponse follow-up study (Olson, Sinibaldi, and Lepkowski 2006). The current wave of the National Survey of Sexual Attitudes and Lifestyles in the UK asked interviewers to score each case on a five-point willingness scale after every contact (J. Sinibaldi, personal communication, January 3, 2013).
All of these prior studies that used interviewer ratings of response likeli-hood were face-to-face surveys. We have chosen to study interviewer ratings of response likelihood in a telephone survey for two reasons. First, in the tel-ephone survey discussed here, cases were randomly assigned to interviewers, and thus we can separate the effects of call, case, and interviewer charac-teristics. Such interpenetrated designs are prohibitively expensive in face-to-face surveys. Second, many of the more traditional interviewer observations, such as the condition of the house and neighborhood (Sinibaldi, Durrant, and
Kreuter 2013), are not possible over the phone. Thus, likelihood ratings are
likely to be of greater practical use in telephone than in face-to-face surveys. This study is the first, to our knowledge, to investigate such ratings in a telephone study. The paper first explores how accurate the ratings are—that is, whether they correlate in the aggregate with the cooperation rate of the cases. It then investigates whether interviewers differ systematically in how they rate cases. Finally, a regression model identifies the call, case, and inter-viewer characteristics that influence the assigned ratings. The paper ends with thoughts about how interviewer ratings of response likelihood can be used in future surveys, and suggests areas for additional research with this interviewer observation.
at Jordan University of Science and Technology on July 26, 2016
http://poq.oxfordjournals.org/
Data
The data we use to address these questions come from a telephone survey con-ducted over nineteen days in January 2012 by the LINK Institute in Germany. At the end of each contact attempt, the interviewer rated the likelihood of the selected target person at that household to complete the survey on a later call, using a scale from zero to 100. The text of this question, translated from German, was:
How likely is it that this case will complete the interview at a later contact attempt? Please give the probability in percent, from 0 to 100.
Interviewers were not permitted to skip the question or to respond “don’t know.” All calls not resulting in cooperation (that is, an interview), except those handled entirely by the autodialer, were rated by the interviewers.
In total, thirty-four interviewers rated 11,251 calls. In addition to the rat-ing for each call, we also have the time, date, outcome, whether the selected respondent was reached, and the interviewer ID. However, for many of the rated calls, the interviewer reached a fax machine or an answering machine, or the person who answered the phone hung up without speaking to the inter-viewer. Because interviewers in these situations had little information with which to make the likelihood ratings, the analyses in this paper focus only on the 6,892 ratings resulting from calls with contact.1 For a brief discussion of
all the ratings and more details on the survey itself, please see appendix A. Interviewers were not able to see the ratings assigned to the same case by other interviewers on previous calls, if any. While the interviewing software did display the number of prior calls, and whether or not a respondent had already been selected, this information was not visible at the time of the rating. All interviewers received general training as well as survey-specific training that included practice with this question.
In compliance with German law, refusal conversion in this study was lim-ited. Those cases where a respondent was not yet selected but a contact person indicated that he or she was not interested in the topic, had no time, was not in the mood, or simply hung up without saying anything were called one more time after a few days. Cases where the selected respondent indicated that he or she had no time or were not in the mood were also called once more. Harder refusals were not recontacted. Of the 3,579 cases that refused at one point, ninety-eight eventually cooperated.
In the LINK telephone study, cases were assigned to whichever interviewer was available. There were no interviewers who specialized in refusal con-version or who worked more difficult cases. Thus, we can assume that the
1. The data set includes forty-three calls to forty-three cases that ended in hard refusals and were not rated. We have imputed 0 ratings to these calls and included them in our analyses.
at Jordan University of Science and Technology on July 26, 2016
http://poq.oxfordjournals.org/
assignment of cases to interviewers in this study was nearly random, setting aside differences in the shifts interviewers work and the kinds of cases called in each shift. Such an interpenetrated design is ideal for studying interviewer effects (Mahalanobis 1946).
In addition to the call-record data, we have data about the thirty-four inter-viewers who participated in this study. The interviewer questionnaire con-tained questions about interviewing experience and opinions about refusal conversion. These items are used to explore how interviewers’ characteristics correlate with the response likelihood ratings they give.
Analyses
To investigate the correlation of the likelihood ratings with cooperation rates,2
we calculate the average rating for each case across all calls resulting in con-tact. We then categorize cases by their average rating into bins: 0, (0–10], (10–20], etc. Within each bin, we calculate the percent of cases that completed the survey by the end of the field period.
To address our research questions about interviewer effects and the impact of call, case, and interviewer characteristics, we use multilevel regression models to predict the response likelihood ratings. The first level in these models is the calls themselves, and the second is the interviewers. The calls are also grouped into cases, which are crossed with interviewers. However, because the analy-sis data set contains only calls that resulted in contact but not cooperation, a majority of the cases (58 percent) appear only once in the analysis data set, and thus estimation of a case-level random effect is inappropriate (Hox 1998).
We first estimate the empty model, containing no independent variables, to examine the effect of the clustering of calls within interviewers. The model is
Ratingij = αj + εij
αj ~ N(α, σ2int),
where i indexes the calls and j the interviewers. The intraclass correlation coefficient (ICC) in this model is the ratio of the variance in the interviewer intercepts (σint
2) to the total variance in the ratings. An ICC that is significantly different from zero indicates interviewer effects in the ratings.3
The full model adds independent variables for call, case, and interviewer characteristics. For each call, the model includes characteristics such as the sequence number of the call to the case (first call, second call, etc.) and the
2. By cooperation rate, we simply mean the fraction of cases in our analysis data set completing the study. Because our data set includes only contacted cases that did not provide an interview on the first call, we do not use an AAPOR cooperation rate.
3. We evaluate the significance of the ICC using the method developed by Hedges, Hedberg, and Kuyper (2012).
at Jordan University of Science and Technology on July 26, 2016
http://poq.oxfordjournals.org/
outcome of the call (refusal, appointment, etc.). An interviewer’s experience on the call placed just prior may also affect how he or she rates the current call; therefore, indicators of these outcomes are included in the model.4 Case
characteristics, such as whether the case had previously refused to participate and whether the case ever cooperated, are also included. (A list of all variables considered as predictors is given in appendix B.)
Interviewer characteristics come from the interviewer questionnaire, which collected demographic information and opinions. Eight questions captured interviewers’ expectations about refusal conversion, all using a four-point response scale from “strongly agree” to “strongly disagree.” Those who expect refusal conversion to be easier may give higher ratings to cases ending in refusal. To test this in the model, we include a factor score summarizing the responses to all eight questions. The factor ranges from −1.72 to 2.07, with a mean across the thirty-four interviewers of zero. See appendix C for details on the development of the factor score. Since more successful interviewers may be more likely to give higher ratings, the models include the percent of all calls handled by an interviewer that resulted in cooperation. Also included is the number of months of interviewing experience, which ranged in this study from thirteen to 300.5
Results
Before we begin to answer our research questions, we first explore the ratings overall. Figure 1 shows the distribution of the likelihood ratings assigned by the interviewers to the 6,892 calls resulting in contact. The mean rating was 24.8, and the median was 10. The modal rating is zero, and nearly all of the calls rated as zero ended with a refusal. We see quite a bit of rounding: 73 percent of all ratings are multiples of ten, and 88 percent are multiples of five.
DO LIKELIHOOD RATINGS MATCH COOPERATION RATES?
Figure 2 displays the relationship between the average likelihood rating of
each case, in bins by ten, and the cooperation rate among the cases in that bin. The first point on the left in this graph shows the cases with an average rating of zero. There are 961 such cases, and fewer than three percent completed the interview. The percent of cases within each bin that eventually cooperated increases steadily from the (0,10] to the (80,90] bin. The cooperation rate in the last bin is lower, but the group size is also quite small.
4. The inclusion of these lagged variables causes the case base to decrease slightly, from 6,892 to 6,883. We use this smaller data set to estimate both models.
5. We considered alternative models such as the poisson and negative binomial, which did not change the substantive conclusions. We also assssed model diagnostics and nonlinear relation-ships between the predictor variables and the ratings (results not shown).
at Jordan University of Science and Technology on July 26, 2016
http://poq.oxfordjournals.org/
Figure 2 shows broad agreement between the ratings and the observed rate of completion. However, it also demonstrates that the ratings cannot be inter-preted literally: In the (50,60] group, for example, only 19.1 percent of the cases cooperated, a rate quite a bit lower than that suggested by the average of the interviewer-assigned ratings.
0
10
20
30
40
Pct. Cooperative Cases
0
(0,10] (10,20] (20,30] (30,40] (40,50] (50,60] (60,70] (70,80] (80,90]
(90,100]
Average Rating
Figure 2. Cooperation Rates by Average Rating, Size of Circle Proportional to Number of Cases.
0
500
1000
1500
2000
Number of Calls
0 20 40 60 80 100
Rating
Figure 1. Distribution of Ratings on Calls Ending in Contact.
at Jordan University of Science and Technology on July 26, 2016
http://poq.oxfordjournals.org/
IS THERE EVIDENCE OF INTERVIEWER EFFECTS IN RATINGS?
Interviewer variance may arise if different interviewers use different methods to make the ratings. We find evidence for an interviewer effect in the multilevel regression model without any independent variables. The ICC for interview-ers is 9.2 percent and significant (SE = 2.2 percentage points). Interviewer effects in this rating should not be surprising, given their ubiquity in other stages of the survey process such as coding, response collection, respondent recruitment, and frame creation (O’Muircheartaigh and Marckward 1980;
Campanelli, Sturgis, and Purdon 1997; O’Muircheartaigh and Campanelli
1999; Schnell and Kreuter 2005; West and Olson 2010; Eckman forthcoming).
WHAT FACTORS AFFECT WILLINGNESS RATINGS?
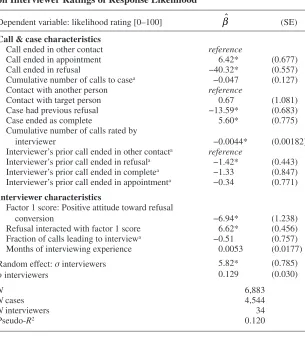
The model shown in table 1 adds several explanatory variables to discern the call, case, and interviewer characteristics that influenced the ratings that the interviewers assigned. The ICC in this model is still significant (ρint= 12.9
percent, SE = 3.0 percentage points), indicating that even after controlling for these characteristics, unexplained variance due to the interviewers remains.
The call outcome correlates as expected with the assigned rating: An appointment is associated with a 6.4-point higher rating, on a scale from zero to 100, and a refusal with a 40.3-point lower rating, relative to contacts with other outcomes. Additional calls, and reaching the selected target respondent, however, have no significant effect on the rating.
Contacts with cases that refused on a previous call were given lower ratings (β = −13.6). As shown in figure 2, contacts with those cases that did eventu-ally cooperate were given ratings that were 5.6 points higher, indicating a relationship—though not a strong one—between the true response likelihood and the interviewers’ ratings. These results are sensible and in the expected directions.
Each additional call rated by the interviewers has a very small, but signifi-cant, negative effect on the rating (β = −0.0044), as if interviewers become more pessimistic with each additional call that they place. Note that the model controls for the number of calls to the case, so this estimated coefficient should capture only the effect of repeated ratings on the interviewer herself, not the changing case base over the course of data collection. The outcome of the previous call also correlates with the rating—interviewers whose previous call ended in a refusal give ratings that are 1.4 points lower than those whose previ-ous call ended with another outcome. It seems as if a refusal on the prior call creates some pessimism about the current case.
The next section of the table shows the independent variables relating to the interviewers. The higher an interviewer’s score on the factor relating to optimism about refusal conversion, the lower the rating she assigns to calls with non-refusal outcomes (β = −6.9), but the higher the rating she assigns to calls with refusal outcomes (β = 6.6). While a refusal outcome on a call
at Jordan University of Science and Technology on July 26, 2016
http://poq.oxfordjournals.org/
Table 1. Influences of Call, Case, and Interviewer Characteristics on Interviewer Ratings of Response Likelihood
Dependent variable: likelihood rating [0–100] β (SE)
Call & case characteristics
Call ended in other contact reference
Call ended in appointment 6.42* (0.677)
Call ended in refusal −40.32* (0.557)
Cumulative number of calls to casea −0.047 (0.127) Contact with another person reference
Contact with target person 0.67 (1.081) Case had previous refusal −13.59* (0.683)
Case ended as complete 5.60* (0.775)
Cumulative number of calls rated by
interviewer −0.0044* (0.00182)
Interviewer’s prior call ended in other contacta reference
Interviewer’s prior call ended in refusala −1.42* (0.443) Interviewer’s prior call ended in completea −1.33 (0.847) Interviewer’s prior call ended in appointmenta −0.34 (0.771)
Interviewer characteristics
Factor 1 score: Positive attitude toward refusal
conversion −6.94* (1.238)
Refusal interacted with factor 1 score 6.62* (0.456) Fraction of calls leading to interviewa −0.51 (0.757) Months of interviewing experience 0.0053 (0.0177) Random effect: σ interviewers 5.82* (0.785)
ρ interviewers 0.129 (0.030)
N 6,883
N cases 4,544
N interviewers 34
Pseudo-R2 0.120
Note.—Standard errors in parentheses. Estimates of constant not displayed. *p < 0.05
a Calculated on larger data set of all rated calls (n = 11,251).
has a large negative influence on all interviewers, those who believe refusal conversion is more appropriate tend to give higher ratings to refusal calls. Interviewers with higher success rates (the fraction of all calls leading to an interview) do not give different ratings, and neither do those with more experience.
Discussion
There is much more information passed between interviewers and respond-ents than is contained in the final case dispositions and call-record data. In a
at Jordan University of Science and Technology on July 26, 2016
http://poq.oxfordjournals.org/
telephone survey, interviewers can listen to a respondent’s tone, or hear some-thing in the background, to judge whether “I’m too busy” or “Call another time” means that another call might be successful or is really a polite way to indicate a refusal. This study has captured and summarized such information by asking interviewers to rate how likely each case is to eventually cooperate. Interviewers’ ratings are correlated with cooperation. Call, case, and inter-viewer characteristics correlate with the ratings in largely expected directions. However, the ratings are also subject to random variation across interviewers. Additional experience in making the ratings, or further training, may be able to reduce this variability. Statistical methods could also be used to reduce the influence of interviewer variability on the ratings. Random effects models, such as the model we fit above, can produce empirical best linear unbiased predictions of individual interviewers’ random effects on the ratings (West,
Welch, and Galecki 2007, p. 45), and these could be removed from the ratings
before they are used in nonresponse adjustments.
The investigations presented here are exploratory, and more research is needed. To improve the quality of the ratings, we suggest that future surveys test alternative scales, such as reducing the scale to five or ten points, and conduct debriefings with the interviewers to better understand how they make the ratings. We also encourage testing whether interviewer perceptions of response likelihood can influence interviewer behavior during recruitment, as
Kennickell (2012) argues, and whether the process of making the observations
changes interviewers’ perceptions, as suggested by some of the findings in our model. Finally, future studies should explore whether these ratings can play a role in directing fieldwork efforts, along the lines suggested by the respon-sive design framework (Groves and Heeringa 2006). For example, effort could be directed toward cases with high average (or recent) likelihood ratings to reduce data-collection costs. We encourage future studies of likelihood ratings in both telephone and face-to-face modes.
Appendix A. Survey Details
The topic of the survey was the use of computers, mobile phones, and other devices for reading online and digital text. The gross sample of 9,175 German landline telephone numbers was nationally representative and geographically stratified. The target population was all adults living in Germany. Mobile phone numbers were excluded from the frame due to the costs of dialing such numbers, and thus adults without landline telephones were undercovered in this study. After contacting a household, the interviewer used a Kish algorithm to select one person to participate in the survey (Kish 1965, Section 11.3B). The interview lasted just over seven minutes, and 1,002 interviews were com-pleted. The AAPOR RR1 response rate was 13 percent (American Association
for Public Opinion Research 2011).
at Jordan University of Science and Technology on July 26, 2016
http://poq.oxfordjournals.org/
Over 28,000 calls were placed to the selected numbers, and 11,251 calls were rated. The analysis in the body of the paper uses only likelihood ratings assigned on the 6,892 calls resulting in contact, because the ratings are more meaningful if the interviewer spoke to someone. For completeness, figure 3 shows all of the ratings assigned in this study (n = 11,251).
The mean rating was 29.4, and the median was 20. The modal rating was zero, 25.2 percent of all ratings. Many of these calls resulted in fax machines (27.9 percent of all calls with zero ratings), followed by calls where the respondent hung up during the introduction (17.5 percent of these calls). Only 3.4 percent of these calls resulted in contact with a selected respondent. The second most commonly used rating in the study was 50: 23.6 percent of all ratings have this score. Interviewers seem to use this score to indicate “don’t know,” as previous research with probability scales has shown (Fischhoff and
Bruine de Bruin 1999). The majority of the calls given ratings of 50 (65.6
percent) ended with answering machines. Only 347 calls (3.1 percent of all calls rated) received likelihood ratings of 100. (Remember that calls resulting in completed interviews were not rated.) Again, most of these were answering machines (62.0 percent). Hard appointments were also common in this group: 11.2 percent of all calls with ratings of 100.
Appendix B. Available Variables for Random Effects Model
Below is a complete list of the variables we considered as predictors in the model shown in table 1. The final model retains the variables that were significant as well as those that we felt were interesting because they were not significant.
0
1000
2000
3000
Number of Calls
0 20 40 60 80 100
Rating
Figure 3. Distribution of All Ratings.
at Jordan University of Science and Technology on July 26, 2016
http://poq.oxfordjournals.org/
• Call level: Call ended in other contact; Call ended in appointment; Call ended in refusal; Cumulative number of calls to case; Contact with tar-get person; Case had previous refusal; Interviewer’s prior call ended in a refusal; Interviewer’s prior call ended in a complete; Interviewer’s prior call ended in an appointment; Interviewer’s prior call ended in other con-tact; Day of week of call; Time of call; Whether interviewer had called this case before.
• Case level: Case cooperated; Case ever refused; Case ended as refusal.
• Interviewer level: factor 1 score; factor 2 score; Refusal interacted with factor 1 score; Refusal interacted with factor 2 score; Fraction of calls leading to interview; Months of interviewing experience; Cumulative number of calls rated by interviewer; Interviewer gender; Interviewer age; Interviewer nationality (German vs. non-German); Big 5 neuroticism; Big 5 openness; Big 5 extroversion; Big 5 agreeableness; Big 5 consci-entiousness; Interviewer’s family receives income support; Interviewer is currently a student; Importance of pay as interviewer; Satisfaction with pay as interviewer.
Appendix C. Factor Analysis
The interviewer questionnaire contained a section of eight items relating to interviewer beliefs and opinions regarding respondent recruitment and refusal conversion. The statements were introduced with this statement:
Sample persons have different reactions to the request to participate in a study: Some agree easily; others hesitate or refuse immediately. In the fol-lowing statements, please tell us your opinion as an experienced interviewer.
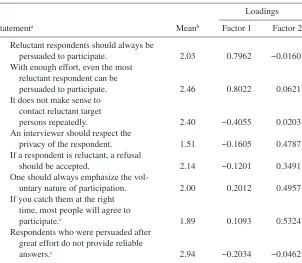
The wording of the eight statements is given in table 2.6 The response scale for
each statement ranged from 1 (strongly agree) to 4 (strongly disagree). Two interviewers responded “don’t know” to one of the eight statements, for a total of two missing values. Modal imputation was used to fill in these responses.
The eight variables could not all be included in the regression model, due to multicollinearity. Instead, the model contains the first factor from a factor analysis of all eight responses. The factor analysis was run in Stata using prin-cipal factor extraction and orthogonal rotation (StataCorp 2011a,b). Based on the eigenvalues from the factor analysis, we retained two factors. The first captures 55 percent of the total variance in the eight items, and the second an
6. Translation from German into English by Blom and Korbmacher (2013) and the authors. The text of the introduction and statements was based on the interviewer questionnaire developed by attendees of the International Workshop on Household Survey Nonresponse in Nuremberg, Germany, in 2010.
at Jordan University of Science and Technology on July 26, 2016
http://poq.oxfordjournals.org/
additional 31 percent. Table 2 gives the mean response given by the interview-ers and the loadings on the two factors. Cronbach’s alpha for all eight items is 0.53. For the three items loading mostly strongly on factor 1, it is 0.68, and for those four items loading on factor 2, it is 0.49.
Factor 1 captures interviewers’ optimistic attitudes toward refusal conversion efforts: Questions 1, 2, and 3 load most strongly on this factor. Factor 2 is less clear but seems to represent respect for the respondent: Questions 4, 5, 6, and 7 load on this factor. The eighth question does not load onto either factor. Only the first factor was significant in our model predicting the likelihood ratings.
References
American Association for Public Opinion Research. 2011. Standard Definitions: Final Dispositions of Case Codes and Outcome Rates for Surveys. 7th ed. http://www.aapor.org/Resources.htm.
Table 2. Factor Analysis of Items Relating to Interviewers’ Attitudes Toward Cooperation and Refusal Conversion
Statementa
Loadings
Meanb Factor 1 Factor 2
1 Reluctant respondents should always be
persuaded to participate. 2.03 0.7962 −0.0160 2 With enough effort, even the most
reluctant respondent can be
persuaded to participate. 2.46 0.8022 0.0621 3 It does not make sense to
contact reluctant target
persons repeatedly. 2.40 −0.4055 0.0203 4 An interviewer should respect the
privacy of the respondent. 1.51 −0.1605 0.4787 5 If a respondent is reluctant, a refusal
should be accepted. 2.14 −0.1201 0.3491 6 One should always emphasize the
vol-untary nature of participation. 2.00 0.2012 0.4957 7 If you catch them at the right
time, most people will agree to
participate.c 1.89 0.1093 0.5324
8 Respondents who were persuaded after great effort do not provide reliable
answers.c 2.94 −0.2034 −0.0462
Note.—Order of questions in the table does not reflect the order in the questionnaire. aTranslation from German into English by Blom and Korbmacher (2013) and the authors. bResponse scale from 1 to 4, where 1 meant strongly agree and 4 meant strongly disagree. cOne missing value prior to imputation.
at Jordan University of Science and Technology on July 26, 2016
http://poq.oxfordjournals.org/
Blom, Annelies, and Julie Korbmacher. 2013. “Measuring Interviewer Characteristics Pertinent to Social Surveys: A Conceptual Framework.” Survey Methods: Insights from the Field. http:// surveyinsights.org/?p=817.
Campanelli, Pamela C., Patricia Sturgis, and Susan Purdon. 1997. Can You Hear Me Knocking: An Investigation into the Impact of Interviewers on Survey Response Rates. London: National Centre for Social Research.
Eckman, Stephanie. Forthcoming. “Do Different Listers Make the Same Housing Unit Frame? Variability in Housing Unit Listing.” Journal of Official Statistics.
Fischhoff, Baruch, and Wändi Bruine de Bruin. 1999. “Fifty-Fifty = 50%?” Journal of Behavioral
Decision Making 12:149–63.
Groves, Robert, and Steven Heeringa. 2006. “Responsive Design for Household Surveys: Tools for Actively Controlling Survey Errors and Costs.” Journal of the Royal Statistical Society: Series A (Statistics in Society) 169:439–57.
Hedges, Larry V., Eric C. Hedberg, and Arend M. Kuyper. 2012. “The Variance of Intraclass Correlations in Three- and Four-Level Models.” Educational and Psychological
Measurement 72:893–909.
Hox, Joop. 1998. “Multilevel Modeling: When and Why.” In Classification, Data Analysis, and
Data Highways, edited by Ingo Balderjahn, Rudolph Mathar, and Martin Schader, 147–54.
New York: Springer-Verlag.
Hox, Joop, and Edith de Leeuw. 2002. “The Influence of Interviewers’ Attitude and Behavior on Household Survey Nonresponse: An International Comparison.” In Survey Nonresponse, edited by Robert Groves, Don Dillman, John Eltinge, and Roderick Little, 103–18. New York: Wiley. Kennickell, Arthur B. 2012. “What’s the Chance? Interviewers’ Expectations of Response in the
2010 SCF.” In Proceedings of the Section on Survey Research Methods, American Statistical Association.
Kish, Leslie. 1965. Survey Sampling. New York: Wiley.
Mahalanobis, Prasanta. 1946. “Recent Experiments in Statistical Sampling in the Indian Statistical Institute.” Journal of the Royal Statistical Society: Series A (Statistics in Society) 109:325–70. Olson, Kristen, Jennifer Sinibaldi, and James Lepkowski. 2006. “Analysis of a New Form of
Contact Observations: How Does It Compare to the Traditional?” Paper presented at the Midwestern Association for Public Opinion Research Conference, Chicago.
O’Muircheartaigh, Colm, and Pamela Campanelli. 1999. “A Multilevel Exploration of the Role of Interviewers in Survey Non-Response.” Journal of the Royal Statistical Society: Series A (Statistics in Society) 162:437–46.
O’Muircheartaigh, Colm, and Albert Marckward. 1980. “An Assessment of the Reliability of World Fertility Study Data.” Proceedings of the World Fertility Survey Conference Record of
Proceedings 3:305–79.
Schnell, Rainer, and Frauke Kreuter. 2005. “Separating Interviewer and Sampling-Point Effects.”
Journal of Official Statistics 21:389–410.
Singer, Eleanor, Martin Frankel, and Marc Glassman. 1983. “The Effect of Interviewer Characteristics and Expectations on Response.” Public Opinion Quarterly 47:68–83.
Sinibaldi, Jennifer, Gabriele Durrant, and Frauke Kreuter. 2013. “Evaluating the Measurement Error of Interviewer Observed Paradata.” Public Opinion Quarterly 77(S1):173–93.
StataCorp. 2011a. Stata 12 Multivariate Statistics Reference Manual. College Station, TX: StataCorp LP.
StataCorp. 2011b. Stata Statistical Software: Release 12. College Station, TX: StataCorp LP. Wagner, James, and Heidi Guyer. 2005. “Statistical Propensity Models to Predict Likelihood of
Survey Response Compared to Interviewer Judgments of Likelihood of Response.” Paper pre-sented at the Midwestern Association for Public Opinion Research Conference, Chicago. West, Brady, and Kristen Olson. 2010. “How Much of Interviewer Variance Is Really Nonresponse
Error Variance?” Public Opinion Quarterly 74:1027–45.
West, Brady, Kathleen Welch, and Andrzej Galecki. 2007. Linear Mixed Models. Boca Raton, FL: Chapman & Hall/CRC.
at Jordan University of Science and Technology on July 26, 2016
http://poq.oxfordjournals.org/