Journal Homepage: www.jitecs.ub.ac.id
Extreme Learning Machine Weights Optimization Using
Genetic Algorithm In Electrical Load Forecasting
Vina Meilia1, Budi Darma Setiawan2, Nurudin Santoso3 1,2,3
Faculty of Computer Science, Brawijaya University, 65145 – Malang, East Java, Indonesia
1
[email protected], [email protected], [email protected]
Received 31 July 2018; accepted 06 August 2018
Abstract. The growth of electrical consumers in Indonesia continues to increases every year, but it is not matched by the provision of adequate infrastructure that available. This causes the available electrical capacity can't fulfill the demand for electricity. In this study, a smart computing system is build to solves the problem. Electrical load data per hour is being used as an input to do the electrical load forecasting with Extreme Learning Machine method. Extreme Learning Machine method uses random input weight within range -1 to 1. Before the forecasting process is ran, Genetic Algorithms is used to optimize the input weight. According to the test results with weight optimization, MAPE average error rate is 0.799% while without weight optimization the rate rise to 1.1807%. Thus this study implies that Extreme Learning Machine (ELM) method with weight optimization using Genetic Algorithm (GA) can be used in electrical load forecasting problem and give better forecasting result.
Keyword
:
Extreme learning machine, genetic algorithm, forecasting, electricity1
Introduction
Consumers of electricity in Indonesia continues to experience increased every year. Based on statistical data in 2016, the total number of subscribers reached 61,167,980. Compared to the year 2014 the increase happened amounted to 6.39%. The high increase is not matched by the provision of adequate infrastructure, so the available electrical capacity can't fulfill the demand for electricity. The power plant that overloaded can lead to power outages. With the addition of a new power plant will be able to overcome it, but it takes a lot of costs. So, as an anticipation Indonesia Electricity Corporation (PT.PLN) do operations management system. Operation management system is the planning of operation which includes planning the distribution and generation to achieve an economical, reliable, and qualified operation systems.
systems [2]. ELM that also has known as Single-Hidden Layer Feedforward Neural Networks (SLFNs) only have one hidden layer and has a learning accuracy higher than other algorithms such as Backpropagation. Its because to determine the input weight and bias, ELM using a randomized number. But, according to Alencar, et al. in 2016 [3] the determination of random numbers can cause poor generalization due to the formation of hidden neurons with large numbers. Moreover, it can take more time and the value generated is not an optimal results. Thus, the solution of these problems found by way of combining the Genetic Algorithms with ELM method to get the value of the input weights with optimal results.
A genetic algorithm is a method for searching optimal solutions by conducting an approach adapted from Darwin's theory of evolution. This method is has used late in life. With the generation of random numbers for searching the optimal solution, this method is able to provide the optimal solution to a complex and complicated problem. A similar study using the same method and different objects never done before. As in research conducted by Wang, et al. in 2016[5]. They conducted research wind power using Genetic Algorithm and ELM. On the experiment, the optimize value are hidden node, bias, and the coefficient of regular. And the result is, with combining this method delivers higher accuracy and a better generalization ability [4].
This research objective is to evaluate the parameter and performance of combination between these two method on forecasting the electricity load.
2
Electricity Load Data
PT. PLN is the biggest electric power provider in Indonesia. Over the Growth of technology that requires electrical energy is increasing, causing the existence of PLN much needed by the whole society. As a provider of electricity PLN has always tried to provide electrical energy consumption according to the needs of electricity, it referred to electrical load. Any equipment that is connecting to the power system and consume electric energy can be called electrical loads. While large or whether the load is dependent on the intensity of use of electrical equipment. The appropriate fulfillment of efforts is necessary, to avoid a deficit of electrical energy and to avoid a blackout.
3
Extreme Learning Machine
Extreme Learning Machine (ELM) is an improved artificial neural network (ANN) method invented by Huang, Zhu, and Siew in 2004 [1]. ELM commonly called as Single Hidden Layer Feedforward Neural Networks (SLNFs) and used as solution from learning speed found in ANN feed forward. This method is able to provide a more stable prediction results with faster time compared to the usual feedforward network by using just one hidden layer and randomly generated the process of determining its parameters.
According to Fig. 1 ELM has a 3 layer structure, namely input layer, hidder layer, and output layer. Each node in every layer is mutually linked with weights that have different values and connected into one output [5].
The steps of Extreme Learning Machine are explained below [1]:
3.1 Initial Weight and Biased Initialization
Initial weight generation (Wjk) randomly ranged from -1 until 1 and biased value
b ranged from 0 until 1. k index indicates the amount of nodes of the input layer while
j indicates the amount of hidden layer nodes.
3.2 Calculating the Output Hidden Layer
The formula below shows how to calculate the input matrix for hidden layer (Hinit).
𝐻𝑖𝑛𝑖𝑡(!)=𝑋(!) × 𝑊!+𝑏 (1)
𝑋(!) = data input i
𝑊! = transposed input weight 𝑏 = bias vector
3.3 Sigmoid Activation
Sigmoid Biner activation function is used to map the previous input for hidden neuron results value. Sigmoid Biner activation function is a non linier function which output value ranged from 0 to 1.
𝐻(!,!)=
!
(! ! !"#!!"#"$(!,!)) (2) 𝐻 = hidden layer output matrix
3.4 Calculating the Moore-Penrose Pseudo Inverse Matrix
Moore-Penrose Pseudo Inverse matrix is being used to find the most unique solution from the linier function.
𝐻!
=( 𝐻!
𝐻)!! 𝐻! (3)
𝐻 = hidden layer output matrix
𝐻!
= moore-penrose pseudo inverse 𝐻! = matrix H transpose
This process is done to connect the hidden layer and the output layer and get the output weight value.
𝛽=𝐻!
𝑇 (4)
𝛽 = output weight matrix
𝐻! = moore-penrose pseudo inverse matrix 𝑇 = target matrix
3.6 Calculating the Forecasting Results
The weight (W and 𝛽) now can be used to calculate the forecasting. The forecasting results is calculated using equation (5)
Ŷ=𝐻𝛽 (5)
Ŷ = forecasting results 𝛽 = output weight
𝐻 = output hidden layer matrix from equation (2)
4
Genetic Algorithm
Genetic algorithm is an optimization technique that adapting biological evolution process and able to give solutions to complex problems. This algorithm is first introduced by John Holland in 1975. In addition to its ability to solve daily problems like choosing the best composition of fodder [6], this algorithm have been applied in a lot of fields like economics, physics, sociology, and so on.
Genetics algorithm is stochastic, in which it can produce different solution whenever generated [7]. This algorithm use a lot of genetic terms like genes, individual, and chromosome because it was adopted from biological genetics.
4.1 Chromosome Representation and Initialization
Chromosome initialization is done by generating set of solutions randomly with real number as a representation.The length generated is depend on the amount of genes in one chromosome. If there are 5 genes in one chromosome then the length of chromosome is 5. In our case, we used 5 previous consecutive data to forecast the next electricity load. It means we need 5 input neurons for the input layer. Furthermore, we use 3 neurons in hidden one hidden layer. So since it is fully connected neuron, we have 15 weight values which connected all input neuron to all hidden neuron. These weights will be generated using The Genetic Algorithm so we need 15 genes for each of our chromosome.
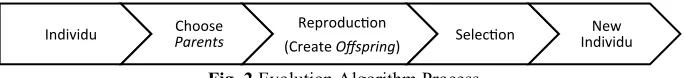
4.2 Reproduction
Individu Choose Parents Reproduc1on
(Create Offspring) Selec1on
New Individu
After we generate some chromosomes, the next step is to reproduce to get an offspring. There are 2 reproduction processes needed to be done, the crossoverand mutation. Values of cr (crossover rate) and mr (mutation rate) have to be decided first. These values have a role as parametres to determine offspring ratio that should be generated. The offspring value is obtained by multiplying cr/mr value by the population size.
1. Crossover (Extended Intermediate Crossover)
The crossover process involves two parents whose randomly chosen to generating new chromosome. It will then generating alpha (α) value randomly ranging between
-0,25 until 1,25. After that the alpha value will be inserted to Formula 6.
𝐶 1 =𝑃 1 + α P 2 −𝑃 1
𝐶 2 =𝑃 2 + α P 1 −𝑃 2 (6)
C 1 = Parent 1 crossover result
C(2) = Parent 2 crossover result
P(1) = Parent1
P(2) = Parent2
2. Random Mutation
Different from crossoverwhich need two parents to do the process, mutation only need one parent. This parent is also chosen randomly. The goal of mutation process is to keep the diversity of population [8]. Then one gene value from the chosen chromosome is selected randomly to be changed using equation (7).
𝑥!=𝑥+𝑟(𝑚𝑎𝑥!− 𝑚𝑖𝑛!) (7)
𝑥′ = new gene value
𝑥 = old gene value
r = random value between -0.1 and 0.1
𝑚𝑎𝑥! = maximum possible value for selectedgene
𝑚𝑖𝑛! = minimum possible value for selectedgene
4.3Evaluation
Evaluation is used to assess the feasibility of individual or chromosome that are generated from previous process. We calculate the value of each individu using fitness value in equation (8). But before that, hard constrain checking is done before calculating the fitness value. Hard constraint is a condition when the value of a solution is beyond the limit or initial range that has been decided before. When we do an optimization, constraint is a must to make sure a solution didn’t pass beyond the limit [9].
𝑓 𝑥 = !
(! ! !"#$!"#) (8)
MAPE is Mean Absolute Percentage Error, which calculate absolute error from all of training data when they are applied to ELM using weight in the chromosome. MAPE is calculated using equation (9).
Selection is the last step of genetics algorithm, and use to choose the best individual that can survive until the next generation. Using elitism selection method, individuals sort from the largest according to their fitness value. Then 30% of the population with lowest fitness value to be processed in the next generation [8].
5
GA-ELM
Determination of variables such as the initial weights and biases found in the ELM done in random. It causes the results obtained is not necessarily optimal. Therefore, the genetic algorithm is present as a solution to these problems for optimizing initial weights so that the value of the forecasting always could gives optimum results. The GA-ELM algorithm follows these steps:
Step 1 initialize the number of population size, the number of generations, the value
of the cr, and the value of mr.
Step 2 Create some random new chromosomes as much as population size.
Step 3 Select random chromosome/s for reproduction process which are crossover
and mutation. Then put the offspring altogether with the current population.
Step 4 Evaluate each chromosome by using it as an initial input weights on ELM to
obtain the value of its accuracy (calculate MAPE and fitness value).
Step 5 Select a number of chromosome as much as population size, which have
higher fitness from the others to pass through to the next generation.
Step 6 Repeat the steps 3 to 5, until getting enough individuals and reach maximum
generation.
Step 7 In the last generation we choose the best chromosomes, then do the process
on ELM to see the forecasting outcome.
a. Calculate the input hidden layer with the training data. b. Activate the matrix using the sigmoid binary.
c. Calculate the moore-penrose pseudo invers matrix. d. Calculate the output weight.
Step 8 Still in ELM process, do the testing process:
a. Calculate the input hidden layer with the testing data. b. Activate the matrix using the sigmoid binary.
6
Testing And Result
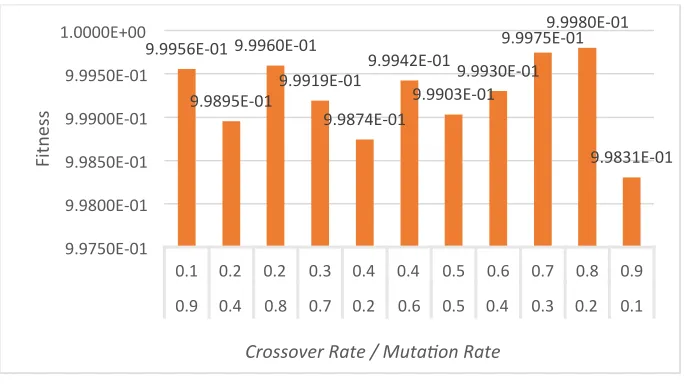
6.1 Crossover Rate (Cr) & Mutation Rate (Mr) Combination Testing
Combination testing between crossover rate and mutation rateaims to get cr and mr combinaton value that give the most optimal in which has the smallest fitness value. The result of combination testing between crossover rate and mutation rate is shown in Fig. 3, according to that the fitness value is unstable, it is caused by randomly generated value made in everytime we run the process. From figure 3, we get the highest fitness value is generated from the combination of cr value of 0.8 and mr value of 0.2 with fitness average value of 9.998x10⁻¹.
From the processes above we can conclude that crossover produce more offspring than mutation process. But if the cr and mr value is the same then the result won’t be optimal. Some previous research use a higher cr value. According to [11] it is caused by the focus of crossover to find new indivuals and expanding the searching area.
There are conditions where a solution searching process is stuck between local optimum caused by a premature convergence. A premature convergence may happen when only individual with best fitness value is being chosen result in solution search in just one area and not exploring the other options. To resolve the problem with lowest probabilities, mutation process can be used because it requires just one genes to me modified to provide offspring result. Thus the probabilities is either making individual with good fitness value or change it for the worse [10].
Fig. 3 Average fitness result of cr and mr Combination Testing
means there just a few influence of number of generation to cr and mr value. Therefore, to determine the number of generations to be used in the next step, population size testing, can be done by taking the highest generations value obtained from the overall combination testing between cr and mr.
In this test, the highest generation value is 95, which means that from 100 generations, the most optimal solution is found in the 95th generation. The highest generation value can be used as the ideal generation value to find the most optimal solution searching. The more generation value use the longer it takes to do the computation [8]. Thus, if we can find the best solution in the 95th generation, testing more than 95 generation is just a waste of time.
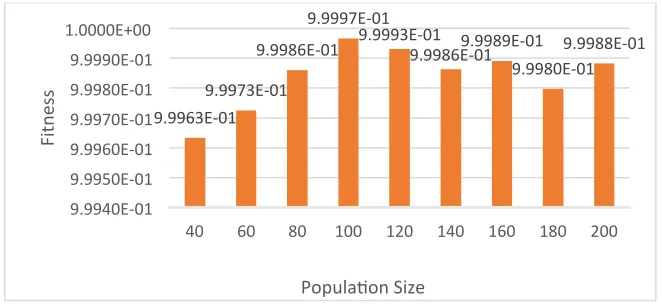
6.2 Population Size Testing
Population size testing is done to get the value that gives the most optimal solution with the best fitness value. The results of population size testing is shown in Fig. 4. According to that higher population size did not always provide the most optimal fitness value. The instability that occurs can be caused by the random value generated every time the process started. In this research, the lowest fitness average value is obtained on population size value of 40. Meanwhile the highest and the most optimal fitness average value is obtained on population size value of 100 with fitness value of 9.997x10⁻¹. fitness value increase between range 40 until 100, but become unstable again once the population size pass beyond 100. Larger population data makes the exploration range grows bigger thus slowing the calculation process [8].
Fig. 4 Average fitness of population size testing
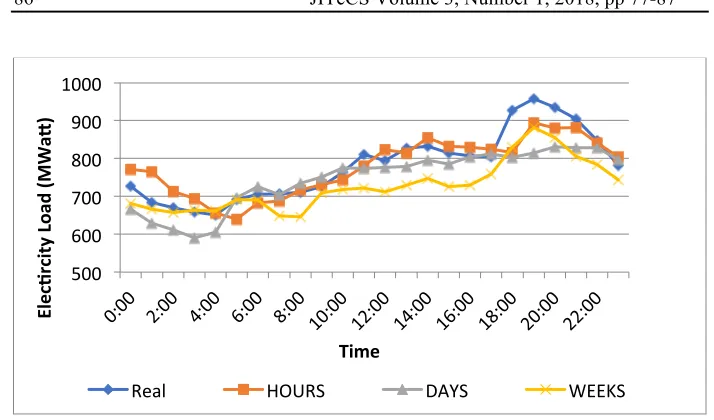
6.3 Electrical Load Data Testing
Electrical load data testing is being done to find the pattern that gives the best fitness value. This testing will be using the same data but with different input pattern. Input patterns that will be tested is sorted by hours, days, and weeks.
1. Input pattern by hours
Input data used is electrical load data from the previous 5 days (at the same hour) to forecast the next day electrical load at the same hour.
3. Input pattern by weeks
Input data used is electrical load data from the previous 5 weeks (at the same hour) to forecast the next week electrical load in the same day and hour.
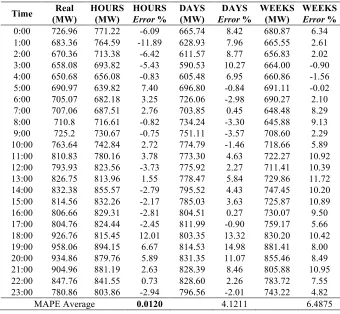
Using the combination of cr and mr value as the parametres, we get the population size and the best generation from the first and second testing. The result of electrical load data testing in December 24th, 2016 shown in Table 3.
From Table 3 and Figure 5, we see that the best MAPE average results value is 0.0120% and electric load forecasting obtained using pattern input based on the previous 5 hours data. We can conclude that shorten the time range can increase the level of accuracy obtained.
Table 1 Electrical Load Data Testing Results
Time Real HOURS HOURS DAYS DAYS WEEKS WEEKS
(MW) (MW) Error % (MW) Error % (MW) Error %
0:00 726.96 771.22 -6.09 665.74 8.42 680.87 6.34 1:00 683.36 764.59 -11.89 628.93 7.96 665.55 2.61 2:00 670.36 713.38 -6.42 611.57 8.77 656.83 2.02 3:00 658.08 693.82 -5.43 590.53 10.27 664.00 -0.90 4:00 650.68 656.08 -0.83 605.48 6.95 660.86 -1.56 5:00 690.97 639.82 7.40 696.80 -0.84 691.11 -0.02 6:00 705.07 682.18 3.25 726.06 -2.98 690.27 2.10 7:00 707.06 687.51 2.76 703.85 0.45 648.48 8.29 8:00 710.8 716.61 -0.82 734.24 -3.30 645.88 9.13 9:00 725.2 730.67 -0.75 751.11 -3.57 708.60 2.29 10:00 763.64 742.84 2.72 774.79 -1.46 718.66 5.89 11:00 810.83 780.16 3.78 773.30 4.63 722.27 10.92 12:00 793.93 823.56 -3.73 775.92 2.27 711.41 10.39 13:00 826.75 813.96 1.55 778.47 5.84 729.86 11.72 14:00 832.38 855.57 -2.79 795.52 4.43 747.45 10.20 15:00 814.56 832.26 -2.17 785.03 3.63 725.87 10.89 16:00 806.66 829.31 -2.81 804.51 0.27 730.07 9.50 17:00 804.76 824.44 -2.45 811.99 -0.90 759.17 5.66 18:00 926.76 815.45 12.01 803.35 13.32 830.20 10.42 19:00 958.06 894.15 6.67 814.53 14.98 881.41 8.00 20:00 934.86 879.76 5.89 831.35 11.07 855.46 8.49 21:00 904.96 881.19 2.63 828.39 8.46 805.88 10.95 22:00 847.76 841.55 0.73 828.60 2.26 783.72 7.55 23:00 780.86 803.86 -2.94 796.56 -2.01 743.22 4.82
Fig. 5 Electrical Load Data Testing
7
Conclusion and Future Work
From the discussion above, we can conclude that genetic algorithm is capable of doing the weights optimization in extreme learning machine methods properly. Parameters in genetic algorithm can affect the accuration rate and time needed to do the computation in extreme learning machine method. According to the test results, the most optimal cr and mr combination value are 0.8 and 0.2, the most optimal Population size is 100 and the best value from the electrical load data testing is 0.0120% obtained from input pattern data by hours.
MAPE average value after weight optimization is 0.7996% while MAPE average value without optimization is 1.1807%. The results shows that GA-ELM method can be well implemented to forecast the electrical load better than the usual ELM method.
And for future research could use additional variables to support the forecasting such as the number of customers, total cost, and other variables thus the forecasting goal can be expanded for example to optimizing the costs that can be cut.
References
1. Huang, G.B., Yu, Q., and Siew, C.K., "Extreme Learning Machine: A New Learning Scheme of Feedforward Neural Networks.," in Proceedings of International Joint Conference on Neural Networks, Singapura: Nanyang Avenue, (2004).
2. Hasim, A., "Prakiraan Beban Listrik Kota Pontianak Dengan Jaringan Syaraf Tiruan," Sekolah Pasca Sarjana Institut Pertanian Bogor, Bogor, (2008).
3. Alencar, A. S., Neto, A. R. R., and Gomes, J. P. P., "A New Pruning Method for Extreme Learning Machine via Genetic Algorithms," Applied Soft Computing, pp. 1568-4946, (2016).
4. Wang, X., Wang, C. and Li, Q., "Short-term Wind Power Prediction Using GA-ELM," The Open Electrical & Electronic Engineering Journal 2017, vol. 11, pp. 48-56, (2016).
5. Azizah, A. N., "Penentuan Kualitas Air Sungai Menggunakan Metode Extreme Learning Machine," Fakultas Ilmu Komputer Universitas Brawijaya, Malang, (2016).
6. Kusuma, J., Mahmudy, W.F., and Indriati, "Optimasi Komposisi Pakan Sapi Potong Menggunakan Algoritme Genetika," DORO: Repository Jurnal Mahasiswa PTIIK Universitas Brawijaya, vol. 5, p. 15, (2015).
7. Eiben, A. E. and Smith, J. E., "Introduction to Evolutionary Computing," Springer, London, (2003).
8. Mahmudy, W. F., "Dasar - Dasar Algoritme Evolusi," Program Teknologi Informasi dan Ilmu Komputer (PTIIK) Universitas Brawijaya, Malang, (2015).
9. Gondro, C. and Kinghorn, B., "Application of Evolutionary Algorithms to Solve Complex Problems in Quantitative Genetics and Bioinformatics," Armidale: University of New England, New England, (2008).
10. Desiani, A. and Arhami, M., Konsep Kecerdasan Buatan, Yogyakarta: Andi, (2006).
11. Sun,Z.L., Choi,T.M., Au,K.F., and Yu, Y. "Sales Forecasting Using Extreme Learning With Applications in Fashion Retailing," Decision Support Systems, vol. 46, pp. 411-419, (2008).
![Fig. 1 ELM Structure [11]](https://thumb-ap.123doks.com/thumbv2/123dok/3596509.1788369/2.612.135.481.519.701/fig-elm-structure.webp)