SCIENTIFIC BOARD
1.
Prof. Dr. Abdul Wahab Jufri, University of Mataram
2.
Dr. Elyzana Dewi Putrianti, Charite Universitaetmedizin, Berlin, Germany
3.
Prof. Helmut Erdmann, University of Applied Sciences Flensburg, Germany
4.
Dr. Imam Bachtiar, University of Mataram
5.
Prof. James Gannon, University of Montana, USA (present address American
University of Sharjah, United Arab Emirates)
6.
Dr. Lalu Rudyat Telly Savalas, University of Mataram
7.
Assoc. Prof. Dr. Mian Muhammad Awais, Bahauddin Zakariya University,
Pakistan
8.
Prof. Dr. Moh. Faried Ramadhan Hassanien, University of Zagazig, Egypt
9.
Dr. Muhammad Roil Bilad, Nanyang Technological University, Singapore
(present address Universiti Teknologi Petronas Malaysia)
10.
Dr. Saprizal Hadisaputra, University of Mataram
11.
Dr. Syamsul Bahri, University of Mataram
12.
Prof. Dr. Unang Supratman, University of Padjajaran
Technical Editors:
1. Baiq Nila Sari Ningsih, S.Pd.
2. Alfian Eka Utama
ISBN 9786021570425
Proceedings International Conference on Mathematics, Sciences and Education, University of Mataram 2015 Lombok Island, Indonesia, November 4-5, 2015
ISBN 9786021570425 Page ii
PREFACE
Assalamu’alaikum warahmatullah wabarakatuh
It is my pleasure to be able to bring the International Conference on Mathematics
and Natural Sciences Proceeding to our readers. It took an extra effort, time and patience
to accomplish this proceeding and it involved reviewers from all over regions. I personally
thank to our reviewers and subsequently apologize for the delay in making this
proceeding available for you to read. It is largely due to the inevitably extensive reviewing
process and we persist on our initial idea to keep the proceeding both readable and
academically meet a higher standard.
This proceeding is presented in six sections: 1) Invited Speakers; 2) Physics; 3)
Mathematics; 4) Biology (including pharmacy and agriculture); 5) Chemistry; and 6)
General Education. All sections consist of papers from oral and poster presentation in
respective subject, including science and science education.
I hope that this proceeding may contribute in science and science education.
Wassalamu ‘alaikum warahmatullahi wabarakatu
h
Lalu Rudyat Telly Savalas
OPE-05
Testing the Effectiveness of PISA-based Teaching
Materials on the Topic Temperature and Its Changes of
Public and Religion Senior High Schools in Palembang
Syuhendri
*, Sanjaya
1, Yenny Anwar
*
Sriwijaya University, Jln Raya Palembang-Prabumulih KM 32, Inderalaya, Indonesia, [email protected]
Abstract-The objective of the research was to investigate the effectiveness of the product of PISA-based teaching materials on the topic temperature and its changes of religion and public senior high schools in Palembang. The quasi-experimental research design has been implemented in this research. The sample based on purposive sampling comprised of students from three senior high schools that represented public and religion high schools, and the accreditation of the schools in Palembang city. The data from pretest and post-test of PISA-like instrument were analyzed to determine the mean N-gain, while t-test was used to test the hypothesis. The findings of the research revealed that the achievement of students taught by using PISA-based teaching materials was better than the students taught by using conventional materials. It was also found that the scientific skills of students in experimental group was better than students in control group. The implication of this study suggested that teachers should develop teaching materials appropriate to increase students’ achievement and their scientific skills in order to improve the quality of science literacy for their students.
Keywords:PISA-based materials, Physics-science, scientific skill.
1. Introduction
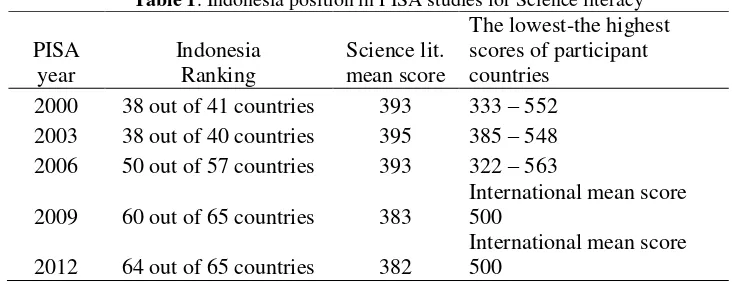
The Programme for International Student Assessment (PISA) was established in 1997 by some advanced countries grouped in the Organisation for Economic Cooperation and Development (OECD, 2001). The PISA study is conducted every three years to measure how far students approaching the end of compulsory education have acquired some of the knowledge and skills essential for full participation in the knowledge society (OECD, 2015a), starting in 2000 (Willms & Tramonte, 2015). PISA’s target population are the 15-year-old students in each participant country. Unlike what have been tested in IAEP and TIMSS (Trend in International Mathematics and Science Studies), in addition PISA tested another subject, i.e. reading literacy (Fuchs & Wößmann, 2008). As a result, it describes the profile of students’ literacy in reading, math, science, and problem solving. There were five times of PISA survey so far, namely in PISA 2000 focused in reading literacy, PISA 2003 focused in math literacy, PISA 2006 focused in science literacy, PISA 2009,
and PISA 2012. PISA 2012 was the programme’s 5th survey with afocus on mathematics (OECD,
2014). Indonesia has participated in PISA program since 2001. By 2012, PISA comprised of 34 member countries and 31 partner countries.
In science, PISA measures students’ ability to use knowledge and to identify problems to
Proceedings International Conference on Mathematics, Sciences and Education, University of Mataram 2015 Lombok Island, Indonesia, November 4-5, 2015
ISBN 9786021570425 PHY-109
Table 1. Indonesia position in PISA studies for Science literacy
PISA development of modern technology, it has an important role in a variety of disciplines and promote the power of human thought. The rapid development in the field of information and communication technology today is based on the development of the science. Therefore, the mastery of science is needed for the national future.
Based upon that, it needs to improve students’ literacy in science. Moreover, science literacy measured in PISA program is in line with National Curriculum 2013. Science literacy is defined as
―the capacity to use scientific knowledge, to identify questions and to draw evidence-based
conclusions in order to understand and help make decisions about the natural world and the changes made to it through human activity” (OECD, 2015a). A way to increase science literacy is by developing PISA-based teaching materials. This study will test the effectiveness of PISA-based teaching materials that have been developed a year earlier.
2. Method
The study was conducted in junior high schools in the Palembang city, namely schools under the Ministry of Education and Culture and the Ministry of Religion. The selected schools were
schools with a high level (accreditedA), medium level (accredited B), and low level (accredited C).
The method used was the quasi-experimental with One Shot Case Study design. In the One-Shot Case Study outlined that there is a group given treatment and then it is observed its effects. In this study, students would be given teachig and learning process by utilizing PISA-based teaching materials and subsequent to see the effectiveness of the application of those materials towards
students’ ability tosolve PISA problems.
Instruments used in study are a PISA-like tets (some from OECD, 2015a; OECD, 2015b), observation (field notes), as well as video and pictures of the activities. Observation (notes field) is used to see the learning process conducted by teacher in the classroom. Field notes are notes about what is seen or heard during the learning process. Field notes are in terms of records of whatever important events found during the study either in the observation or in the other events. Field notes often contain descriptive and reflective aspectsso that it often contains what arethe researcher experiences and thinking during the research/observation tooks place. Field notes are made as complete as possible in order to be able todescribe the actual situation. Observations in this study were used to find out the information about the potential effects of the teaching materials that have been developed. Video and photos weretaken during the learning process. These Video recordings and photos are not only used for documentation, but also used for discussion the results of the study.
<𝑔>= 𝑵 − 𝑮𝒂𝒊𝒏=𝑺𝑝𝑜𝑠𝑡𝑡𝑒𝑠𝑡 − 𝑺𝑝𝑟𝑒𝑡𝑒𝑠𝑡
𝑺𝑚𝑎𝑘 − 𝑺𝑝𝑟𝑒𝑡𝑒𝑠𝑡
(Hake, 1999) To determine the meaning of N-gain values whether they belonged to high, medium or low categories, a criteria proposed by Hake (1998) was used.
High-g (<g>)≥ 0.7
Medium-g 0.7 > (<g>) ≥ 0.3
Low-g (<g>) < 0.3
Furthermore, analysis was conducted on the gain score to determine the significance of the effect of the instructional. Statistical tests were carried out to test the proposed hypothesisby using
Paired Sample t-test with a significance level = 5%.
3. Results and Discussions
The study was carried out for three weeks, starting on October 3, 2015. The pre-test in an A
accredited school and in a B accredited school were held on Saturday, October 3, 2015 and
Tuesday, October 6, 2015, respectively. In the next session, it would be described an example of the learning activities implementing PISA-based teaching materials done by the science teacher.
3. 1. Description and Discussion of Learning Implementation
Learning activities in the accreditation A school on the first day were: 1) pre-test, and 2) working in group doing experiment. During the pre-test, students seemed workseriously doing the test. They focused on solving the problems whether for physics, chemistry, and biology PISA-lake problems. They still wanted to complete the test till the end of the time alocated to solve the problems. They even wanted to continue working on the test after time was up. They seemed so enjoy solving the given problems. It means that the students like the PISA-like problems.
The learning activities were performed by an experimental method in which students did activities in groups guided by Worksheet titled "Sweat" provided by the teacher. There were seven groups, each goroup comprised of five students. The objectives of group activities were 1) to investigate the relationship between sweat and body temperature, and 2) to examine any solution contained in the sweat. The first activity was to measure the body temperature of each member of the group and write the data in the table provided. Furthermore, one member of each group was asked to ran and/or jump. Every one minute, other group members measuredthe body temperature of their friend who had just stoped running and/or jumping, and then placed litmus in his sweat, and count (the quantity and quality) of the sweet. This data was used to know how the average temperature of the normal human body's (content of subject-matter); in addition, it was alsonecessary for mathematicssubject-matter related to the statistics topics (mean, median, frequency, etc.). The data obtained from the Science learning would be used in the mathematics learning so that it looks there was integration between science and mathematics topics and also to make the mathematics content more realistic to the learnners.
After collecting the data and record it in the table provided, then the students had a discussion to answer some questions related to the experiment conducted. Table provided in the Workseets are 1) temperature table of group members before doing activities, 2) table of changes of litmus colour after putting it in the sweat, 3) table of changes of the sweat in five time running and/or jumping, and 4) table of changes of bodytemperature in five times running and/or jumping. Based on this data,the students answered questions 1) how the temperature found before and after running and/or jumping? 2) how the sweat during the running and/or jumpingfor five times? 3) how the changes of colour the litmus paper? And 4) what kinds of solution that the sweat consists of?
At the accreditation Aschool, majority of the groups answered that the body temperature will drop
become lower than the initial temperature before doing activities that exited the sweat. Only one
group (14.3%) which answered the body temperature will rise. While at the accreditation Bschool,
Proceedings International Conference on Mathematics, Sciences and Education, University of Mataram 2015 Lombok Island, Indonesia, November 4-5, 2015
ISBN 9786021570425 PHY-111
Based on the observations, it seemsthat teacher did not understand the learning material well. The teacher did not master the concept of how the relationship between a person's physical activity and changes of his/her body temperature, and how the role of perspiration to change body temperature. In addition, teacher was also lack understanding of how to use a thermometer to measure body temperature precisely and exactly. The teacher let students used thermometer based on what their will even if it was wrong, such as not to calibrate the thermometer in the beginning or put the wrong part of the thermometer when measuring the body temperature. The teacher also seemed hesitant in using the thermometer. Teacher should give an explanation at the beginning of the learning process how to measure the body temperature with a thermometer correctly
3. 2. Description and Discussion of Findings
Based on the analysis of the pre-test and post-test data, the researcher found N-gain valuesfor the SMP Muhammdiyah 1 Palembang and SMP Srijaya Negara Palembang as shown in Table 1 and Table 2 below.
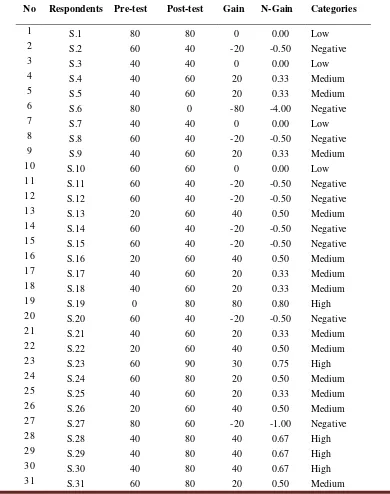
Table 2. Gain and N-gain values for SMP Muhammadiyah 1 Palembang
No Respondents Pre-test Post-test Gain N-Gain Categories
32 S.32 40 60 20 0.33 Medium Muhammadiyah 1 Palembang. The maximum score on pre-test was 80, while the maximum score on the post-test rose to 90 (scale 0 - 100). The minimum scores on the pre-test and post-test were the same, namely zero. Two of the students who got the highest score in the pre-test (80),still got the same score (80) in the post-test and one fell to 60 and another one drop to zero. A student who got the lowest score on the pre-test, namely zero, got a score jump to 80 on the post-test. On the other hand, students who got the highest score on the post-test, namely 90, just getting a score of 60 on the pre-test. It seems that the students who get the highest score in pre-test does not necessarily get the highest score in the post-test. Mean scores also increased from pre-test to post-test, i.e. from 47.78 to 58.61. Based on these mean scores, it seem that the ability of students to solve the PISA-like problems remains low after learning process implementing PISA-based teaching materials.
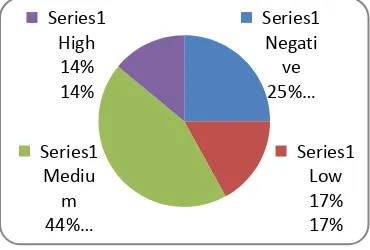
The highest gain score was 80 and the lowest one was -80. It is very interesting that there are students who obtained an improvement of their score up to 80 points after the learning process, but there are alsostudents who got decrease scores up to 80 points after the learning process. While the highest N-gain value was 0.80 (high category) and the lowest one was -4 (negative). The highest gain score was obtained by the students who received the lowest score on the pre-test, but this student was not the student who obtained the highest score on the post-test. The students who obtained the highest score on the post-test, got the N-gain value between before and after learning of 0.75, also in high category. While the students who got the highest score on the post-test, 50% of them (two studnets) got N-gain in low category and the rest 50% obtained negative N-gain. Mean N-gain value for SMP Muhammadiyah 1 Palembang was 0.04 (low category). The classification of N-gain for this school is 25% negative, 17% low, 44% medium and 14% high. This classifcation is shwon in the diagram below.
Figure 1. Distribution of students’ N-Gain categories for SMP Muhammadiyah 1 Palembang
Proceedings International Conference on Mathematics, Sciences and Education, University of Mataram 2015 Lombok Island, Indonesia, November 4-5, 2015
ISBN 9786021570425 PHY-113
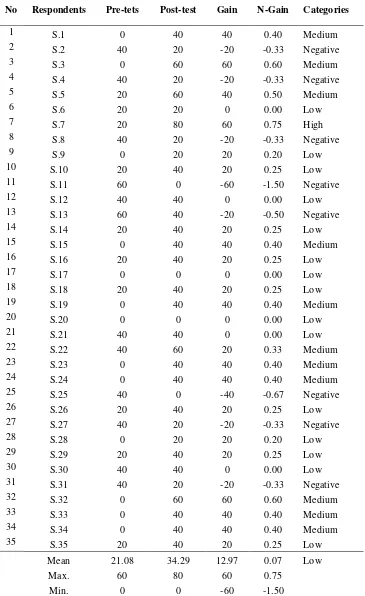
Table 3. Gain and N-gain values for SMP Srijaya Negara Palembang
No Respondents Pre-tets Post-test Gain N-Gain Categories
1 S.1 0 40 40 0.40 Medium
lowest score on the pre-test had increased their score in the post-test. There was one student who achieved the highest scores on the post-test.This student was not the student who got the highest score on the pretest. The students got an increase in score from 20 before learning to 80 after the learning was done. Like the data on SMP Muhammadiyah 1 Palembang, the data for the junior high school of Srijaya Negara Palembang also showed an increase in the average scores of students from the pre-test to the post-test, i.e. from 21.08 to 34.29. It means that learning conducted increased the average students’ ability in solving PISA-like problems.
The highest gain and N-gain values for SMP Srijaya Negara were 60 and 0.75, respectively. Meanwhile, the lowest gain and N-gain values were -60 and -1.50, respectively. The highest N-gain (high category) was obtained by the students who got the highest score on the post-test. The second highest N-gain was 0.60 (medium category) obtained by two students. Both of these students got the lowest score in the pre-test. While the lowest N-gain obtained by one of the students who got the highest score in pre-test but getting the lowest score on post-test. There were four students who received the lowest score on the post-test, 50% of them got negative N-gain and the other 50% was in the low category. The average N-gain for Srijaya Negara students was 0.07, at a low category.
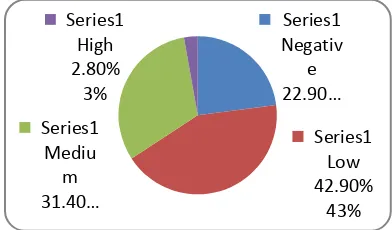
Figure 2. Distribution of students’ N-Gain categories for SMP Srijaya Negara Palembang
Based on Table 2, there was only one out of 35 students (3%) who received N-gain value in high category. Students who got N-gain in category medium and low were 31% and 43%, respectively. The rest, 23% of them obtained negative N-gain. It was almost the same as scores obtained by students of SMP Muhammadiyah 1 Palembang. It means that about one-quarter of students did not get the benefecial of the learning process using PISA-based learning materials to improve their ability to solve the PISA-like problems. The difference was for SMP Muhammadiyah 1 the biggest portion wasfor the N-gain in medium category while for Srijaya Negara the biggest portion was for N-gain in low category.
Based on the above analysis it can be concluded that the science teaching conducted by the science
teacher utilizing the materials based on PISA-framework has succeeded in improving students’
ability to solve problems tested by the PISA program at a very low category. Based on the results of data analysing for all respondents, it was obtained N-gain for all respondents as shown in Figure 3 below.
Series1 Negativ
e 22.90…
Series1 Low 42.90%
43% Series1
Mediu m 31.40…
Series1 High 2.80%
Proceedings International Conference on Mathematics, Sciences and Education, University of Mataram 2015 Lombok Island, Indonesia, November 4-5, 2015
ISBN 9786021570425 PHY-115
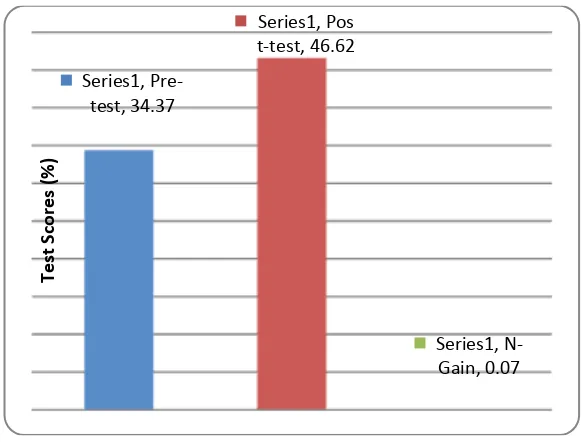
Figure 3. The average of pre-test, post-test, as well as the achievement of N-Gain of all respondents
Figure 3 shows that the students’ mean scores both for before and after being given teaching and
learning process were low, i.e. 34.37 and 46.62, far below the thereshold of mastery learning 75%
.The increasingof students’ scores from the pre-test to post-testwas also not so high, namely with
gain of 12.25 (range 0–100) or with N-gain of 0.07 which means that it is at the low category. The
low of respondents’ achievement was also found by Sulistiawati (2015) in her research by using some questions from PISA 2009, i.e. 47.7.
Futhermore, the hypothesis was tested to examine whether the instructional based on PISA-framework materials can be significant or not to improve students' science literacy. The hypothesis tested is Ho: There is no difference in the averageof students’ science (physics) scores of junior high schoolstudents before and after learning process utilizing PISA-based teaching materials, and
Ha: There is a difference in the averageof students’ science (physics) scores of junior high school
students before and after learning process utilizing PISA-based teaching materials.
The hypothesis testing was done by using Paired Sample t-test utilizing SPSS ver. 17. The test was
made by using a two-tailed test with a significance level = 5%. The results can be seen in Table
was rejected. This is reinforced by the significant value of 0.001> 0.05, which means that Ho was rejected. In conclusion, there is difference in the average of students’ science (physics) scores of Palembang junior high school students before and after learning with PISA-based teaching materials. So,althought there isa relatively low of N-gain gained by the students after learning process, but statistically there is a significant difference in the average scores of students in solvinglike problems between before and after implementing of instructional using PISA-based materials.
4. Conclusion
Based on the description above, it can be concluded that:
1. Science (Physics) learning process conducted by the science teacher by using PISA-based teaching materials could enhance the ability of junior high school students in Palembang to solve the PISA-like problems with N-Gain in category Low (very low). Based upon the findings, the learning conducted by the teachercan not be generalized effective in improving students' ability to solve the PISA-like problems.
2. Despite an increase in the ability of students to solve PISA-like problems is very low, but the average ability of the students to solve PISA-like Problems before and after learning process with teaching material based on PISA framework could significantly increase the student's ability in handling PISA-like problems.
Acknowledgements
I express my gratitude to the Faculty of Teacher Training and Education, Sriwijaya University, which is kindly funding the research reported in this paper with the Contarct Number: 1005/UN9.1.6/KP.6.h/2015, date June 22, 2015. I wish also to express my sincere gratitude to the Science teacher who had been a model teacher in this research as well as to the students who have participated in the study.
References
Fuchs, T., & Wößmann, L. (2008). What accounts for international differences in student
performance? A re-examination using PISA data (pp. 209-240). Physica-Verlag HD.
Hake, R. R. (1998). Interactive-engagement versus traditional methods: A six-thousand-student
survey of mechanics test data for Introductory physics courses. American Journal of Physics,
66(1), 64-74.
Hake, R. R. (1999). Analyzing Change/Gain Score. American Educational Research Division D, Measurement and Research Methodology.
OECD (2001). Knowledge and Skills for Life: First Results from PISA 2000, OECD Publishing,
Paris.http://dx.doi.org/10.1787/9789264195905-en
OECD. (2006). Programme for International Students Assessment: PISA 2006 Results.
OECD. (2014). PISA 2012 Results in Focus: What 15-year-olds know and what they can do with what they know.
OECD. (2015a). Take the Test: sample Questions from OECD’s PISA Assessment. OECD. (2015b). PISA 2015 Released Field Trial Cognitive Items.
Sulistiawati. (2015). Analisis Pemahaman Litrasi Sains Mahasiswa yang Mengambil Matakuliah
IPA Terpadu Menggunakan Contoh Soal PISA 2009. Sainteks, 12(1), 21-40.
Willms, J. and L. Tramonte (2015), “Towards the development of contextual questionnaires for the PISA for development study”, OECD Education Working Papers, No. 118, OECD
Publishing, Paris. http://dx.doi.org/10.1787/5js1kv8crsjf-en.
Web sites: