Sand Reservoir Characterization Using Seismic Attributes
and Log Interpretation in “T” Field, Southern Sub Basin,
East Java Basin
Titi Setianing Rahayu
1,a), Ordas Dewanto
2,b), Bagus Sapto Mulyatno
3,c)University of Lampung, Prof. Sumantri Brojonegoro Street 1, Bandar Lampung
a) [email protected] b) [email protected] c) [email protected]
Abstract. Amplitude and frequency are the seismic signal that is commonly used to obtain reservoir information. RMS amplitude is the root of the amount of energy in the time domain or simply, the average of amplitude. RMS amplitude is very sensitive to extreme value and may also be useful for tracking changes in lithology and spreading horizontally. Instantaneous frequency gives information about seismic waves that make frequency changes, for example absorption effect, fractures and thickness of deposition system. Attenuation of seismic waves, when passing through the gas reservoir can be detected as a decrease offrequency. Interpretation of log data used to know reservoir vertically characterization. In the Field "T", there are three wells with gamma ray, LLD, NPHI, and RHOB log data. Based on interpretation of log data, it is known that the reservoir zone is permeable zones, based on the low value of gamma rays. Sparation existence between the density-neutron log and resistivity values more than 100 (μs/f) on T1 indicates gas content, T2 has resisitivity value 20-100 (μs/f) indicate the presence of oil, and T3 has resistivity values more than 100 (μs/f) indicate the presence of gas. Distribution of high RMS amplitude anomalies in the study area leads from the Northeast to the Southwest with value 0,4-0,7, and low frequencies value, 0-15 Hz.
I.
INTRODUCTION
Reservoir characterization is a process to define the qualitative and quantitative characters or reservoir using all existing data (Sukmono, 2002). Reservoir characterization is important to know the state of subsurface, especially the oil and gas reservoir.Seismic data has a different character, therefore the method used for reservoir characterization of a particular area will not be the same as other areas. Reservoir characterization from seismic data can be done by identifying the presence of fluid and also estimate the distribution of lithology. One method that can be used for reservoir characterization of seismic data is seismic attribute.
Integration of multiple seismic attributes and physical properties of rocks obtained from logging an effective methodology in providing information on the subsurface geology including segregation analysis of litholog, indicating Some of the objectives of this study are as follows:
1.Knowing the distribution of reservoir sandstones based seismic attribute
2.Interpret and analyze log data (porosity, density, and resistivity) to support the distribution of sandstone and hydrocarbon content.
The boundary problem in this research are:
1.Analysis focused on the target zone Paciran Formation, East Java Basin 2.This study uses PSTM 3D seismic data with three wells
3.The attribute used are RMS amplitude and instantaneous frequency
II.
BASIC THEORIES
2.1. Seismic Attributes
Seismic attributes are defined as quantitative and descriptive characterization of seismic data that can directly be displayed in the same scale as the initial data (Barnes, 1999). Penglasifikasi seismic attributes in general to that is based on time, amplitude, frequency, and attenuation.
2.1.1. RMS (Root Mean Square) Amplitude
RMS amplitude is the root of the amount of energy in the time domain (amplitude squared) can be said to be average amplitude of number of existing amplitude. RMS amplitude is very sensitive to extreme amplitude may also be useful for tracking changes in lithology as in the case of gas sands. RMS amplitude attribute equation;
𝐴𝑚𝑝𝑙𝑖𝑡𝑢𝑑𝑜𝑅𝑀𝑆= �1
𝑁 ∑𝑁𝑖=1𝑎12 (1)
where, N is number of samples in the amplitude of analysis window, and “a” is amplitude.
2.1.2. Instantaneous Frequency Attributes
Instantaneous frequency has a frequency range from (-) Nyquist frequency (+) frequency Nyqust but most of the instantaneous frequency is positive. The instantaneous frequency gives information about the behavior of seismic waves that affect the frequency change as the effects of absorption, fractures and thickness of the deposition system. Seismic wave attenuation when passing through gas reservoir can be detected as a decrease in frequency. This phenomenon is known as low frequency shadow. The loss of high frequencies indicate regions of overpressure.
The instantaneous frequency is a derivative of the instantaneous phase.
𝜔(𝑡) = 𝑑
𝑑𝑡( 𝑡𝑎𝑛−1� 𝑓(𝑡)
𝑓∗(𝑡)� ) (2)
2.2. Well Logging
Logging method can determine a complete picture of the subsurface environment, can accurately determine and assess the rocks surrounding the drill hole. In addition, this method can provide information into layers containing hydrocarbons as well as the extent of the spread of hydrocarbons in a layer, (Dewanto, 2008).
2.2.1. Log resistivity
Resistivity is a rock's ability to impede the course of electrical current flowing through the rocks. Low resistivity value when the rock is easy for an electric current, while the high resistivity value when the rock is difficult to flow of electric current. Resistivity log is used to determiner hydrocarbon zones and water zones, indicated by mendeteminasi porosity permeable zone resistivity, because the rocks and not conductive matrix, the rock's ability to conduct electricity depending on the fluid and pore
2.2.2. Log Gamma Ray (GR)
Log gamma ray curve is a curve which shows the amount of existing radioactive intensity in formation. These logs works by recording natural gamma radiation of rocks, making it useful for detecting or evaluating deposits of radioactive minerals such as Potassium (K), thorium (Th), or ore Uranium (U).
2.2.3. Density Log
Density log is a curve showing magnitude of density (bulk density) of rock penetrated by a borehole with units of grams / cm3. The basic principle of this log is by firing gamma rays into the formation, in which gamma rays can be considered as particles moving at very high speed. The number of gamma ray energy that is lost shows the density of electrons in the formation, where the electron density is an indication of the density of the formation.
2.2.4. Neutron Log
Basic principle of neutron log is to detect the content of hydrogen atoms contained in rock formations by firing neutrons into the formation of atoms with high energy. Neutron is an electrically neutral particles that have a mass similar to the hydrogen atom. Radiating neutron particles penetrate the formation and collides with the material formation, as a result of collision neutron will lose energy. The energy lost during the collision with the atoms in rock formation called formation porosity (ф N).
2.2.5. Log combination Density (RHOB) and Neutron Log (NPHI)
Based on the properties - properties ρ𝑏𝑏dan φ𝑁𝑁 deflection curve, it can provide a distinct advantage in layers - layers containing hydrocarbons. On the layer of hydrocarbons, curve density will tend to have a deflection to the
left (the smaller the price ρ𝑏𝑏), whereas in log neutrons, the price of the porosity will tend more and more to the right (the smaller price φ𝑁𝑁), and the layers of shale both types of curves will show symptoms otherwise.
III. RESEARCH METHODOLOGY
3.1. Materials and tools
Materials and data used in this study are: 1. The regional geological data
2. Seismic Data 3. Data wells
4. Software Openworks
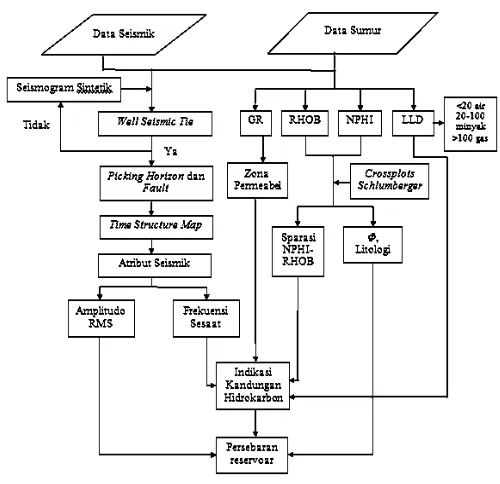
3.2. Flowchart of Research
Flowchart of research look like in Figure 1.
FIGURE 1. Research Flow Chart
IV. RESULT AND ANALYSIS
4.1. Seismic attribute analysis
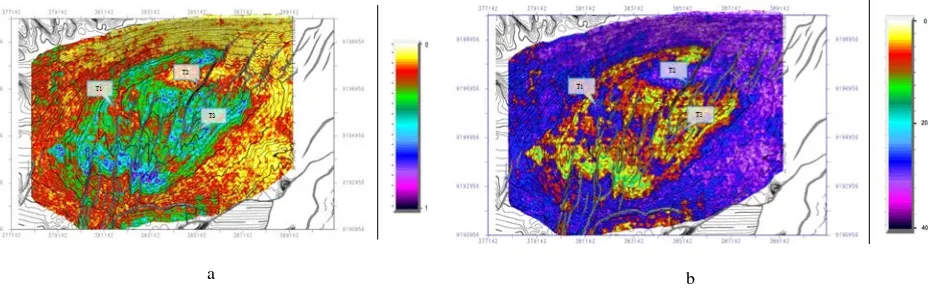
amplitude value indicated as a great reservoir. Based on RMS amplitude maps also can be seen spread sand reservoir this field leads from the Northeast to the Southwest.
It is correlated to map attributes instantaneous frequency, where the research area discount between 0-15 Hz frequency value of the total range of 0-40 Hz. 0-15 Hz frequency values are categorized as low frequency. The low value of the frequency indicated by the weakening or wave attenuation due to passing gas reservoir.
Map comparison between RMS amplitude and instantaneous frequency of 50 ms below the Top Sandstone shown in
Figure 2.
a b
FIGURE 2. Comparison between ampitudo RMS and instantaneous frequency of 50 ms under Top Sandstone
4.2. Analysis of log data
Logging method can determine a complete picture of the subsurface environment, can accurately determine and assess rocks surrounding the drill hole. In addition, this method can provide information into layers containing hydrocarbons as well as the extent of the spread of hydrocarbons in a layer,
T1 wells in the reservoir zone has a gamma ray values are lower, it indicates permeable zone. Density and neutron logs show separation in the area of sandstone at a depth of 2310-2320 feet. The existence of a relationship between density log and neutron log can be indicated that this separation indicate a gas column. Area of separation is shown in Figure 3, This is reinforced by resisitivitas value of 220 μs / f. Average value of porosity of 21.5%, obtained from manually plot of Schlumberger Chart.
Based on geologic information, layers of marl and limestone eroded in areas T2 wells where the well is located at the top of anticline. Reservoir zones that are in sandstone layers with gamma ray values low, indicating that at this depth is permeable zone. Density and neutron logs indicate a separation at depths of 2090-2210 feet and 2300-2335 feet. The area of separation is shown by Figure 4, the existence of a relationship between the density log and neutron log, resistivity values also showed the number of 20-80 μs / f, thus indicating contain oil with an average porosity value of 22%.
FIGURE 4.Separation area on T2 wells
T3 reservoir wells on these wells are in layers of limestone and sandstone. At the reservoir zone has a gamma ray values are lower, it indicates permeable zone. At a depth of 2300-2390 feet occurred sizable separation between the curves and the neutron density log, backed by high resistivity values, ie 100-200 μs / f and an average porosity of 24.5%, thus indicating the presence of a gas column. The area of separation is shown in Figure 5.
V. CONCLUSIONS AND SUGGESTION
5.1 . Conclusion
There are some conclusion from this research
1. Based on the RMS amplitude attribute maps showing the value of 0.4-0.7. Distribution of reservoir sand leads from the Northeast to the Southwest based on the anomaly amplitude RMS value is high.
2. Content of reservoir in the area of research are oil and gas. This is inferred based on the response of RMS amplitude values are high, instantaneous frequency value of 0.4-0.7 and a low of 0-15 Hz, and the response of log data that showed separation between density-neutron log curves and grades high resistivity , ie 20-100 μs / f for oil
and over 100 μs / f for gas .
5.2 . Suggestion
1. Need for further characterization of the reservoir, such as Sw calculations and seismic inversion