IPA17-600-SG
PROCEEDINGS, INDONESIAN PETROLEUMASSOCIATION Forty-First Annual Convention & Exhibition, May 2017
DETERMINE RESERVOIR PROPERTIES OF “R1” RESERVOIR BASED ON LOG INTERPRETATION AND CORE ANALYSIS IN “X” FIELD OF SOUTH SUMATRA BASIN
Sri Rizky * OrdasDewanto* BenyChasandra* BagusSaptoMulyatno
ABSTRACT
The degree of success of many oil and gas drilling and production activities depends upon the accuracy of the characteristics and model used in a reservoir description. A better reservoir characterization means higher success rates and fewer wells for reservoir exploitation. A study for the determination of reservoir properties has been carried out in “X” field of the South Sumatra Basin . Depths and thicknesses of hydrocarbon bearing zones were obtained from correlated wells. Petrophysical parameters of hydrcarbon were obtained from combined well logging and core data. Data from six composite well logs comprising of gamma ray, resistivity, neutron and density logs were used for the study. The results from the study showed that one reservoir zone (R1) was identified, which can be good correlated in all of the wells. Well log and seismic section revealed the presence of hydrocarbons in the identified sands. The evaluated petrophysical parameter indicated that there were good porosity ranges between (18-27%), clay volume (1-8%), water saturation (28-47%), and hydrocarbon saturation (53-72%). Seismic section in wells shows the trapping mechanism to be mainly fault-assisted anticlinal closures. This prospect zone has been recommended for drilling and further research work. This implies that the research area indicates hydrocarbon accumulation in economic quantities.
Keywords: Reservoir properties, Log analysis, Petrophysical properties
INTRODUCTION
A good well is one that is commercially productive; it produces enough oil or gas to pay back its investors for the cost of drilling and leaves a profit (David et al, 2002). Hence, reservoir characterization is undertaken to determine the quality and commerciality of hydrocarbon by using reservoir
properties/parameters such as porosity (Φ), permeability (K), fluid saturation and Net Pay thickness. Core analysis, seismic interpretation and well logging are three essential procedures undertaken as part of the reservoir characterization which can help to give an idea of whether a formation contains commercial amounts of recoverable hydrocarbons.
Well logging is a study of acquiring information on physical properties of rocks that are exposed during drilling of an oil well. Logs also tell us about the fluids in the pores of the reservoir rocks (Ishwar et al, 2013). Different types of gamma ray (GR), spontaneous potential (SP), resistivity, neutron and density log help in defining physical characteristics of the reservoirs. Core analysis is a very important part of the formation evaluation process, enabling the study of samples of reservoir rock to determine well conditions and, as a result, the ability of the formation to produce hydrocarbons (Ardo, 2016). On the other hand, as well as being an additional source of information, coring can also be used to calibrate well log data in order to determine important reservoir properties.Seismic profiles provide an almost continuous lateral view of subsurface. Seismic profiles can resolve, with relatively high precision, the structural and stratigraphic changes from the arrival times and amplitudes of the reflection events (Godwin et al, 2012). Therefore, seismic and well log data are widely used in petroleum exploration to map the subsurface.
By analysing core, well log and seismic data, it is possible to determine reservoir properties, reduce uncertainty and, as a result, gain a more complete understanding of what to expect within the formation.
REGIONAL GEOLOGY
of the island of Sumatra. The basinis boarded to the north by Jambi, to the west by Bengkulu province, to the south by the Lampung province and to the east coast by the islands of Bangka and Belitung. It comprises of a series of NNW-SSE trending syn-rift basins with post-rift sequence. The basin was formed during east-west extension which took place during pre-tertiary and early tertiary times (Daly et al., 1987).
The geology and Tectonic histories of the basin have been published by Kasim and J. Armstrong (2015), de Coster (1974), Darman and Sidi (2000), Adiwidjaja and de Coster (1973), Pulunggono et al. (1992), and Barber et al. (2005) (Figure 1). The geology of South Sumatra is dominated by the Holocene-Pleistocene and Pliocene-Miocene sediments, pre-Tertiary Volcanic and intrusive igneous as well as metamorphic rocks. Stratigraphically, four phases of tectono-stratigraphic evolution are recognised. The basin contains pre-tertiary rocks that occur as isolated inliers that are overlain by a thick sequence of tertiary to recent sediments and volcanic. These are; Early Syn-rift (Eocene to Early Oligocene), Late Syn-rift (Late Oligocene to Early Miocene), Early Post-rift (Early to Middle Miocene) and Late post-rift (Middle Miocene to Quaternary).
THEORY
The porosity was estimated from the density log as shown in the following relationship:
Ф= (ρma - ρlog)/ (ρma - ρfluid)
The effective porosity was further deduced by introducing the shale volume percentage into the equation.
Фe = {(ρma – ρlog)/ (ρma – ρfluid)} - {VCL * (ρma – ρsh)/ (ρma – ρfluid)}
Where,
Ф = Density porosity ρma = matrix density
ρlog = bulk density log reading ρfluid = density of fluid Фe = Effective porosity ρsh = Density of shale VCL = volume of clay (Dresser, 1979).
The volume of shale was calculated using the
IGR= (GRlog-GRmin)/ (GRmax-GRmin) VCL = 0.083 [2 3.7xIGR -1]
Where,
IGR= Gamma Ray Index
Grlog=GR of formation measured from log Grmin= Minimum GR in zone of interest
Grmax=MaximumGR reading in formation of interest
VCL = Volume of Clay (Rider, 2002).
Water saturation was calculated from the Indonesian equation, it is givenas follows:
Swe = n√1/ {(VCL2/ Rtcl) + (Фem/a.Rw)}*Rt
where,
Swe = Effective water saturation
Rtcl = Deep resistivity in clay (read from log) Фe= Effective porosity
Rw= formation water resisitivity VCL = Volume of Clay
a = turtuosity m = cementation n = saturation exponent Rt= formation resisitivity (Dewan, 1983).
METHODOLOGY
The data collected from the fields in the South Sumatra basin consists of well logging data, routine core analysis and seismic section data. Suite of logsconsist of gamma ray, resistivity, density and neutron logs are used for petrophysical analysis and well correlation. Core analysis data consists of water saturation, porosity, cementation exponent, and saturation exponent are used as parameter sand calibration in the petrophysicalanalysis. One seismic profile, an arbitrary line in NW-SE direction wasinterpreted to support the study.
Six suits of composite well logs Well-1, Well-2, Well-3, Well-4, Well-5 and Well-6 were used for this study. This study has been carried out through qualitative and quantitative analyses by means of the Interactive Petrophysics (IP) program.
saturation was computed using the Indonesian equation, in which a factor and cementation exponent were derived from core analysis (a= 1, m=1.2, n=2).
The logs were also used for well correlation. The identified reservoir tops in the wells were tied to the seismic sections for horizon identification and mapping with the aid of the check shot data from the wells. Cores were used as a reference and calibrationto comparewith the lithology and petrophysical propeties interpreted from the wire line logs.
RESULT AND DISCUSSION
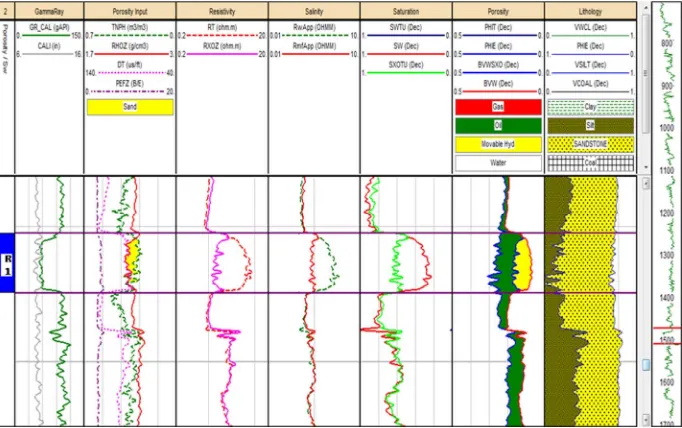
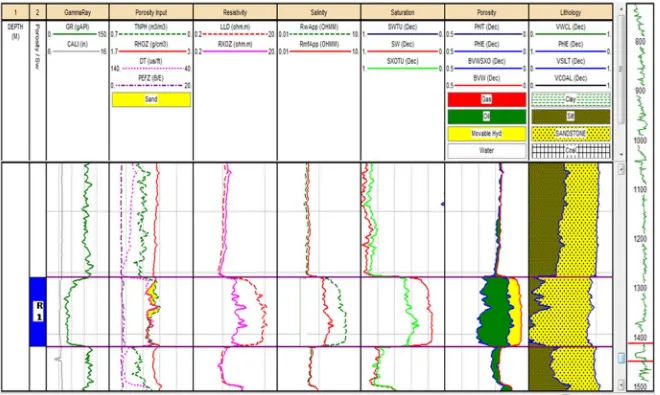
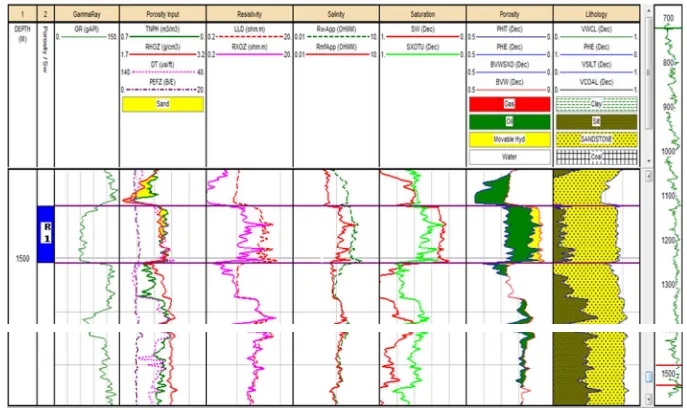
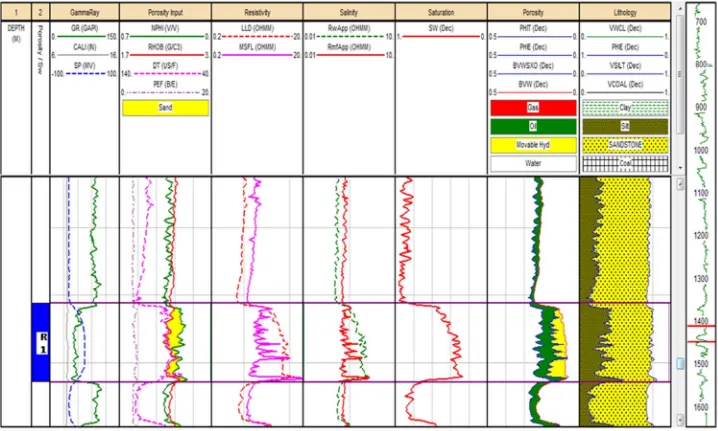
The results of the interpreted well logs revealed one hydrocarbon-bearing sandstone reservoir in each of the wells (Figure 2 until Figure 7). This reservoir iswell correlated in all six wells (Figure 8),which were visible from the gamma ray, resistivity and the neutron–density logs. High resisitivity log reading and separation of the neutron-density log with the neutron log deflecting to the right and density log to the left indicated the present of hydrocarbon. The gamma ray log shows the lithology of reservoir is sandstone as a low gamma ray reading unit.The low GR, high resistivity, low neutron and low density log responses indicated that hydrocarbon type was oil, it also supported by testing data
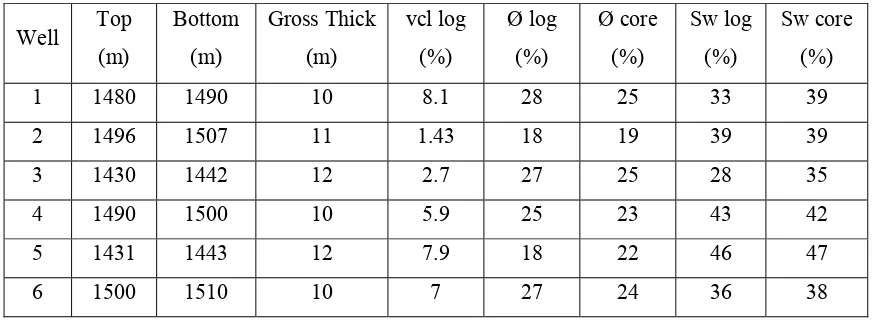
Table 1 shows the summary of the core analysis values and the petrophysical log values of the reservoir of the study. The net pay thickness of the reservoir varied between 10 m and 12m. It reveals a significant similarity in the porosity values determined by the two different methods, which are core analysis and log analysis. The petrophysical porosity values range from 18 to 28 percent, while the core analysis porosity values range from 19 to 25 percent. It shows that the reservoir has good quality reservoir sands. Comparison between core analysis and petrophysical log water saturation values has significant similarity values. The core analysis water saturation values range from 35 to 47 percent,while the petrophysical log water saturation values range is from 28 to 46 percent . The clay volume of the “R1” reservoir is low, varying between 1 and 8 percent . It is indicating of low effectof clay in the reservoir. Because the presence of clay can effect the effective porosity, fill the porous space and decrease space for hydrocarbons.
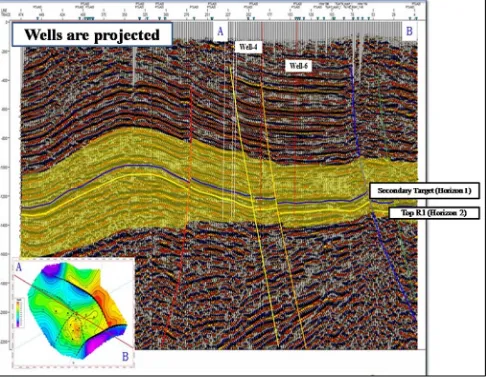
Figure9 shows a typical seismic section, showing the arbitrary cross section between well 4 and well 6 with horizons mapped across the section. The fault structure atthe centre of the field was found to be the
principal structure responsible for hydrocarbon entrapment. Two reflection events were picked on the seismic sections. Reservoir R1 located in Air Benakat Formation shows by yellow zone in seismic section. The top reservoir R1 (horizon 2) at 1310ms marked with yellow colour, is the primary target. The horizon 1 at 1280ms marked with blue colour is secondary target, indicating byseparation between neutron-density logat well-4, but it has low resisitivity. The top of reservoirR1of Well-4is correlated with reservoir R1 of Well-6.
CONCLUSION
Comparison between core analysis and petrophysical log of reservoir (R1) indicate that porosity, volume of clay, and water saturation values from the hydrocarbon bearing reservoir are good enough for commercial accumulation in the field. Porosity ranged from 18-27%. Volume of clay ranged from 1-8%. Water saturation ranged from 28-47 % whereas average hydrocarbon saturation ranged from 53-72 %. A typical seismic section shows the fault structure at the centre of the field was found to be the principal structure responsible for hydrocarbon entrapment.
ACKNOWLEDGEMENTS
The authors would like to express our appreciation to PERTAMINA EP ASSET 1 JAMBI for providing the well logs and other relevant materials for the purpose of thisstudy.The authors also would like to thank Rahmat Catur Wibowo for his help and constant guidance during the studies.
REFERENCES
Ardo, B.U., 2016, Correlating Core Analysis and Well Logging, Oil & Gas Research Publication.
Daly, M.C., Hooper, B.G., Smith, D.G., 1987, Tertiary Plate Tectonics and Basin Evolution in Indonesia. In: Indonesian Petroleum Association, Proceedings of the 16th Annual convention, p.399-426.
David. E. J., and Kathryne, E. P., 2002, Well Logging in Nontechnical Language, Tulsa, Oklahoma: Pennwell Corporation.
Darman, H., and Sidi, F.H., 2000, An Outline Geology of Indonesia: Indonesian Association of Geologist, p. 254.
De Coster, G.L., 1974, The Geology of the Central and South Sumatra Basins: Proceedings of the Indonesian Petroleum Association, 3rd Annual Convention, pp. 77-110
Dewan, J. T., 1983, Essentials of Modern Open-Hole Log Interpretation. Tulsa, Oklahoma: Pennwell Corporation.
Dresser, A., 1979, Log Interpretation Charts. Houston: Dresser Industries, Inc.
Godwin, E., Cyril, N., and Leonard, N., 2012, Integration of Well Logs and Seismic Data for Prospects Evaluation of an X Field, Onshore Niger Delta, University of Port Harcourt Publication.
Ishwar, N.B., and Bhardwaj, A., 2012, Petrophysical Well Log Analysis for Hydrocarbon exploration in parts of Assam Arakan Basin, India:10th Biennial International Conference & Exposition. No. 153
Kasim, and Armstrong, J., 2015, Oil-oil correlation of the South Sumatra Basin reservoirs: Journal of Petroleum and Gas Engineering, Vol. 6(5), pp. 54-61
Pulunggono, A., Haryo, S., and Agus, K., 1992, Pre-Tertiary and Tertiary Faults Systems as a Framework of the South Sumatra Basin; A study of sar-maps: Proceedings of the Indonesian Petroleum Association, 21st Annual Convention, October, 1992, pp. 339-360.
TABLE 1
A COMPARISON OF PETROPHYSICAL WITH CORE ANALYSIS VALUES IN RESERVOIR R1
Well Top (m)
Bottom
(m)
Gross Thick
(m)
vcl log
(%)
Ø log
(%)
Ø core
(%)
Sw log
(%)
Sw core
(%)
1 1480 1490 10 8.1 28 25 33 39
2 1496 1507 11 1.43 18 19 39 39
3 1430 1442 12 2.7 27 25 28 35
4 1490 1500 10 5.9 25 23 43 42
5 1431 1443 12 7.9 18 22 46 47