35 CHAPTER III
RESEARCH METHOD
In this chapter, the writer described about study type, study design, variable of the study, population and sample, study instrument, data collection, and data analyze.
A. Research Type
In this study the writer used quantitative approach (experimental research) which uses objective measurement to gather numeric data that are used to answer questions or test predetermined hypotheses. It generally requires a well-controlled setting. Donal stated that an experiment is a scientific investigation in which the writer manipulates one or more independent variables, controlled any other relevant variables, and observed the effect of the manipulations on the dependent variable(s). An experimenter deliberately and systematically introduces change and then observes the consequences of that change1. The goal of experimental research is to determine whether a causal relationship exists between two or more variables. Because the experiment involves control and careful observation and measurement, this research method provides the most convincing evidence of the effect that one variable has on another.
The quantitative approach to the study of social and behavioral phenomena holds that the aim and method of the social sciences are, at least in principle, the
1
same as the aim and method of the natural or physical sciences. Quantitative research more typically relies on measurement tools such as scales, tests, observation checklists, and questionnaires. The selection of subjects for study also differs. The ideal selection in quantitative research is random sampling, which allows for control of variables that may influence findings2.
B. Research Design
In this study, the design of the study is quasi experimental research which it designs are similar to randomized experimental designs in that they involve manipulation of an independent variable but differ in that subjects are not randomly assigned to treatment groups. Because the quasi-experimental design does not provide full control does not have random assignment of subjects to groups or other strategies to control extraneous variables. This study uses the nonrandomized control group, pretest–posttest design.
Table 3.1
Nonrandomized Control Group, Pretest–Posttest Design
Group Pretest Independent Posttest
A Y 1 X Y2
B Y1 - Y2
X: the independent variable, which is manipulated by the experimenter; we
also refer to it as the experimental variable or the treatment.
2
Y: represents the measure of the dependent variable. Y1 represents the dependent variable before the manipulation of the independent variable X. At the first meeting, both of the groups were given a speaking test to measure their speaking accuracy. Then, writer introduced the podcast as the new teaching technique and at the last meeting administers the same standardized test (post test), comparing students’ scores from the pretest and posttest in order to determine if exposure to the new teaching technique made any difference.
Based on the statement above, the writer concluded that quasi experimental research is a study that conducts to measure the dependent variable without randomized the control and treatment group. The writer would use quasi-experimental research designs because she believed that it has one clear advantage over pure experimental designs, which is that they are studied in natural educational settings. It works in real schools and classrooms with all their complexity rather than just in the laboratory setting. This makes quasi-experimental research a good way of evaluating new initiatives and programmes in education.
C. Variable of The Study
experimental treatment or the independent variable. The observed and measured variable is called the dependent variable3.
Based on statement above this study has two variable; those are Intensive listening through podcast as independent variable, speaking accuracy as dependent variable.
D. Population and Sample
1. Population
The larger group about which the generalization made is called a population. A population is defined as all members of any well-defined class
of people, events, or objects4.
The population of this study was the third semester students of English Education in State Islamic Institute of Palangka Raya academic year 2015/2016.
Table 3.2
Number of population of third semester students of English Education in State Islamic Institute of Palangka Raya academic year 2015/2016
No Class Number
1 Class A 18
2 Class B 19
3 Class C 18
4 Class D 18
3
Ibid,
4
2. Sample
The small group that is observed is called a sample; a sample is a portion of a population. Based on the table above we know the populations are grouped into some classes. In this study, the sample is cluster or class. The samples were class A and D. Class A as the treatment group which they would be given intensive listening through podcasting as the task. In other hand, class D as control group which they would be given the podcast but using Extensive listening.
E. Research Instruments of Study
1. Research Instrument
The writer used some instruments to collect the data needed in this study, they are:
The writer used some instruments to collect the data needed in this study, they are:
a. Observation
In this study, the writer used observation to know students background and what the method they use before to improve their pronunciation and speaking fluency. Observation is a technique in collecting data where the writer does the observation directly to the object of study to know nearly the activities done5.
5
b. Test
Test is an instrument in collecting data that is a series of question or treatment that applied to measure the skill of knowledge, intelligence, the ability or talent that have by individual or group. In this study, the writer will use speaking performance as a test.
The test included: 1) Giving Opinion
2) Agreeing or disagreeing 3) Making Suggestion
These are the example of the questions which writer will give to the students:
1) Who is your favorite lecturer? Why do you admire her or him? Explain!
2) What is your favorite class/lesson? Why do you think it is important for you?
3) Some universities require the new students to live in dormitory of campus and other universities do not. Which policy do you think it is better? Why?
c. Documentation
year 2015/2016. Documentation here is the collecting data by using written documents that are gotten and or related to the data needed. The data needed are:
1) The names of the third semester students of the third semester students of English education in IAIN Palangka Raya in academic year 2015/2016.
2) Students’ score in English subject collecting the value of the third semester students of English education in IAIN Palangka Raya in academic year 2015/2016.
3) Photo as evidence of activities. 2. Research Instruments Reliability
The reliability of a measurement instrument is the degree of consistency with which it measures whatever it is measuring. This quality is essential in any kinds of measurement6. On a theoretical level, reliability is concerned with the effect of error on the consistency of scores. Reliability is necessary characteristic of any good test. For it to be valid at all, a test must first be reliable as a measuring instrument.
There are inter-rater reliability and intra-rater reliability. Inter-rater reliability is the consistency of the judgment of several raters on how they see a phenomenon or interpreted the responses of the subject. It indicates accuracy in scoring composition of two different raters. Meanwhile, intra-rater reliability
6
referred to the consistency of the rater in scoring the same paper at two different points of time. It points out an individual accuracy in scoring a particular composition.
In this study, the writer applied inter-rater reliability; two raters would employ to score the students’ speaking accuracy. The raters were the writer itself and an expert person in English who has been recommended by some master. The first rater is the writer itself and the second rater, Citra Muliati, is the student of English Education at 11 semesters. The writer chose the second rater because she is an expert in oral or written English.
One important thing in using the inter rater method in rating process is focused with the training of the raters. It can maximize the accuracy of the speaking assessment. This made the raters be consistent in scoring and avoid subjectivity of the raters in scoring. For this purpose, the training was done to get inter rater agreement in order to give reliable scores to students’ critical thinking.7
To obtain inter- rater reliability, the score of two raters are correlated using SPSS program. Then the writer got the interpretation of coefficient correlation, whether they belong to high, moderate, or positive weak negative inter rater reliability category. The obtained coefficient should indicate that the students’ speaking products both using Intensive listening through podcast and
7
without using Intensive listening through podcast had achieved the acceptable level of reliability.
Calculation result of𝒓 is compared with rtable by 5% degree of significance
with df=N-2. If𝐫 was higher than rtable so it meant reliable and if r is lower than rtable so it meant unreliable. In this case, the writer applied the coefficient
correlation and the interpretation of inter-rater reliability proposed by Winkle et al as shown in table 3.3. 8
Table 3.3. Inter-Rater Coefficient Correlation and Interpretation
Correlation Coefficient Interpretation
.90 to 1.00 or -.90 to -1.00 Very high positive or negative correlation .70 to .89 or -.70- to -.89 High positive or negative correlation .50 to .69 or -.50 to -.69 Moderate positive or negative correlation .30 to .49 or -.30 to -.49 Low positive or negative correlation .00 to .29 or -.00 to -.29 Little if any correlation
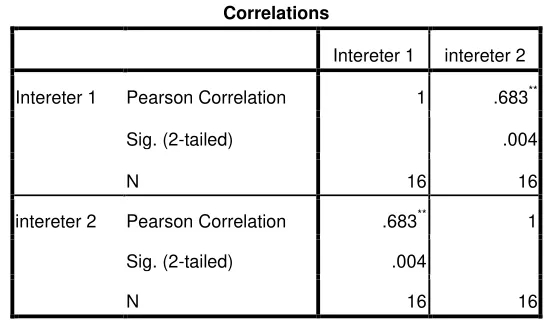
Table 3.4 Testing Correlation
Correlations
Intereter 1 intereter 2
Intereter 1 Pearson Correlation 1 .683**
Sig. (2-tailed) .004
N 16 16
intereter 2 Pearson Correlation .683** 1
Sig. (2-tailed) .004
N 16 16
**. Correlation is significant at the 0.01 level (2-tailed).
8
Table showed the calculation above that used SPSS program, the r was 0.683. Then it was consulted with rtable of Product Moment with df= 16-2= 14, the
level of significance 5% so rtable = 0.532. Because r=0.683 >rtable= 0.532. It could
be concluded that the data was reliable.
Based on the result of Instrument Reliability above, it was known that the coefficient of reliability was 0.683 with the Criteria Moderate positive Reliability. It meant that the instrument could be used as the Instrumentation of the study.
3. Research Instruments Validity
Based on Sugiyono, the result of study is called valid if there was a similarity between the data that have collected by the testes and the true data that happened on the object of the study9. Sugiyono states:
Instrumen yang valid berarti alat ukur yang digunakan untuk mendapatkan data (mengukur) itu valid. Valid berarti instrumen tersebut dapat digunakan untuk mengukur apa yang hendak diukur".96 (Validity instrument it means the instrument that used to get the data (measure) is valid. Valid it means the instrument can be used to measure what are we want to measure).
Spolky stated that validity is the central problem in foreign language testing. Validity is concerned with whether a test measures what it is intended to measure. A test of speaking ability in a classroom setting is usually an achievement test. An achievement test should have content and face validities. Since content validity asks if the test content matches the content of the course of
9
study, what teachers can do is to match the course objectives and syllabus design with the test items10.
Thre are several types of validity: a. Face Validity
It is a term sometimes used in connection with a test’s content. Face
validity refers to the extent to which examinees believe the instrument is measuring what it is supposed to measure. Face validity ensure that the test items look right to other testers, teacher, indicators and test.11
For face validity of the test items as follow:
1) The test will use speaking test in speaking test instruction. 2) The evaluation by speaking test based on scoring system.
3) Kind of the speaking test is speking performance (interview, telling story, conversation).
4) The Language of items used English. b. Content Validity
It is especially important for achievement tests; it is also a concern for other types of measuring instruments, such as personality and aptitude measures. Content validity demands appropriateness between the ability to be measured and the test being used to measure it. The writer used speaking test for students. The students in this study will perform their speaking in
10
Kim, Hyun Sook, “The Types of Speaking Assessment Tasks used by Korean Junior Secondary School English Teachers”, http://www. Asian-efl-journal.com/dec_03_gl_kr.php.
11
giving opinion, so the test will measure the speaking ability of the students. The speaking test will be suitable with the materials of podcast taught by lecturer in the class.
F. Data Collection Procedures
In this study the writer used interview as a test. Then rate the score of aspects of academic speaking ability such as, vocabulary, pronunciation, grammar and cohesion in a table and make a note about the score.
In this study the writer used some processes to collect the data.
1. The writer observed the Class A and D (third semester student of English education in State Islamic Institute of Palangka Raya).
2. The writer divided the students (sample) into two groups (experimental and control) by using cluster sampling.
3. The writer gave a pre-test to both groups (experimental and control). 4. The writer checked the result of pre-test of experimental and control group. 5. After the pre-test given, the writer taught the students in experimental
group and control group by using podcast but it used different technique. Experimental group was taught using intensive listening and control group taught using extensive listening. The treatments were done 4 meetings. 6. After doing the treatments, the writer gave the post-test to both groups. 7. The writer gave scores to students’ speaking performance by using scoring
examine the significant difference score between experimental and control group.
8. Finally, the writer compared the students’ scores in the pre-test and post-test. It is done to know whether the students’ scores in experimental group
are higher or not than students’ scores in control group. G. Data Analysis Procedures
To analyze the data, the writer did some procedures. They are:
1. The writer gave test (pre-test and post test) to experiment and control class. 2. The writer collected the data of the students’ test result.
3. The writer gave score the students’ test result by using the formula:
Score = 𝐵
𝑁 × 100%
Where:
B : Sum of student’s band obtained. N : Sum all of band
4. The writer tabulated the data into the distribution of frequency of score table, then looking for the mean, median and modus of students’ score,
standard deviation, and standard error of experiment group and control group.
a. Mean
𝑀𝑥 = ∑𝑓𝑥
𝑁
Fx : Total result product between each score with frequency
N : Number of case
b. Median
Me = 1
2 x
n
2 + x
n
2+ 1
Where:
Me : Median
n : Number of case
c. Modus
This study used single data so the modus definited by using the greatest number of frequency.
d. Standard Deviation
SD = 𝑛.∑ 𝑓𝑋𝑖2− ∑ 𝑓𝑋𝑖 2 𝑛 𝑛−1
Where:
SD : Standard Deviation
n : Number of students
f : frequency
Xi : Score
e. Standard Error
𝑆𝐸𝑚= 𝑠𝑑
𝑛−1
SEm : Standard Error Sd : Standard Deviation N : Number of students12
5. The writer calculated normality and homogeneity. a. Normality
It is used to know the normality of the data that is going to be analyzed whether both groups have normal distribution or not. It could be calculated by using SPSS 16. If the calculation result is higher than 0.05 it means the distribution list is normal .
b. Homogeneity
It is used to know whether experimental group and control group, that are decided, come from population that has relatively same variant or not. It could be calculated by using SPSS 16.
The hypotheses in homogeneity:
If calculation result of d a t a is lower than 0 . 0 5 so Ho is accepted, it
means both groups have same variant.
6. The writer calculated the data by using t-test to test the hypothesis of the study. To examine the hypothesis, the writer used t-test statistical calculation as follows:
12
o
SEm1-SEm2 : The standard error of difference between two mean. To know the hypothesis is accepted or rejected using the criterion: If t-test ≥ ttable, it means Ha is accepted and Ho is rejected.
If t-test ≤ ttable, it means Ha is rejected and Ho is accepted.13
7. The writer decided to use ttable 5%
8. The writer interpreted the result of t-test. The writer account degree of freedom (df) with the formula as follows:
df = (N1 + N2−2)
9. The writer discussed and concluded the result of data analysis.
13
Anas Sugiono, Pengantar Statistik Pendidikan, Jakarta: Rajawali Press, 1978, p. 372
14