THE IMPACT OF ENVIRONMENTAL PERFORMANCE AS REALIZATION OF ENVIRONMENTAL REGULATION ON
FINANCIAL PERFORMANCE
Ika Prayanthi Deske Mandagi
University of Klabat, Airmadidi, North Sulawesi, Indonesia
Abstract:
The purpose of this study is to assert the impact of environmental performance as realization of environtmental regulation on financial performance for the span of one to three years (2010-2013) after the publication of environmental performance ratings. Environmental performance was measured by the ratings given by PROPER program, and financial performance was measured based on ROA and ROE. This study also examined if there is significant difference on financial performance among the group of companies on each rating. The research finding shows that there was no significant impact of environmental performance on financial performance on the first year announcement of the financial ratings, however there was a significant impact on the second and third year. Different tests using ONE WAY ANOVA indicated that there was significant difference on financial performance of companies in different rating, in each year. The result suggested that companies with green rating had the highest financial performance followed by gold rating.
INTRODUCTION
Along with the increasing of globalization, the awareness of issues related to management risk, continuity as well as the growth of a business compels a company or organization to remain stable yet still responsible for the social and environmental matters (Owen, 2005). In connection with its responsibilities toward the environment, Cramer (2006) said that a company will not be able to be well-publicized if the working conditions are poor, scandals involving the environment exist, as well as violations of human rights. Further, it was mentioned that these things will ruin a
company’s reputation, which in turn will result in the declining of sales up
to the declining of employee’s motivation.
The concepts that the purpose to gain profit is simply by increasing shareholder profits in the form of distribution of dividends and the increasing of stock price are narrow perspectives if they ignore the contribution of other things, which are also affected the success of a business (Sharma, 2009). That is the reason why there are companies that look at issues concerning social and the environment as an opportunity to position themselves in public as companies that are responsible for the social and environment. This is intended to increase the value of their shares, to motivate their employees to work innovatively for the company (Cramer, 2006). Ravi and Anupam (2011) stated a similar case, where in a company or organization with a good image in the social and environmental fields will increase its reputation and reduce government intervention as well as other stakeholders. Moreover, it is said that with the
increasing of a company’s reputation, hence it will attract more consumers,
which later on will increase sales, and the company will eventually enjoy more profits, and also good relations with the stakeholders could be established.
To achieve these goals, some companies apply the Corporate Social Responsibility (CSR) concept. CSR is a concept in which a company integrates social and environmental matters in its operational activities and interactions with stakeholders (Aras and Crowther, 2010). Ravi and Anupam (2011) stated that if a company implements CSR, the company will find more new business partner and that it will give many new opportunities.
companies that will only react after they are being required by the laws or regulations set by the government.
In Indonesia, the government has issued a regulation, which is the law No. 32 of 2009, concerning the protection and management of the living environment. In order to realize the implementation of this law, the Office of the Ministry of Living Environment has a program, namely the PROPER Program, which aims to assess the environmental performance of each company. Although the PROPER Program was developed by the Ministry of Environment as early as 1995, but in relation to the law No. 32 of 2009 the Ministry of Environtment has updated the environmental performance assessment that is adjusted with law No. 32 of 2009. In other words, the PROPER Program is also an implementation of Legislation No. 32 of 2009 about environmental protection and management. The Ministry for Environment Decree Number 97 of 2005 stated that in order to maintain the credibility of the PROPER Program, there should be an advisory, consisting of representatives from universities, environmental NGOs, mass media, banks, international institutions, and other institutions with environmental interest. Therefore, the assessment for environmental performance of companies would be appropriately comprehensive. This is also in accordance with what was mentioned by Gomez (2008), that the multidimensional factors are considered simultaneously when formulating and assessing environmental performance of a company.
In connection with the laws made by the government, Walley and Whitehead (1994) stated that most managers perform environmental management as a result of obedience to the effective laws and regulations.
Environmental management is a company’s strategy that will be reflected
in the environmental performance based on a certain evaluation standard. Further, it is said that a good environmental management strategy will produce a good environmental performance, and a good environmental performance will have a good impact towards a company's financial performance (Klassen & McLaughlin, 1996).
The purpose of this study is to assert the impact of environmental performance on financial performance for the span of one to three years after the publication of environmental performance ratings. The study period was from 2010 – 2013, with the consideration that the management changes their environmental management strategy to obtain rating in the PROPER Program, whose assessment is adjusted with the mentioned legislation. In 2010, the announcement of PROPER rating a year after the law No. 32 of 2009 was made. Moreover, the impact of environmental
performance on a company’s financial performance a year after the
announcement of the environmental performance, which is in 2011, the impact for two years after that, which is in 2012, and the impact of three years after, which is in 2013, will also be analysed.
The purpose of this study is to prove whether environmental performance as a realization of compliance to environmental laws have significant impact on financial performance (ROA and ROE) after first to three years environmental performance rating was announced by the Ministry of Environment through the PROPER Program. Further, this study also examine if there is any significant difference of company's financial performance among a group of companies in environmental performance rating.
RESEARCH METHOD
Purposive Sampling Method was used in this study. A linear regression analysis was used in order to examine the impact of
environmental performance on a company’s financial performance.
Environmental performance is the independent variable, which was measured by the rating given by the PROPER Program. The dependent
variable is the company’s financial performance, measured by ROA and ROE. The samples of this study consist of companies that are listed and had received rating according to the PROPER Program year 2010.
FINDINGS AND DISCUSSION
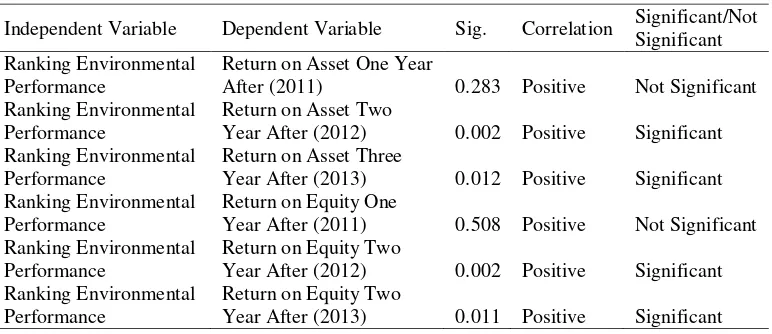
by gold rating category. The details of the result are presented on the table 1 below and on the appendix .
Table 1: Regression Test Result
Independent Variable Dependent Variable Sig. Correlation Significant/Not Significant Ranking Environmental
Performance
Return on Asset One Year
After (2011) 0.283 Positive Not Significant Ranking Environmental
Performance
Return on Asset Two
Year After (2012) 0.002 Positive Significant Ranking Environmental
Performance
Return on Asset Three
Year After (2013) 0.012 Positive Significant Ranking Environmental
Performance
Return on Equity One
Year After (2011) 0.508 Positive Not Significant Ranking Environmental
Performance
Return on Equity Two
Year After (2012) 0.002 Positive Significant Ranking Environmental
Performance
Return on Equity Two
Year After (2013) 0.011 Positive Significant
Table 2: Different Test Result Financial
Performance Difference Sig.
Significant/Not Significant
ROA 2011 0.104 Not Significant
ROA 2012 0.001 Significant
ROA 2013 0.000 Significant
ROE 2011 0.001 Significant
ROE 2012 0.002 Significant
ROE 2013 0.000 Significant
Different tests results shown in Table 2 were all significant except ROA 2011, this study found that there was a significant difference to the company's financial performance both ROA and ROE each year from 2010 to 2013 in each environmental performance rating category, where the green rating class had a higher financial performance compared with other environmental performance rating class (For more details see appendix )
CONCLUSIONS
The result of this study shows that in the case of Indonesian companies, compliance to environtmental regulation (PROPER program) significantly impact the financial performance. The impact was significantly shown after 2 years after the announcement of environtmental performance rating. Furthermore, companies that implement compliance toward environtmental regulation, had a significant effect on finacial performance.
Theoretically, this study provides empirical evidence support the impact of compliance to environmental legislation that became the basis for determining environmental performance and its relationship to the company's financial performance. This research provide a reference for development of environmental regulation, accounting practices, and
company’s environmental management and strategy.
Practically, the results of this study provide information for the financial company or fun provider in analyzing company's credit applications. In addition, this study provides information to investors about all factors related to the environment as a consideration in determining investment decisions.
REFERENCES
Allouche, J., & Laroche, P. (2005). A Meta-Analytical Investigation Of The Relationship Between Corporate Social And Financial Performance. Revue de Gestion Des Ressources Humaines(57), 18-41.
Arafat, M. Y., Warokka, A., & Dewi, S. R. (2012). Does Environmental Performance Really Matter? A Lesson From The Debate Of Environmental Disclosure And Firm Performance. Journal Of Organizational Management Studies, 2012, 1-15.
Aras, G., & Crowther, D. (2010). A Handbook Of Corporate Governance And Social Responsibility. Farnham: Ashgate Publishing Ltd.
Cramer, J. (2006). Corporate Social Responsibility And Globalization: An Action Plan For Business. Sheffield: Greenleaf Publishing.
Klassen, R., & McLaughlin, C. (1996). The Impact Of Environmental Management On Firm Performance. Management Science, 42(1), 1199-1214.
Orlitzky, M. (2001). Does Firm Size Confound The Relationship Between Corporate Social Performance And Firm Financial Performance?
Journal of Business Ethics, 33(2), 167-180.
Owen, D. (2005). CSR After Enron: A Role For The Academic Accounting Profession? European Accounting Review, 14(2), 395-404.
Quazi, A., & Richardson, A. (2012). Sources Of Variation In Linking Corporate Social Responsibility And Financial Performance.
Social Responsibility Journal, 8(2), 242-256.
Ravi, K., & Anupam, S. (2011). Corporate Social Responsibility: A Corporate Strategy For New Business Opportunities. Journal Of International Business Ethics, 4(1), 10-17.
Rodriguez, m. d., Gallego, A. C., & Perez, B. E. (2014). Corporate Social Responsibility And Financial Performance: A Meta-Analysis.
Revista Espanola De Financiacion y Contabilidad, 43(2), 193-215.
Sharma, S. G. (2009). Corporate Social Responsibility In India: An Overiview. The International Lawyer, 43(4), 1515-1533.
Subroto, P. H. (2003). A Correlation Study Of Corporate Social Responsibility And Financial Performance: An Empirical Survey Toward Ethical Business Practices In Indonesia. Cappela University. Ann Arbor: UMI Dissertation Publishing.
Sun, L. (2012). Further Evidence On The Association Between Corporate Social Responsibility And Financial Performance. International Journal Of Law And Management, 54(6), 472-484.
Van Beurden, P., & Gossling, T. (2008). The Worth of Values - A Literature Review On The Relation Between Corporate Social And Financial Performance. Journal of Business Ethics, 82(2), 407-424.
Walley, N., & Whitehead, B. (1994). It's Not Easy Being Green. Harvard Business Review, 72(3), 46-52.
APPENDIX
Environmental Performance ROA 2011 Model Summary
Mode l
R R Square Adjusted R Square
Std. Error of the Estimate
1 .142a .020 .003 12.80310
a. Predictors: (Constant), Ranking Environmental Performance
ANOVAa
Model Sum of
Squares
Df Mean Square F Sig.
1
Regression 192.243 1 192.243 1.173 .283b
Residual 9343.410 57 163.919
Total 9535.653 58
a. Dependent Variable: Return on Asset 2011
Coefficientsa
a. Dependent Variable: Return on Asset 2011
Environmental Performance ROA 2012
Model Summary
a. Predictors: (Constant), Ranking Environmental Performance
a. Dependent Variable: Return on Asset 2012
b. Predictors: (Constant), Ranking Environmental Performance
a. Dependent Variable: Return on Asset 2012
Environmental Performance ROA 2013
Model Summary
Mode l
R R Square Adjusted R Square
Std. Error of the Estimate
1 .326a .106 .090 12.95105
a. Predictors: (Constant), Ranking Environmental Performance
ANOVAa
Model Sum of Squares Df Mean Square F Sig.
1
Regression 1134.744 1 1134.744 6.765 .012b
Residual 9560.592 57 167.730
Total 10695.336 58
a. Dependent Variable: Return on Asset 2013
b. Predictors: (Constant), Ranking Environmental Performance
Coefficientsa
Model Unstandardized
Coefficients
Standardized Coefficients
t Sig.
B Std. Error Beta
1
(Constant) -15.257 8.714 -1.751 .085
Ranking Environmental Performance
7.584 2.916 .326 2.601 .012
a. Dependent Variable: Return on Asset 2013
Environmental Performance ROE 2011
Model Summary
Mode l
R R Square Adjusted R Square
Std. Error of the Estimate
1 .088a .008 -.010 23.84177
ANOVAa
Model Sum of
Squares
Df Mean
Square
F Sig.
1
Regression 252.027 1 252.027 .443 .508b Residual 32400.500 57 568.430
Total 32652.526 58
a. Dependent Variable: Return on Equity 2011
b. Predictors: (Constant), Ranking Environmental Performance
Coefficientsa
Model Unstandardized
Coefficients
Standardized Coefficients
t Sig.
B Std. Error Beta
1
(Constant) 11.046 16.042 .689 .494
Ranking Environmental Performance
3.574 5.368 .088 .666 .508
a. Dependent Variable: Return on Equity 2011
Environmental Performance ROE 2012
Model Summary
Mode l
R R Square Adjusted R Square
Std. Error of the Estimate
1 .394a .155 .140 31.04959
a. Predictors: (Constant), Ranking Environmental Performance
ANOVAa
Model Sum of Squares Df Mean Square F Sig.
1
Regression 10097.852 1 10097.852 10.474 .002b
Residual 54952.381 57 964.077
Total 65050.233 58
a. Dependent Variable: Return on Equity 2012
Coefficientsa
a. Dependent Variable: Return on Equity 2012
Environmental Performance ROE 2013
Model Summary
a. Predictors: (Constant), Ranking Environmental Performance
ANOVAa
a. Dependent Variable: Return on Equity 2013
b. Predictors: (Constant), Ranking Environmental Performance
Coefficientsa
Different Test Result ROA 2011
Lower Bound Upper Bound
Different Test Result ROE 2011
Descriptives
Return on Equity 2011 N Mean Std.
Deviation
ANOVA
Return on Equity 2011 Sum of Squares
df Mean
Square
F
Between Groups
8634.305 3 2878.102 6.591
Within Groups 24018.221 55 436.695
Total 32652.526 58
Different Test Result ROA 2012
Descriptives
Return on Asset 2012
N Mean Std. Deviation
Std. Error
95% Confidence Interval for Mean
Minimum Maximum
Lower Bound
Upper Bound
Red 11 3.2900 10.42391 3.14293 -3.7129 10.2929 -11.69 20.93 Blue 42 6.6483 6.55234 1.01105 4.6065 8.6902 -8.21 18.85 Green 5 23.5640 17.60024 7.87107 1.7104 45.4176 -.99 40.38
Gold 1 11.1000 . . . . 11.10 11.10
Total 59 7.5312 9.83879 1.28090 4.9672 10.0952 -11.69 40.38
ANOVA
Return on Asset 2012 Sum of Squares
df Mean
Square
F Sig.
Between Groups
1528.592 3 509.531 6.859 .001
Within Groups 4085.916 55 74.289
Different Test Result ROE Tahun 2012
Descriptives
Return on Equity 2012 N Mean Std.
Deviation
Std. Error 95% Confidence Interval for Mean
Different Test Result ROA 2013
Descriptives
Return on Asset 2013
N Mean Std. Deviation
ANOVA
Different Test Result ROE 2013