Quality and Purchase Intention Perceived towards
Low Cost Energy-Saving Cars
Edhie Budi Setiawan STMT Trisakti [email protected]
ABSTRACT
Low cost car does not mean having low quality. This is the assumption that the producers or sellers of especially energy-saving car want to emphasize. This research on the desire and expectation of every car producer and dealer in Indonesia who tries to be perceived as having the best quality on their consumers mind and on the increase of consumer purchase intention is carried out using a qualitative method as well as the concept of perceived service quality—whichshows the difference between bibliographic study and the actual condition.
Introduction
More than one million cars were sold in Indonesia in 2013. This number of sale is predicted to sustainably increase. Auto-motive business has grown fast. It is caused by, among others, the improved prosperity of people that increases the number of people in middle-up class category as well as their purchasing power. No one can deny that the sales of car in Indonesia is dominated by Japanese companies (Toyota, Daihatsu, Suzuki, Mitsubishi, Honda, Nissan, Hino, and Isuzu), and followed by Korean companies.
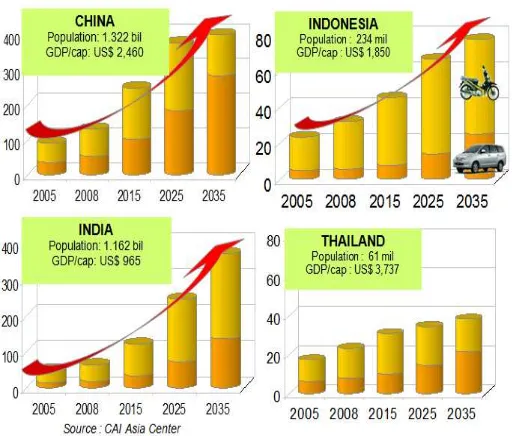
Referring to the global trend, potential market, and government attention on the low cost car, Indonesia has a chance to become the base of production as having been done by China, India, and Thailand. Indonesia has a potential market similar with China and India, i.e. growing market as illustrated in Figure 1.
Director General of High Technology-Based Superior Industry of the Ministry of Industry, Budi Darmadi says that low cost
green car (LCGC) can suppress the import of automotives from other countries, as quoted by Antara, in Jakarta, Wednesday (14/8/2013).
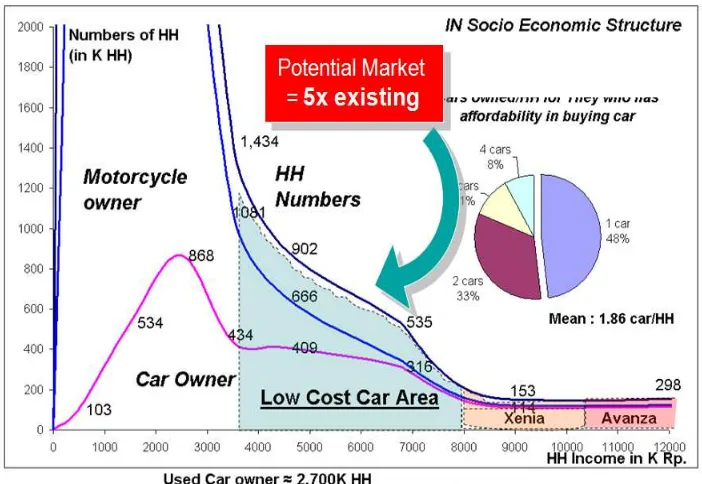
The market for four-wheel vehicles in Indonesia has been growing in line with the economic growth but its growth is still not optimum. In fact, the four-wheel vehicle industry in Indonesia has an opportunity to keep growing by developing new market segments in accordance with the prosperity and purchasing power of Indonesian people. The market segments have a big potential, about 300-600 thousand units per year for the households with income around IDR 4 to 8 million per month. It can be stated explicitely that irst-time car buyers are those in the age of 20 to 39 and are the second biggest population in Indonesia (Figure 2).
The prices offered by dealers are much varied ranging from IDR 77.8 million to IDR 120.8 million, depending on the brand and speciication. For more detail, see Figure 3. Based on the data on sales (market share), it is seen that Toyota
Agya occupies the top position with market share 40.7%, followed by Daihatsu Ayla (26.3%). In the bottom position there are Nissan, Datsun Go+ (7.1%), and Suzuki Wagon R (11.2%).
This condition is different from the result of survey on QUALITY carried out by JD Power Asia Paciic, an independent survey institution based in Singapore, which shows that Suzuki Wagon R occupies the top position, followed by Toyota Agya and Daihatsu Ayla (see Figure 4). This condition makes the author interested in studying how the perception on quality affects the buying intention for low cost green cars.
In the business environment, customers demand quality and companies try to meet it, creating competition in quality. Powell (1955) explicitely states that the quality programs such as Total Quality Management, Baldrige Awards, and Six Sigma have helped companies in improving their quality, especially in manufacture. Not only that, academic researches also give contribution to us in understanding quality.
For example, the marketing explanation about service quality has improved our understanding in the perception on quality, customer expectation, and satisfaction (Bouldinget al. 1993; Cronin and Taylor 1994; Oliver 1980; Parasuraman, Zeithaml, and Berry 1985, 1988; Zeithaml 1988).
According to Aaker (1991), Perceived quality can be deined as the customer’s perception on the total quality or excellence of a product or service relative to the alternatives.
Some writers propose an alternative Quality Framework of product or service but not in the integrated sight of both (Parasuraman, Zeithaml, and Berry 1988; Brucks, Zeithaml, and Naylor 2000; Brady and Cronin 2001). Some researchers integrate the perceived service quality and perceived product quality (Lien Ti Bei, Yu Chin Chiao, 2001; Peter N. Golder, Debanjan Mitra, & Christine Moorman, 2012,).
It can be said that most industries, including automotive industry, provide tangible goods and intangible services, and Figure 2. Emerging Market Size
40.7% 26.3% 14.7% 11.2% 7.1% Market Share
120
110
100
90
80
70
A
gy
a
A
y
la
B
rio
S
a
ty
a
Wa
g
o
n
R
D
a
ts
un G
o
+
99,9 120,8
115,4
77,8
117,6
106,6
83,2 103,5
85,3 100,3 (Mil)
(Model)
Figure 3. Prices vs Market Share (August 2014)
Source: Self-processed from Gaikindo and the dealers’ oficial web
Figure 4. The best three cars in the segment of Entry Compact Car
both of them have important roles in the purchase intention. Therefore, perceived quality which will be studied in this article is divided into two: perceived product quality and perceived service quality.
How a product looks, feels, sounds, tastes, and smells is of personal judgment. It shows how important a better understanding in the perceived product quality is (Garvin, 1984). In another word, it is important to identify the differences between the ways the producers and consumers perceive quality (Morgan, 1985).
This study uses the concept of perceived product quality from Brucks et al (2000) since this concept has conformity with the character of the object to be studied; i.e. the quality dimension of durable goods. Since this research is carried out in the automotive industry which is categorized
durable product, thus the dimensions of perceived product quality to be used are (1) Ease to use, (2) Versatility, (3) Durability, (4) Serviceability, (5) Performance, (6) Prestige. See Table 1.
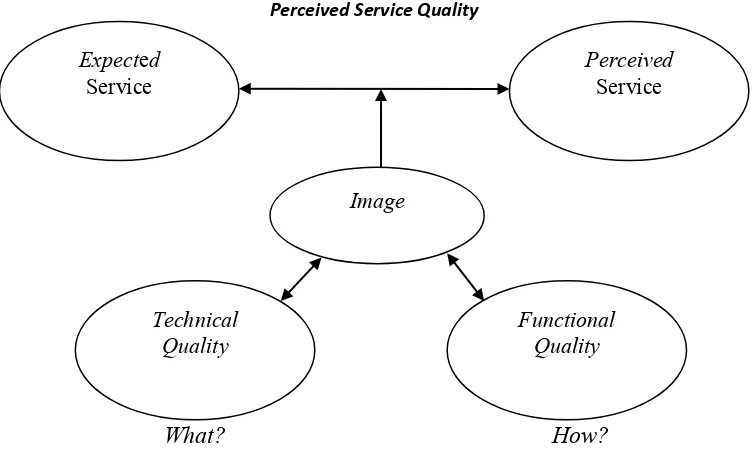
According to Gronroos (1984) related to perceived service quality it is said that: [...] The result of evaluation process, [in which] consumers compare their expectation with the service they have seen and received, i.e. they position the service they received against the service they expect. The result of this process will become the perceived service quality. This Gronroos’ opinion (1984) is followed by Rust and Oliver (1994). It can be seen on Figure 5.
The second theme, the deinition of perceived service quality from Parasuraman et al. (1991, 445) says that: servqual is a
(1) Ease of use Consumer’s ability to start and operate the product and the clarity of instrumentations and instructions;
(2) Versatility Involving the number and complexity of characteristics that differentiate the model or brand with the lower model;
(3) Durability
Involving product life cycle, efecive product life cycle (i.e. whether it frequently need services); and how well the product scrape along the weather, heavy use, or misuse;
(4) Serviceability
Including the ease for consumers to ind maintenance service (i.e. access to service center and/or the ease for self-service), the response of service oficers (i.e. the ease to make a date, the maintenance personnel’s willingness to listen to the customer), and the service reliability (i.e. whether the service is delivered right in the irst time);
(5) Performance
Referring to how well a product performs what it must perform. For example, the performance of a car involves its strength, security, and comfort;
(6) Prestige Involving how well a product communicates its excellence to the buyers and relevant buyer communities;
Source: Brucks (2000:361)
generic instrument having good reliability, validity and broad implementation [...] The aim of servqual is for diagnostic methodology in revealing the weak and strong area of a company’s service quality. The dimension and point of servqual represent the criterion of core evaluation which cope with certain companies and industries.
Related to this opinion, according to Riadh Ladhari (2009), many researchers use servqual to measure service quality in various service industries such as Banking (Chi Cui et al 2003; Arasli et al. 2005), Health Instrumentations (Kilbourne et al. 2004, Baldwin et al. 2003); Information Technology (Jiang et al, 2000; Badri et al. 2005); Telecommunication (Van der Wal et al, 2002); Library (Cook and Thompson, 2000). According to Dabholkar et al (1996,1) Servqual has been empirically tested in a number of studies involving “pure” service settings.
Then, the third theme, the concept of perceived service quality from Dabholkar et al (1996, 13) says; the analysis on the service quality can be done in the aggregate
level (full scale), in the factor level (using points in the given dimension), and in the subdimension level (using points in the given subdimension). This concept is related to the construction structure of service quality that uses the hierarchical concept of retail service quality. This concept is supported by Brady and Cronin (2001) who examine four service industries (fast food, photograph, garden hall, and dry cleaning), and Wilkins et al (2007) for hotel industry.
Meanwhile, the dimension of perceived service quality according to Gronoos (1984) says; the dimension of perceived service quality as functional quality (the core service or what is delivered) and technical quality (how the service is delivered). Then Gronroos (2007) classiiies service into three categories , namely core service, facilitating service, and supporting service. Facilitating service and supporting service are the details of functional quality, while core service is the analog of technical quality. In line with this research, Rust and Oliver (1994) propose a three-component model, namely (1) service Figure 5. Gronroos’ Model of Perceived Service Quality
Source: Gronroos (1984)
Perceived Service Quality
Expected Service
Perceived Service
Technical Quality
Functional Quality Image
delivery (functional quality), (2) service product (technical quality), and (3) service environment.
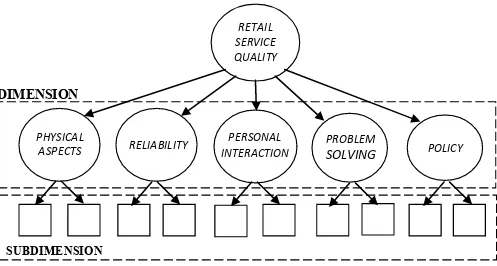
Furthermore, the dimension of perceived service quality according to the research done by Dabholkar et al (1996) uses the hierarchical concept of service quality as follows: (1) Physical aspects, (2) Reliability, (3) Personal interaction, (4) Problem solving, and (5) Policy (see Figure 7).
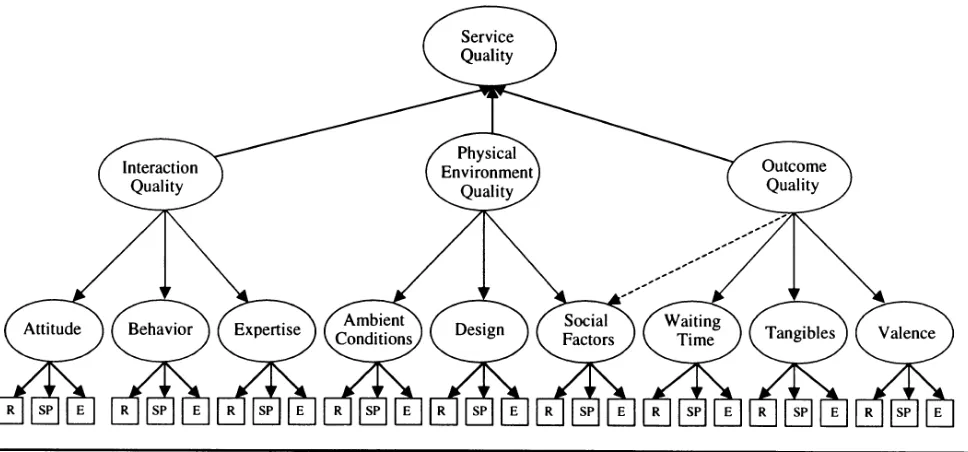
Some other researchers using hierarchical approach are Brady and Cronin (2001) with their dimension of interaction quality, physical environment quality, and outcome quality. Wilkins et al (2007) even uses hierarchical approach for hotel industry and the dimensions used are physical product, service experience, and
quality food and beverage.
From several concepts of perceived service quality that have similarities, the research in this writing follows Brady and Cronin (2001) with the dimensions of perceived service quality that will be used are (1) interaction quality, (2) physical environment quality, and (3) outcome quality (se Figure 8).
Related to purchase intention, Samin et al (2012) states: “intention is the person’s motivation in the sense of his or her intention to perform behavior”. This is in line with the previous research done by Ajzen (1991) who states: intentions are assumed to grab the motivation factors inluencing a behavior; they indicate how dificult people are willing to try from how many efforts they plan to do
RETAIL SERVICE QUALITY
POLICY PERSONAL
INTERACTION
PROBLEM
SOLVING
RELIABILITYPHYSICAL ASPECTS
DIMENSION
SUBDIMENSION
Figure 7. Dabholkar’s Model of perceived service quality
in order to meet the behavior. When the consumer has a purchase intention and positive commitment to a brand, thus this is an encouragement for the consumer to take a real buying action (Fishbein and Ajzen, 1975; Schiffman and Kanuk, 2007). Subsequently, the increase of purchase intention means the increase of opportunity for purchasing, according to Dodds et al (1991).
According to Kwek (2010) purchase intention can be classiied as one of the consumer’s cognitive behavior components regarding the individual who intends to purchase a certain brand. This opinion is in line with Teng Lefa and Laroche (2006) that purchase intention is one of the assessments regarding the individual who intends to purchase a certain brand.
The research for studing this uses the concept of purchase intention from Long-Yi Lin and Ching-Yuh Lu (2010). Their opinion is used as a base for explaining the existence of external stimulation factor in terms of price, product, from mouth to mouth (word of mouth) and brand image in the process of car purchasing.
There is one similarity from the concept and measurement of purchase intention as explained above; namely, they have one dimension: Willingness to Buy (Grewal 1998), the difference is only the way to measure that dimension.
Analysis and Discussion
The Correlation between Perceived Product QualityandPurchase Intention
Schiffman and Kanuk (2007) state purchase intention as consumer’s decision making process in running his or her need, purchasing, evaluation, and product or service utilization to meet their need.
Based on the concepts of purchase intention from some experts, it can be interpretated that purchase intention is a purchasing decision process made by someone, starting from intention, consideration, expectation, and purchase plan which is inluenced by external factors.
This research uses the measurement of purchase intention based on Tsui Yu Shih (2010, 58): we choose three items including Figure 8. Brady & Cronin’s Model of perceived service quality
willing purchase, considering purchase and recommendation purchase to be the measure items of a purchase intention. This dimension is an integration of several researches. According to Compeau et al (1998), Grewal et al (1998), purchase intention is measured by willingness to buy for a product; Laroche et al (1996), Teng et al (2007) say purchase intention is one of the assessments regarding how someone intends to buy a certain brand.
Meanwhile, Brucks et al (2000) conclude that in the total quality, the dimension of quality is a better base for understanding the important correlation involved in the consumer assessment and choices. Furthermore, the research done by Wells, Joseph, and Tracy J (2011) related to the correlation between perceived product quality and purchase intention shows a signiicant correlation. This is in line with the previous research done by Boulding and Kirmani (1993), Dodds et al (1991), and Rao et al (1999).
Some other researchers also explain the correlation between perceived product quality and purchase intention are Tsiotsou (2005) for sport shoes and Shaharudin et al (2010) for motorcycle/scooter.
Researches in purchase intention done by Teng Lefa & Laroche (2006) and Teng et al (2007) also use one dimension with four kinds of measurement, namely (1) intend to buy, (2) consider buying, (3) expect to buy, (4) plan to buy which are done for the products of shoes and camera. In line with the above-mentioned researches, Young et al (2008) carry out a research in the product of foods using three kinds of measurement, namely (1) plan to continue purchasing, (2) intend to increase the size, (3) intend to increase the frequency.
Another research related to purchase intention is also done by Wu et al (2010) in drugstore using two kinds of measurement: (1) intend to buy, (2) plan to buy. Meanwhile, Tsui Yu Shih (2010) in his research in retail
store uses three kinds of measurement: (1) willing purchase, (2) considering purchase, (3) recommendation purchase.
The Correlation between Perceived
Service Qualityand Purchase Intention.
Based on the concept of perceived service quality from some experts, it can be interpretated that perceived service quality is a consumer judgment against the quality of service he or she receives and perceives by comparing the expected service in the dimension level of interaction quality, physical environment quality, and outcome quality.
This research is deliberately uses the concept of perceived service quality from Dabholkar et al (1996, 13). His opinion is used as the research base because it has variable dimensions suitable with the characteristics of the object to be studied. This sis in line with the opinion of Brady and Cronin (2001): This multilevel model recognizes the many facets and dimensions of service quality perceptions.
According to Taylor & Baker (1994), the development of better undertanding on how the assessment of perceived service quality and customer satisfaction interact and/or inluence each other in creating consumer’s purchase intention ...”
There is a debatable problem concerning the correlation between perceived quality and purchase intention. Some experts have found the correlation between perceived quality and purchase intention (Carman, 1990; Boulding et al, 1993; Parasuraman et al, 1996), while some others report indirect correlation that is mediated by satisfaction (Cronin and Taylor, 1992).
a signiicant effect on behavioural purchase intentions...”
Conclusion
Tight competition between producers and consumers, and even sellers of low cost green car, shows the different condition between bibliographical study and the actual condition. Bibliographical study shows the inluence of perceived product quality and perceived service quality on the consumer’s purchase intention, while the actual condition does not show the inluence of perceived quality on purchase intention represented by the sales volume of low cost energy-saving car. Therefore, it is necessary to carry out further researches to examine the impact of perceived quality on purchase intention in the segment of low cost energy-saving car in Indonesia.
References
Ajzen I. 1991. The theory of planned behaviour. Organizational behaviour and human decision processes, 50: 179-211.
Arasli, H., Mehtap-Smadi, S. and Katircioglu, S.T. 2005. Customer service quality in the Greek Cypriot banking industry. Managing Service Quality. 15 (1): 41-56.
Baldwin, A. and Sohal, A. 2003. Service quality factors and outcomes in dental care. Managing Service Quality. 13 (3): 207-16.
Boulding, W., and Kirmani, A. 1993. A Consumer-Side Experimental Examina- tion of Signaling Theory: Do Con-sumers Perceive Warranties as Signals of Quality? Journal of Consumer Research 20 (1): 111-123. Brady, Michael K. and Joseph Cronin
Jr. .2001. Some New Thoughts on Conceptualizing Perceived Service Quality: A Hierarchical Approach.
Journal of Marketing, 65 (July): 34– 49.
Brucks, Merrie, Valarie A. Zeithaml, and Gillian Naylor. 2000. Price and Brand Name as Indicators of Quality Dimensions for Consumer Durables.
Journal of the Academy of Marketing Science. 28 (3): 359–74.
Carman, J. M. 1990. Consumer Perceptions of Service Quality: An Assessment of the SERVQUAL Dimensions.
Journal of Retailing. 66 (1): 33-55. Chi Cui, C., Lewis, B.R. and Park, W.
2003. Service quality measurement in the banking sector in South Korea. International Journal of Bank Marketing. 21 (4/5): 191-201.
Cook, C. and Thompson, B. 2000. Reliability and validity of SERVQUAL scores used to evaluate perceptions of library service quality.
Journal of Academic Librarianship. 26 (4): 248-58.
Compeau, L. D. and Grewal, D., 1998. Comparative advertising: An integrative review. Journal of Public Policy and Marketing. 17 (2): 257-273.
Cronin, J. Joseph, Jr., and Steven A. Taylor. 1992. Measuring Service Quality: A Reexamination and Extension.
Journal ofMarketing, 56 (July): 55– 68.
Dabholkar, Dayle I. Thorpe, and Joseph O. Rentz .1996. A Measure of Service Quality for Retail Stores. Journal of the Academy of Marketing Science, 24 (Winter): 3-16.
Dodds, W. B., Monroe, K. B. and Grewal, D. .1991. Effects of price, brand, and store information on buyers’ product evaluation. Journal of Marketing Research. 28: 307-319.
Sloan Management Review. 26 (1): 25–43.
Grewal, D., Monroe, K. B. and Krishnan, R., 1998. The effects of price-comparison advertising on buyers’ perceptions of acquisition value, transaction value and behavioral intentions. Journal of Marketing. 62 (2): 46-59.
Gronroos. 1984. A Service Quality Model and Its Marketing Implications.
European Journal of Marketing. 18 (4): 36-44.
Jiang, J.J., Klein, G. and Crampton, S.M. 2000. A note on SERVQUAL reliability and validity in information system service quality measurement.
Decision Sciences. 31 (3): 725-44. John D. Wells, Joseph S. Valacich, and
Traci J. Hess. 2011.What signal are you sending? How website quality inluences perceptions of product quality and purchase intentions. MIS Quarterly. 35 (2): 373-396.
Kilbourne, W. E., Duffy, J. A., Duffy, M. and Giarchi, G. 2004. The applicability of SERVQUAL in cross-national measurements of health-care quality.
Journal of Services Marketing. 18 (6/7): 524-33.
Kwek. C. L, Tan, H.P, Teck-Chai Lau. 2010. Investigating the Shopping Orientations on Online Purchase Intention in the e-Commerce Environment: A Malaysian Study.
JIBC. 15 (2).
Laroche, N., Kim, C. and Zhou, L. 1996. Brand familiarity and conidence as determinants of purchase intention: An empirical test in a multiple brand context. Journal of Business Research. 37 (10): 115-20.
Long, Y. L. & Ching, Y. L. 2010. The inluence of corporate image,
relationship marketing, and trust on purchase intention: the moderating effects of word-of-mouth. Emerald Group Publishing Limited, 65 (3), 16-34.
Parasuraman, Valarie A. Zeithaml, and Leonard L. Berry. 1985. A Conceptual Model of Service Quality and Its Implications for Future Research.
Journal of Marketing. 49 (October): 41–50.
--- (1988), SERVQUAL: --- Multiple-Item Scale for Measuring Consumer Perceptions of Service Quality.
Journal of Retailing. 64 (1), 12–40.
Perez M. S., Gazquez Abad J. C., Carrillo G. M. and Fernandez R. S. 2007. Effects of service quality dimensions on behavioural purchase intentions: A study in public-sector transport.
Managing Service Quality. 17 (2): 134-151.
Peter N. Golder, Debanjan Mitra, & Christine Moorman. 2012. What Is Quality? An Integrative Framework of Processes and States. Journal of Marketing. 76 (July): 1–23.
Powell, Thomas C. 1995. Total Quality Management as Competitive Advantage: A Review and Empirical Study. Strategic Management Journal. 16 (1): 15–37.
Rao, A. R., Qu, L., and Ruekert, R. W. 1999. Signaling Unobservable Product Quality through a Brand Ally. Journal of Marketing Research
36 (2): 258-268.
Riadh Ladhari. 2009. A review of twenty years of SERVQUAL research.
1994. Service Quality: Insights and Managerial Implications from the Frontier,” in Service Quality: New Directions in Theory and Practice, Roland T. Rust and Richard L. Oliver, eds. Thousand Oaks, CA: Sage Publications, 1-19.
Samin, R., Goodarz, J. D., Muhammad, S. R., Firoozeh, F., Mahsa, H. & Sanaz, E. 2012. A Conceptual Study on the Country of Origin Effect on Consumer Purchase Intention.
Canadian Center of Science and Education. 8 (12): 205 –215.
Schiffman, L.G., Kanuk, L. L. 2007. Consumer Behavior, ninth ed. New Jersey: Prentice-Hall Inc.
Shaharudin M.R., Suhardi, Anita, Maznah and Etty H. 2011. The relationship between product quality and purchase intention: The case of Malaysia’s
national motorcycle/scooter manufacturer. African Journal of
Business Management. 5 (20): 8163-8176.
Taylor, S. A., & Baker, T. L. 1994. An assessment of the relationship between service quality and customer satisfaction in the formation of consumers’ purchase intentions.
Journal of Retailing. 70(2): 163-178. Teng, L., Laroche, M. and Zhu, H. 2007.
The effects of multiple-ads and multiple brands on consumer attitude and purchase behavior. The Journal of Consumer Marketing. 24 (1): 27-36.
Tsiotsou R. 2006. The role of perceived product quality and overall satisfaction on purchase intentions. International Journal of Consumer Studies. 30 (2): 207-217.
Tsui-Yii Shih. 2010. Comparative Analysis of Marketing Strategies for Manufacturers’ and Retailers’ Brands. International Journal of
Electronic Business Management. 8 (1): 56-67.
Van der Wal, R.W .E., Pampallis, A. and Bond, C. 2002. Service quality in a cellular telecommunications company: a South African experience.
Managing Service Quality. 12 (5): 323-35.
Wilkins, H., Merrilees, B. and Herington, C. 2007. Toward an understanding of total service quality in hotels. International Journal of Hospitality Management. (26): 840-53.
Wu, P. C., Yeh, G., & Hsiao, Ch. R. 2011. The effect of store image and service quality on brand image and purchase intention for private label brands.