Jurnal Berkala Ilmiah Efisiensi Volume 17 No. 01 Tahun 2017
ANALYSIS THE INFLUENCE OF PERCEIVED QUALITY,
PERCEIVED PRICE AND PERCEIVED VALUE ON CONSUMER
PURCHASE INTENTION IN TRADITIONAL FABRICS
(CASE STUDY KAENG MANADO)
ANALISA PENGARUH PERSEPSI KUALITAS, PERSEPSI HARGA DAN PERSEPSI
NILAI TERHADAP NIAT BELI KONSUMEN DALAM KAIN TRADISIONAL
(STUDI KASUS KAENG MANADO)
Leonika Kouce Lomboan
International Business Administration Program, Economics and Business Faculty, Sam Ratulangi University, Manado 95115, Indonesia
Email: [email protected]
ABSTRACT
This research aims to analyze the influence of perceived quality, perceived price and perceived value on consumer purchase intention in traditional fabrics called Kaeng Manado. 100 customers of Kaeng Manado were randomly surveyed as respondents. The data were analyze by used multiple linear regression and processing of data usud SPSS statistical program. The results showst perceived quality (X1), perceived price (X2) proved significantly influences on the consumer purchase intention (Y), while
perceived value (X3) has not significant influence on consumer purchase intention (Y). This means that
needs to be improved further details of the motive to be more unique and exclusive and suggested to manufacturers in order to create an official website contains all the information about Kaeng Manado, so that consumers can know more about Kaeng Manado seen from the quality of price and values.
Keywords: Perceived Quality, Perceived Price, Perceived Value, Purchase Intention
ABSTRAK
Tujuan dari penelitian ini adalah untuk mengetahui dan menganalisa pengaruh dari persepsi kualitas, persepsi harga dan persepsi nilai terhadap niat beli konsumen terhadap kain tradisional Kaeng Manado. Sampel dari penelitian ini adalah pelanggan dari Kaeng Manado sebanyak 100 responden yang memenuhi kriteria, yang diperoleh dengan menggunakan simple random sampling. Data tersebut dianalisa dengan menggunakan teknik analisis data regresi linier berganda dan pengolahan data menggunakan program statistik SPSS. Berdasarkan hasil tersebut, hasil penelitian menunjukkan bahwa persepsi kualitas (X1), persepsi harga (X2) terbukti secara signifikan mempengaruhi niat beli konsumen (Y) sedangkan persepsi nilai (X3) berpengaruh tidak signifikan terhadap niat beli konsumen (Y). Ini berarti bahwa perlu ditingkatkan rincian lebih lanjut dari motif menjadi lebih unik dan eksklusif. Di sarankan kepada produsen untuk membuat sebuah website resmi berisi semua informasi tentang Kaeng Manado, sehingga konsumen dapat mengetahui lebih lanjut tentang Kaeng Manado dilihat dari kualitas harga dan nilai.
Jurnal Berkala Ilmiah Efisiensi Volume 17 No. 01 Tahun 2017
1. INTRODUCTION
Research Background
Globalization brings an enormous impact on the people’s lifestyle, especially in terms of
fashion. These aspects are very inherent in human daily life and every nation has a characteristic in creating a fashion trend in the respective country. Therefore, every country has the fashion trend of its own and various perceptions in expressing their sense of fashion, which pretty much explains that fashion indeed has no boundaries.Indonesia is a country in the world that has a wide range of diversity regarding the enormous varieties of cultures, especially traditional fabrics. For instance, the Javanese: batik, the Southern Sumatran: Songket, and the Northern Sumatran: Ulos. Moreover, Manado city in North Celebes also has a traditional fabric called
Kaeng Manado. Kaeng Manado is a fabric that has the correlation with the history of the province of Sitou Timou Tumou Tou. Kaeng Manado has now been expanded to the public, not merely for benefitting certain people, but rather on how to promote the culture of North Sulawesi in general and the city of Manado in particular. It is done by completing all the equipment, as well as the basic needs and requirements, and developing (training) the human resources on how to promote or to even create Kaeng Manado. To enhance the marketing techniques of Kaeng Manado so that it will run well, the craftspeople or producers of the fabric
must acknowledge the consumers’ pattern of behavior as a way to fulfill marketing targets. The consumers’ behavior contributes in obtaining good information towards the right marketing decisions for the selling of Kaeng Manado, in which its existence must be well-preserved as it is one of the wonders in Manado. Kaeng Manado is no longer prepared to be used on formal occasions. Clothing made of batik has been popularized in daily activities, so it will not appear too formal. So as to provide a great advantage for the micro-economic sector, the biggest advantage of the increasing interest of the community to wear batik is actually obtained by the distributor not craftsmen. Has been a challenge for the craftsmen to continue develop creations that are relevant to the changing times, but still base on traditional motifs and will not lost in an increasingly modern market competition.
Research Objective
Based on the research problem above, research objective is concluding as follows: To find out the significant analysis the influence of perceived quality, perceived price and perceived value on consumer purchase intention in traditional fabrics (case study Kaeng Manado).
2. LITERATURE REVIEW
Marketing
Kotler (2006) marketing is a societal process by individuals and groups Obtain what they need and want through creating, offering, and freely exchanging products and services of value with others. Stanton, Etzel and Walker (2004) Marketing is a total system of business activities signed to plan, price, promote, and distribute, want-satisfying products to the target markets in order to achieve organizational objectives.
Consumer Lifestyle
Jurnal Berkala Ilmiah Efisiensi Volume 17 No. 01 Tahun 2017
it appears to be a more relevant tool for market analysis than social class, as well as avoiding the debate that surrounds the operationalization and measurement of that concept. Lifestyle deals with the choices people make and the outputs of individuals. This is opposed to class which, while commonly measured on the basis of occupation, deals with some of the inputs to economic and social power.
Consumer Behavior
Consumer behavior has been always of great interest to marketers. The knowledge of consumer behavior helps the marketer to understand how consumers think, feel and select from alternatives like products, brands and the like and how the consumers are influenced by their environment, the reference groups, family, and salespersons and so on. A consumer's buying behavior is influenced by cultural, social, personal and psychological factors. Most of these factors are uncontrollable and beyond the hands of marketers but they have to be considered while trying to understand the complex behavior of the consumers.
Consumer Purchase Intention
Mowen and Minor (2001) maintain that consumer decision making are a series of processing results from perceiving problems, searching for solutions, evaluating alternatives, and making decisions. Unplanned buying means that consumers make all decisions to buy a product category and a brand in a store. It can be regarded as an impulse buying behavior. Partially planned buying means that consumers only decide a product category and the specification before buying a product, and brands and types will decide in the shop later. Kotler (2003) proposes that individual attitudes and unpredictable situations will influence purchase intention.
Perceived Quality
Kan (2002) points out that objective quality is that consumers will use their experience and knowledge to evaluate overall product benefit, function, durability, technology and reliability when consumers purchase a product. Though consumers have enough information, they may be insufficient in time and motivation to do a further judgment, and in the end they can only select little important information and make an evaluation on quality (Wan, 2006). In sum, perceived quality is a consumer subjective judgment on product quality, and he or she will evaluate product quality from their previous experiences and feelings.
Perceived Value
Perceived value is a multidimensional concept and has a dynamic structure. In the light of this information, perceived value can be summarized as the value of a product that is determined by
customer’s opinion about its value. A recent empirical study found that the quality of web site is
positively associated with customers’ perceived value (Bauer, et al., 2006; Parasuraman etc.,
2005; Wolfinbarger and Gilly, 2003). Marimon et al. (2009) find that, of the four, two dimensions, system availability and fulfilment, significantly and positively affect customer’s perceived quality. Blasco et al. (2010) identify five dimensions of e-service quality, such as efficiency system availability and fulfillment, security and responsiveness; they further reveal that all five dimensions, except fulfilment, positively influence customer’s perceived value. As we agreed with previous researches, our study focused e-service quality.
Perceived Price
Jurnal Berkala Ilmiah Efisiensi Volume 17 No. 01 Tahun 2017
suggesting that the perceived sacrifice component became stronger in relation to perceived quality at higher prices. In conceptual argument, as price increases from a low priced model to a
higher priced model, buyers' perceptions of value will increase and then decrease. Consumers’
value perceptions are enhanced with increasing levels of quality they perceive and lowered with increasing levels of sacrifice they feel. Oh (2000) stated that when consumers perceive high levels of value from a pending purchase, they tend to express high levels of willingness to buy eventually and low levels of willingness to look for alternative purchases.
Previous Researches
Lawson. R, Todd. S, (2002), said a link between lifestyles and social class has long been acknowledged, marketers have more closely identified lifestyles with psychographics and therefore with psychological segmentation. Their proposed that the origins of lifestyle are more
correctly reflected in Weber’s approach to status and that it can be viewed more appropriately as
the most relevant form of social stratification for a contemporary society. Evidence from an ongoing national study of consumer lifestyles is used to demonstrate how consumer lifestyle segmentation can be used to reflect structural inequalities within society.
Vantamay, S. (2008). This article gives a review of the comprehensive concept of perceived product quality: definitions, impacts, factors affecting perceived product quality determinants and consequences of perceived product quality, its dimensions. In this article, perceived product
quality is defined as the consumer’s perception of overall components of the product -- both the tangible and intangible characteristics. It is so different from actual quality that it can powerfully affect the profit margins, brand power and market share, brand equity, perceived value, returns on investment (ROI) and profitability. Factors affecting perceived product quality have two cues the intrinsic cues and the extrinsic cues. The perceived product quality also has various dimensions such as performance, features, conformance, reliability, durability,
serviceability, and “fit and finish”.
Chi, H.K, et al. (2009). Recently, the rising of consumer consciousness has made consumers choose to purchase their familiar and favorable brand. Therefore, if businesses want to defeat their competitors, they have to make consumers love to buy their products and brands. Macdonald and Sharp (2000) mention that even though consumers familiarize and are willing to purchase a product, brand awareness is still an important factor to influence purchase decision. When consumers want to buy a product, and a brand name can come to their minds at once, it reflects that product has higher brand awareness.
Zehira, C. et al (2014) is about E-S-Quality Perceived Value and Loyalty Intentions Relationships in Internet Retailers In order to be competitive in a changing market, companies
must improve their quality and innovativeness (Zehir and Sadikoğlu, 2012). Combined with the
developments related to internet, emerging internet retailing has started to change shopping habits of individuals. Following these developments, academicians have started to study the concepts of electronic retail services and their quality. The purpose of this study is to identify the mediating effect of Perceived Value on the relationship between Eservices Quality, and the Loyalty Intentions considering the customers of 10 most popular Internet stores in Turkey. This study revealed the causes of changes in the Perceived Value considering the effects of E-Services Quality and Loyalty Intention.
Jaafar, S.N, et al. Consumers’ Perceptions, Attitudes and Purchase Intention towards Private Label Food Products in Malaysia. This research focused on factors that may influence
consumers’ intention to purchase private label food product in a state in Malaysia. Factors
examined are extrinsic factors which include ‘perceived price’, ‘packaging’, ‘advertisement’
Jurnal Berkala Ilmiah Efisiensi Volume 17 No. 01 Tahun 2017
value’) and consumers’ attitudes (in terms of trust, familiarity and perceived economic
situation). Result shows that ‘perceived value’ becomes prominent in consumers’ purchasing of private label brand food product, followed by other factors. Almost all independent variables are associated with purchase intention towards private label brand food products. The most
significant factor that influencing consumers’ purchase intention towards private label food products are ‘consumers’ attitude’ and ‘perceived price’. Consumers’ past purchasing
experience with the private label food products may also influence their perception towards price, packaging, store image and trust of those products.
3. RESEARCH METHOD
Types of Research
This research usecausal type of research analysis the influence of perceived quality, perceived price and perceived value on consumer purchase intention in traditional fabrics.
Place and Time of Research
This research is conducted in Manado from September - October 2016.
Conceptual Framework
The figures below show the correlation between perceived quality, perceived price and perceived value on consumer purchase intention in conceptual framework.
Picture 1. Research Procedure Source: Data Processed, 2016
Population and Sample
Sugiyono (2011), the population can be defined as a generalization region consisting of the object or subject that have a certain quantity and characteristics defined by researchers to learn and then drawn conclusions. Population in this research will be the consumer of Kaeng Manado in Manado. A sample is a subset of a population selected to participate in the study, it is a fraction of the whole, selected to participate in the research project (Polit and Hungler, 1999).The sample of this research is using a simple random sampling. Simple random sampling is the basic sampling technique where we select a group of subjects (a sample) for study from a larger group (a population). The sample of this research is 100 respondents who have bought and wearing Kaeng Manado.
H1
H3 H2
H4
Perceived Price (X2) Perceived Quality
(X1)
Perceived Value (X3)
Jurnal Berkala Ilmiah Efisiensi Volume 17 No. 01 Tahun 2017
Data Collection Method Primary Data
Primary data refer to information obtained first-hand by the researcher on the variables of interest for the specific purpose of the study (Sekaran, 2009). Primary data is originated by the researcher specifically to address the research problem. This primary data generated by distributing the questionnaire with the relevant person in charge that becomes the point of interest for the research. In order to generate more accurate data, in this research the questionnaire distributed to the consumer of Kaeng Manado.
Secondary Data
The secondary data refers to information gathered by someone other than researcher conducting the current study (Sekaran, 2009). Secondary data in this research is gathered from some related books, journals, and literatures from the library. Secondary data use to support the research in order to develop the fundamental analysis and adding information regarding to the research. .
Data Analysis Method Validity Test
Sekaran (2009) assumes that validity is a test of how well an instrument that is developed measures the particular concept it is intended to measure. A content validity test checks that there are enough relevant questions covering all aspects being studied and that irrelevant questions are no asked (Parahoo, 2006).
Reliability Test
Reliability is a test of how consistently a measurement instrument measures whatever concept it
is measuring (Sekaran, 2009). Cronbach’s alpha is a reliability coefficient that indicates how well the items in a set are positively correlated to one another. The questionnaire is reliable if
the value of Cronbach’s Alpha more than 0.6.
Testing of classical Assumption
Assumption of classical test statistics are requirements that must be met in multiple linear regression analysis based on ordinary least squares (OLS).
Heteroscedasticity
Heteroscedasticity refers to the condition that occurs when the error variance produced by a regression model are not constant (Blank 2007). When the phenomenon is present, the least square is not the most efficient procedure for estimating the coefficients of the regression model.
Multicolinearity
Jurnal Berkala Ilmiah Efisiensi Volume 17 No. 01 Tahun 2017
Normality
In multiple linear regression models, the residual is assumed to be normally distributed. A residual is the difference between the observed and the model predicted values of the dependent variable. The residual for a given product is the observed value of the error term or that product.
Multiple Regression Analysis model
Multiple regression analysis is the process of calculating a coefficient of multiple determination and regression equation using two or more independent variables and one dependent variable. For data collected from a sample, there is also a need to calculate the probability of the regression coefficient having occurred by chance alone (Sekaran, 2009).The equation model of multiple regression analysis use in this research can be formulated as shown below:
Y = α + β 1X1 + β 2X2 + β 3X3 + e
Where:
Y : Consumer Purchase Intention (Dependent Variable)
ɑ : The Constant, when all the independent variable equal to 0
β1, β2, β3 : The regression coefficient of each variable X1 : Perceived Quality (Independent Variable) X2 : Perceived Price (Independent Variable)
X3 : Perceived Value (Independent Variable); е : error
Hypothesis Testing
In order to test the hypothesis a statistical analysis such as Ftest and Ttest need to be calculated. The Ftest and Ttest will be useful in a situation when the researchers need to find out the relationship between dependent and independent variables. When the Ftest and Ttest are given and compared to the Ftable and Ttable, the Hypothesis could be examined.
Ftest
An F-Test is the statistical test intended to determine whether the independent variables simultaneously influence the dependent variable (Malhotra 2007).
Ttest
A T-Test is the statistical test intended to determine whether the independent variables partially influence the dependent variable or not.
4. RESULTS AND DISCUSSION
Validity Test
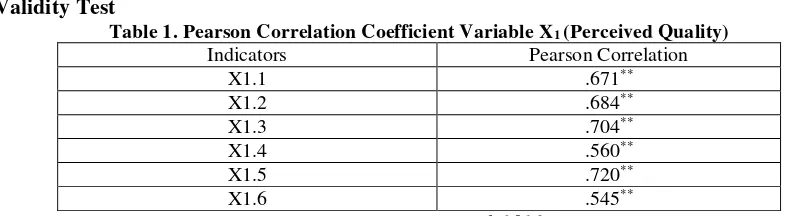
Table 1. Pearson Correlation Coefficient Variable X1 (Perceived Quality)
Indicators Pearson Correlation
X1.1 .671**
X1.2 .684**
X1.3 .704**
X1.4 .560**
X1.5 .720**
X1.6 .545**
Jurnal Berkala Ilmiah Efisiensi Volume 17 No. 01 Tahun 2017
The table shows all the total values for each indicator for perceived quality (X1) are above 0.3. It means all the indicators are valid.
Table 2. Pearson Correlation Coefficient Variable X2 (Perceived Price)
Indicators Pearson Correlation
X2.1 .578**
X2.2 .645**
X2.3 .636**
X2.4 .611**
X2.5 .665**
X2.6 .658**
Source: Data Processed, 2016
The table shows all the total values for each indicator for perceived price (X2) are above 0.3. It means all the indicators are valid.
Table 3. Pearson Correlation Coefficient Variable X3 (Perceived Value)
Indicators Pearson Correlation
X3.1 .736**
X3.2 .478**
X3.3 .515**
X3.4 .532**
X3.5 .670**
X3.6 .512**
Source: Data Processed, 2016
The table shows all the total values for each indicator for perceived value (X3) are above 0.3. It means all the indicators are valid.
Table 4. Pearson Correlation Coefficient Variable Y (Consumer Purchase Intention)
Indicators Pearson Correlation
Y.1 .742**
Y.2 .674**
Y.3 .678**
Y.4 .713**
Y.5 .679**
Y.6 .773**
Source: Data Processed, 2016
The table shows all the total values for each indicator for consumer purchase intention (Y) are above 0.3. It means all the indicators are valid.
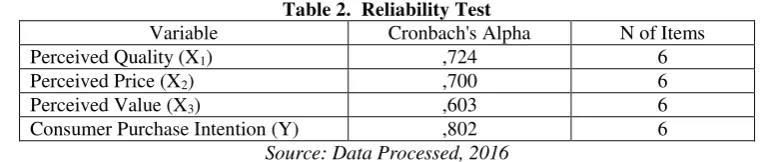
Reliability Test
Table 2. Reliability Test
Variable Cronbach's Alpha N of Items Perceived Quality (X1) ,724 6
Perceived Price (X2) ,700 6
Perceived Value (X3) ,603 6
Consumer Purchase Intention (Y) ,802 6
Source: Data Processed, 2016
Jurnal Berkala Ilmiah Efisiensi Volume 17 No. 01 Tahun 2017
Multiple Linear Regression Analysis
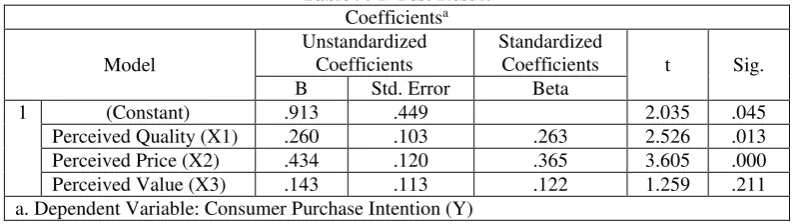
Table 5. The Multiple Linear Regression Analysis Output Coefficientsa
Model
Unstandardized Coefficients
Standardized
Coefficients t Sig. B Std. Error Beta
1 (Constant) .913 .449 2.035 .045 Perceived Quality (X1) .260 .103 .263 2.526 .013
Perceived Price (X2) .434 .120 .365 3.605 .000
Perceived Value (X3) .143 .113 .122 1.259 .211
a. Dependent Variable: consumer purchase intention (Y)
Source: Data Processed, 2016
Recall that the Multiple Linear Regression model is used to determine the effect of independent variables on a dependent variable. The calculation is conducted by using the SPSS software. The computerized calculation ensures the accuracy of the analysis. From the result in table 5, the multiple linear regressions can be:
Y = 0.913 + 0.260X1 + 0.434X2 + 0.143X3 + e
Where: Y = Costumer Purchase Intention (Dependent Variable) X1 = Perceived Quality (independent variable)
X2 = Perceived Price (independent variable)
X3 = Perceived Value (independent variable) e = Error
Multiple regression coefficient of correlation (R)
Table 6. Coefficient of correlation and determination
Model Summaryb
Model R R Square Adjusted R Square Std. Error of the Estimate 1 .641a .411 .393 .34950
a. Predictors: (Constant), perceived value (X3), perceived price (X2), perceived quality (X1)
b. Dependent Variable: consumer purchase intention (Y)
Source: Data Processed, 2016
The value of coefficient correlation (R) that is shown in table 6 means that there is significant relationship between the three independent variables and dependent variable. It is because the value of R is 0.641 which proves that the relationship among variable independents and dependent is strong.
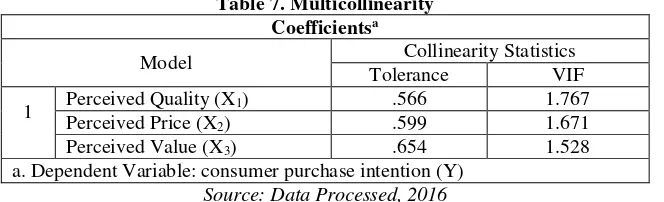
Multicollinearity
Multicollinearity is the intercorrelation of independent variables. This test determines the Tolerance and VIF Value.
Table 7. Multicollinearity Coefficientsa
Model Collinearity Statistics Tolerance VIF
1 Perceived Quality (X1) .566 1.767 Perceived Price (X2) .599 1.671
Perceived Value (X3) .654 1.528
a. Dependent Variable: consumer purchase intention (Y)
Jurnal Berkala Ilmiah Efisiensi Volume 17 No. 01 Tahun 2017
Table 7 shows that the Tolerance of perceived quality is 0.566; perceived price 0.599; perceived value are 0.654, meaning the tolerance value of each variable is more than 0.2. The VIF value of perceived quality is 1.767, perceived price is 1.671, perceived value is 1.528, meaning the VIF value of each variable is less than 10. Since all the tolerance values are more than 0.2 and VIF value of each independent variable is less than 10, this research is free from multicollinearity.
F-Test Result
Table 8. F-Test Result
ANOVAa
Model Sum of Squares df Mean Square F Sig.
1
Regression 8.188 3 2.729 22.343 .000b
Residual 11.726 96 .122 Total 19.914 99
a. Dependent Variable: consumer purchase intention (Y)
b. Predictors: (Constant), perceived value (X3), perceived price (X2), perceived quality (X1) Source: Data Processed, 2016
With the level of significant of 0.05 and degree of f reedom (df) of 3; 100, the Ftablefrom F distribution table is F3; 100; 0.05 = 2.70, while Fcountfrom Table 4.9 is 22.343 then the result isFcount>Ftable : 7.021 > 2.70. Since the Fcount is greater than Ftable, H0is rejected and H1 is accepted. It means that the independent variables significantly affect the dependent variables simultaneously.
T-Test
T-Test is the statistical test intended to determine the partial effect of each independent variable (X) to dependent variable (Y). If Tcount>Ttable as confidence level of 95% (α=0.05), (H1) is accepted and (H0) is rejected.It means that the independent variable has a significant effect on the dependent variable. IfTcount<Ttableas confidence level of 95% (α=0.05), (H1) is rejected and (H0) is accepted. It means that the independent variable does not have a significant effect on the dependent variable.
Table 9. T-Test Result
Coefficientsa
Model
Unstandardized Coefficients
Standardized
Coefficients t Sig. B Std. Error Beta
1 (Constant) .913 .449 2.035 .045 Perceived Quality (X1) .260 .103 .263 2.526 .013 Perceived Price (X2) .434 .120 .365 3.605 .000 Perceived Value (X3) .143 .113 .122 1.259 .211 a. Dependent Variable: Consumer Purchase Intention (Y)
Source: Data Processed, 2016
Discussion
Jurnal Berkala Ilmiah Efisiensi Volume 17 No. 01 Tahun 2017
Perceived Quality (X1) on Consumer Purchase Intention (Y)
Researcher found that the perceived quality is one variable influences on consumer purchase intention. It is obtained from the results of statistical regression test with Ttable of 2.526 with value significance of 0.013 less than 0.05 (0.013<0.05), and the coefficients regression has a positive value of 0.260; the first hypothesis in this study proved that perceived quality (X1) influential positively to consumer purchase intention (Y) of Kaeng Manado. Perceived quality becomes one of determining whether consumers will buy a product. In choosing a product quality will be taken into consideration when the consumer will decide choice whether it is appropriate and meets what consumers need or not, so today has been a lot of businesses are started develop products with better quality than with other similar products to create perceived quality Good customer to the product. The results of this research prove a previous study conducted by Yaseen et al., (2011) in which the perception of quality has the greatest influence of all the variables research. This is in accordance with the opinion of Aaker (1996) in Setiawan (2010) which says that the perceived quality in the eyes of consumers will increasing purchase intention because it provides a strong rationale minds of the consumer to choose the brand. Perceived quality is construed as the belief in the overall "goodness" of what all is received i.e. product or service. Simamora (2003) States that perceived quality is the consumer perception of the quality or the benefits of a product or service in terms of their functions relative to other products.
Perceived Price (X2) on Consumer Purchase Intention (Y)
Based Statistical test results, showed perceived price as the dominant influence compare with the other variables that influence consumer purchase intention. It is obtained from the results of statistical regression test with Ttable of 3.605 with value significance of 0.000 less than 0.05 (0.000<0.05), and the coefficients regression has a positive value of 0.220; the first hypothesis in this study proved that perceived price (X2) influential positively to Consumer purchase intention (Y) of Kaeng Manado. Particularly in North Sulawesi there are various kinds of batik cloth were seeded in each district / city, but this does not affect the consumer in buying Kaeng Manado for a given quality commensurate with the price released by the consumer.
Perceived Value (X3) on Consumer Purchase Intention (Y)
Researcher found that the perceived value do not have any influence on consumer purchase intentions. It is obtained from the results of statistical regression test with Ttable of 1.259 with value significance of 0.211 greater than 0.05 (0.211>0.05), and the coefficients regression has a positive value of 0.143; Some studies have produced conflicting results, suggesting a negative effect of high price on perceived value.
CONCLUSIONS
The researcher found that two the independent variables (perceived quality and perceived price) in this research influence consumer purchase intention significantly and one independent variable does not significantly influence consumer purchase intention, which is Perceived Value. The researcher finally arrived at some conclusion in this research:
1. Perceived quality, perceived price, perceived value are significant influences on consumer purchase intention of Kaeng Manado, simultaneously.
Jurnal Berkala Ilmiah Efisiensi Volume 17 No. 01 Tahun 2017
Recommendation
1. Making batik "Kaeng Manado" according to its primary purpose, namely to preserve local culture, especially in the Manado city. Therefore needs to be improved further details of the motive to be more unique and exclusive. Dealing with limited information about Kaeng Manado, suggested to manufacturers in order to create an official website contains all the information about Kaeng Manado so that consumers can know more about Kaeng Manado seen from the quality of price and values that will influence of consumer purchase intention.
2. Students must be examined again about the things that affect Purchase Intention because value of the coefficient of determination (R2) is 0.411 which means that 41% of factor contribution on consumer purchase intention comes from these three variables and have rest 59% is explained by other factors that not discussed in this research, these three proponents must be a good reference in order to realize that purpose.
REFERENCES
Papers on Journals
[1] Al-Tarawneh, H.A. 2012.The Main Factors beyond Decision Making. Journal of Management Research Vol. 4, No. 1: E18
[2] Brucks, Merrie, Valerie A. Zeithaml and Gilian Naylor. 2002. “Price and Brand Name as
Indicators of Quality Dimensions for Consumer Durables,” Journal of Academy of Marketing Science, 28(3), 359-374.
[3] Bouhlel et al., 2011. “Brand Personality’s Influence on the Purchase Intention: A Mobile
Marketing Case”. International Journal of Business and Management.Vol.6, No. 9.P210-227.
[4] Chi et al., 2009. “The Influences of Perceived Value on Consumer Purchase Intention: The
Moderating Effect of Advertising Endorser”.
[5] Ching, W.C. and P.L. Hsi, 2007. “Factors influencing online music purchase intention in Taiwan: An empirical study based on the value-intention framework”. Inter. Res., 17: 139-155. DOI: 10.1108/10662240710737004
[6] Choy, J. Y., Ng, C. S. 2011. “Consumers’ Perceived Quality, Perceived Value and Perceived
Risk Towards Purchase Decision on Automobile”. American Journal of Economics and
Business Administration 3 (1): 47-57, 2011 ISSN 1945-5488
[7] Eggert, A. and W. Ulaga, 2002.“Customer perceived value: A substitute for satisfaction in
business markets. J. Bus. Ind. Market., 17: 107-118. DOI: 10.1108/08858620210419754
[8] Garretson, J. A., and Clow, K. E. 1999.“The influence of coupon face value on service
quality expectation, risk perceptions and purchase intentions in the dental industry”. The Journal of Service Marketing, 13(1), 59-70.
[9] Hsin, K.C., Huery, R.Y., Ya, T.Y. 2009. “The Impact of Brand Awareness on Consumer Purchase Intention: The Mediating Effect of Perceived Quality and Brand Loyalty”. The Journal of International Management Studies, Volume 4.
[10] Jaafar, S.N., Lalp, P.E., Mohaini M. “Consumers’ Perceptions, Attitudes and Purchase
Intention towards Private Label Food Products in Malaysia”.Asian Journal of Business
and Management Sciences Vol. 2 No. 8 [73-90]
[11] Jemaa, B.M.A., Tournois Nadine. 2014. “Relationship Marketing Key Concepts as
Relationship Value Determinant”. Journal of Marketing Research and Case Studies. Vol. 2014(2014) Article ID 201710, 17 pages.
[12] Okiro, K., Ndungu, J. 2013. “The Impact of mobile and internet banking on performance of
Jurnal Berkala Ilmiah Efisiensi Volume 17 No. 01 Tahun 2017
[13] Sa'nchez et al. 2007. “The Concept of Perceived Value: A Systematic Review of The
Research”.
[14] Rob Lawson and Sarah Todd (2002), “Consumer lifestyles: a social stratification perspective”, Marketing Theory Arthicles, Volume 2(3): 295–307 Copyright © 2002 SAGE (London, Thousand Oaks, CA and New Delhi)
[15] Yee et al.,. 2011. “Consumer’s Perceived Quality, Perceived Value, and Perceived Risk Towards Purchase Decision on Auto monile”. American Journal of Economics and
Business Administration 3 (1). \P47-57.
Books
[16] Armstrong, G. and P. Kotler. 2003. Marketing: An Introduction. 6th Edn., Pearson Prentice Hall, New Jersey, ISBN: 0-13-035133-4, pp: 714
[17] Burns, A.C. and R.F. Bush, 2003.Marketing Research: Online Research Application. 4th Edn., Prentice Hall, New Jersey, ISBN: 0-13-035135-0, pp: 672.
[18] Ferdinand, Augusty, 2005, “Structural Equation Modeling dalam Penelitian Manajemen”, Penerbit: Badan Penerbit Universitas Diponegoro, Semarang
[19] Kotler, Philip. 2002. “The Marketing Management”, 11th edition, Prentice Hall International, Inc.
[20] Kotler, Philip and Kevin Lane Keller. 2006. Marketing Management, Pearson Education Inc.
[21] Kotler, Philip and Kevin Lene Keller. 2012. “Principle of Marketing”, Global Edition, 14th Edition. USA: Pearson Education Limited.
[22] Lawson, R., and Todd, S. 2002. “Consumer lifestyles: a social stratification”. Volume 2(3): 295–307.
[23] Sweet, S.A. and Martin, K.G. 2008. “Data analysis with SPSS”. 3rd ed. US: America. p. 106, 123-125, 134-139,147-156
[24] Sekaran. 2009. Research Methods for Business, A Skill Building Approach, 2nd ed. New York, John Wiley and sons.
[25] Sugiyono. 2009. “Statistika Untuk Penelitian”. Bandung: Alfa Beta.
[26] Vantamay, S. 2008. “Understanding of Perceived Product Quality: Reviews and
Recommendations”
[27] Widodo. 2009. “Metode Penelitian Kuantitatif”. Surakarta: LPP UNS dan UPT PenerbitandanPercetakan UNS.