1
SOIL WATER RETENTION CURVE DETERMINATION of ARTIFICIAL SOIL USING TENSIOMETER
Dwi Sarah*
Dwi Sarah, Soil Water Retention Curve Determination of Artificial Soil Using Tensiometer, RISET – Geologi dan Pertambangan Jilid 16 No 2. Tahun 2006, p. 12 Figures 5, Table 3.
Abstract: Soil water retention curve possesses a significant importance in unsaturated soils engineering. The emergence of high capacity tensiometer has provided an alternative technique for the determination of the soil water retention curve. In this study soil water retention curve was obtained by stage drying technique. Possible factors affecting the accuracy of this technique were discussed.
1. INTRODUCTION
Soil water retention curve possesses a significant importance in unsaturated soils engineering. As the experimental works related to unsaturated soil properties are often complicated, soil water retention curve serves a valuable tool in determining the engineering properties of unsaturated soil (Fredlund and Rahardjo, 1993). Properties of unsaturated soil such as the permeability, shear strength and volume change can be obtained from the soil water retention curve in conjunction with its saturated properties (i.e. Brooks and Corey, 1964; van Genutchen, 1980; Fredlund et al, 1994; Vanapalli et al., 1996; Fredlund et al., 1996, etc).
Soil water retention curve is generally defined as a relationship between the quantities of water retained in the soil pores and the soil suction. The amount of water contained can be expressed in terms of degree of saturation (Sr), gravimetric water content (w), volumetric water content (θw) or void ratio with respect to water (ew). Soil water retention curve can follow either
drying and or wetting path. Drying path of the curve depicts the desaturation of an initially saturated soil while the saturation of an initially dry soil is termed the wetting path.
Soil water retention curves are commonly determined by axis translation techniques, relative humidity techniques, filter paper
techniques, etc. As the recent technology of high capacity tensiometer emerges, this device has been used as an alternative method for soil water retention curve determination (Cunningham, 2000; Boso et al., 2003; Toker, 2004). The high capacity tensiometers provide of fast measurements and direct measurement of the water tensile strength. This paper presents the experimental determination of soil water retention curves on artificial soil using the high capacity tensiometer developed by Wykeham Farrance Limited and the University of Durham.
2. EXPERIMENTAL PROGRAM 2.1 Artificial soil specimen preparation
Artificial soils used in this study were prepared by consolidating a slurry mixture comprising of 70% sand- 20% bentonite - 10% kaolin by weight of 125% water content in the Rowe cell. The summary of the material properties of the mixture are provided in Table 1.
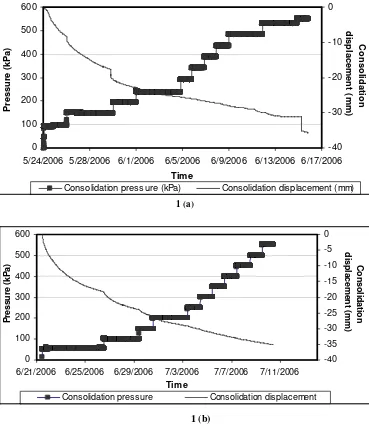
The slurry mixture was left overnight to allow for moisture equalisation prior to consolidation in the Rowe cell. Increments of vertical pressure of 50 kPa were applied to the mixture up to 550 kPa in order to achieve the required height of 30 mm in accordance with the procedures set by the Mechanics of Unsaturated Soil for Engineering (MUSE) benchmarking task group. Consolidation pressure and displacement were monitored by Triax (Toll, 1999) as shown in Figure1a and 1b.
*Pusat Penelitian Geoteknologi - LIPI Email: [email protected],
[email protected] *Keyword: soil wate,r retention curve, tensiometer, stage drying
2
Table.1 Material properties of the soil mixture
Material Sand
(%)
5/24/2006 5/28/2006 6/1/2006 6/5/2006 6/9/2006 6/13/2006 6/17/2006
Tim e
Consolidation pressure (kPa) Consolidation displacement (mm)
1 (a)
6/21/2006 6/25/2006 6/29/2006 7/3/2006 7/7/2006 7/11/2006
Tim e
Consolidation pressure Consolidation displacement
Figure 1. a Consolidation displacement and consolidation pressure against time for sample set 1 and b. sample set 2
1 (b)
3 Consolidation process was performed twice and four samples were recovered from each consolidation batch. One sample from each consolidation batch was going for tensiometer test while the rest were going for pressure plate tests. Recovered samples were trimmed to form soil cakes of 100 mm diameter. The permeability of the recovered samples was back calculated from the consolidation process. Table 2 presents the properties of the artificial soil samples.
2.2 WF-DU Tensiometer
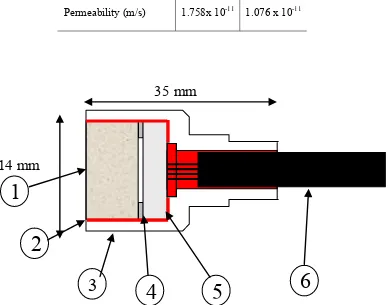
Series of suction measurements were carried out using the high capacity tensiometer referred to as the Wykeham Farrance- Durham University (WF-DU) tensiometer. The WF- DU tensiometer is a miniature suction probe having an approximately cylindrical shape with a diameter of 14 mm and a length of 35 mm. The schematic drawing of the tensiometer is presented in Figure 2.
Table 2. Material properties of the artificial soil samples
Properties Sample 1 Sample 2 Bulk density, ρ (g/cm3) 1.90 1.80 Dry density, ρd (g/cm3) 1.27 1.31
Permeability (m/s) 1.758x 10⁻¹¹ 1.076 x 10⁻¹¹
1
2
3
4
5
6
35 mm
14 mm
4 Parts of the WF-DU tensiometer comprise of:
1. High air entry stone 15 bar,10 mm diameter, 10mm thick
2. Glue line
3. Stainless Steel Housing 14mm diameter x 35mm long
4. Shim to allow flexing of the diaphragm 5. Ceramic pressure transducer 10 bar full
scale output approx 18mV at 10V 6. Four core screened cable
The tensiometer is connected to a PC through Triax data acquisition program (Toll, 1999). Prior to its application, the WF-DU
tensiometer must be calibrated and saturated. Calibrations of tensiometers were conducted by
calibrating the tensiometers in the positive pressure range using a standard pressure transducer, which had previously been calibrated against increasing dead weights. The calibration curves established in the positive range were subsequently extrapolated to the negative range of pressures. The complete explanation and validation of the calibration method can be seen in Lourenço et al. (2006).
2.3 Tensiometer saturation
Prior to its use, the tensiometer must be adequately saturated. Inadequate saturation would lead to cavitation at low values of suction
5 Saturation procedure is conducted according to the method adopted by Lourenço et al. (2006). Saturation vessel which is connected to a vacuum pump, data logger and source of deaired water was applied in tensiometer saturation (see Figure 3). Two saturation methods were employed in this experiment, infiltration under vacuum and pre pressurisation. Infiltration under vacuum was applied at the first saturation of the tensiometer prior to its use. The tensiometer was first saturated from initially dry condition by means of water infiltration under vacuum. Subsequently a positive water pressure was applied to the filter in order to force any residual amount of air into solution.
When cavitation occurs during soil measurement testing the tensiometer head was immediately plunged into free water to avoid further desaturation. The tensiometer was then re-saturated by pre pressurisation. Throughout pre pressurisation stage, a constant water pressure equal to 1500 kPa was applied for at least 24 hours. Then the tensiometer was checked to find out whether the tensiometer had been well saturated. The tensiometer was wiped dry and allowed to evaporate directly to the atmosphere. Quick response of negative pressure reading was expected and once the pressure reading was showing a highly negative pressure, the tensiometer head was immediately sunk into free water in order to prevent further desaturation. The tensiometer should immediately read zero pressure or a low value of positive pressure up to 5 kPa is generally accepted. If cavitation occurs during the saturation checking process, the tensiometer is put back at the saturation vessel for another pre pressurisation stage.
2.4. Test Procedures
Stage drying was employed in this experiment by which the soil water retention curve is determined through series of independent drying phases and suction measurements on the same sample. The detailed procedure was as the following. The consolidated soil cakes were wrapped in four layers of cling film and sealed using a tape to prevent moisture loss during measurement. A small hole at the size of the tensiometer cylinder
was made in the plastic wraps right at the centre of the cake so as to allow for the tensiometer insertion. Prior to measurement, the tensiometer head was firstly submerged in free water and its reading checked. If equalisation is observed in the pressure readings within few minutes, the tensiometer is ready for measurement. The pressure reading was then reset and a saturated soil paste made of the same soil as the sample was welded into the tensiometer. The tensiometer was gently pushed into the soil cake and a good contact with the soil ensured. Silica gel grease was generously applied around the sides of the tensiometer in order to prevent evaporation from the tiny gap around the tensiometer and the plastic wrap hole. After negative pore water pressure readings had equalised, the tensiometer sides were wiped to clean the grease. The tensiometer was subsequently taken out of the soil and immediately immersed in free water. Drying was achieved by removing the plastic cover and exposing the soil sample to the atmosphere for a certain period of time. A fan was placed above the sample to accelerate drying. The new mass of the soil specimen was measured and rewrapped, ready for the next suction measurement.
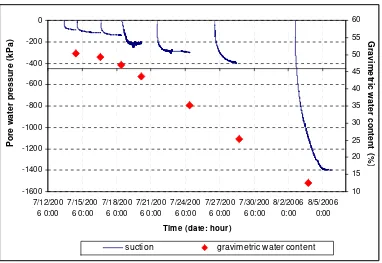
These procedures were carried out several times in order to obtain several data points as the water content is decreasing. At the end of the test, the soil cakes were oven dried and the moisture content for each point of suction measurement was back calculated. Suction measurement set up is shown in Figure 4.
3. RESULT and DISCUSSION 3.1 Test Results
6
Cable
WF-DU Tensiometer
Logger
Sample
Figure 4. Measurement of suction using WF-DU tensiometer
-1600
Tim e (date: hour)
P
suction gravimetric water content
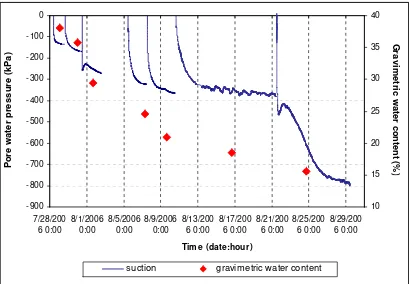
7 As expected, soil suction equalises at increasing values as the gravimetric water content decreases. The summary of tensiometer test result is presented in Table 3.
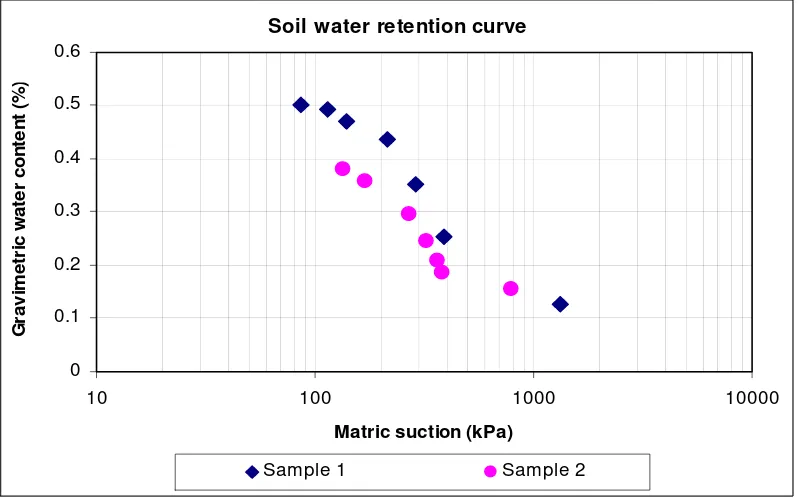
Soil water retention curves obtained for sample 1 and sample 2 are shown in Figure 7.
Soil water retention curve of sample 2 is seen to be below that of sample 1. The air entry value of
sample 1 is about 150 kPa while for sample 2 is about 200 kPa. Higher porosity of sample 1 results in lower air entry value than that of sample 2. Inconsistent pressure increments applied over time during consolidation might also affect the dissimilar curves obtained. -900
Tim e (date:hour)
P
suction gravimetric water content
Figure 6. Suction measurement sequence for sample 2
Table 3. Summary of tensiometer test results
Sample no
Porosity with respect to water
nw (%)
Initial water content,
wi (%)
Final water content
wf [%]
Mass of water evaporated
8 3.2 Discussion of tensiometer tests
Suction measurement using the tensiometer is relatively simple and fast. The tensiometer method is also more realistic, as the soil sample is subjected to the ambient pressure rather than raised air pressure. Studies by Cunningham et al (2000), Boso et al (2003) and Toker et al. (2004) pointed that high capacity tensiometers can be employed to establish soil water retention curves following the drying path. The technique adopted by Cunningham et al (2000) and Toker et al. (2004) involved a continuous drying of soil sample by recording of water content decrease at the same time with its corresponding suction increase as the soil is exposed to the atmosphere on top of an electronic balance. Whilst in this study, water content decrease was achieved by drying the sample in independent stages after suction readings had equilibrated for each stage. The limitation of both continuous and stage
drying techniques is that volumetric measurements cannot be easily included in the
experimental set up, preventing the determination of degree of saturation during the test (Toker et al. 2004).
During the course of this experiment, several plausible sources of errors which would affect the accuracy of suction and water content measurements are identified:
• As the tensiometer is very sensitive to external disturbance, placing the tensiometer on the sample top can not guarantee a good contact to be established at all times. The wobbly lines in Figure 8 showed that poor contact between the soil and tensiometer interface occurred.
A measure to insert the tensiometer at the bottom of the sample should provide
Soil water retention curve
0
10 100 1000 10000
Matric suction (kPa)
G
Sample 1 Sample 2
9 a good contact supported by the sample’s self weight.
• The loss of little amounts of soil during specimen handling at each drying stage might cause inaccuracy in the gravimetric water content determination.
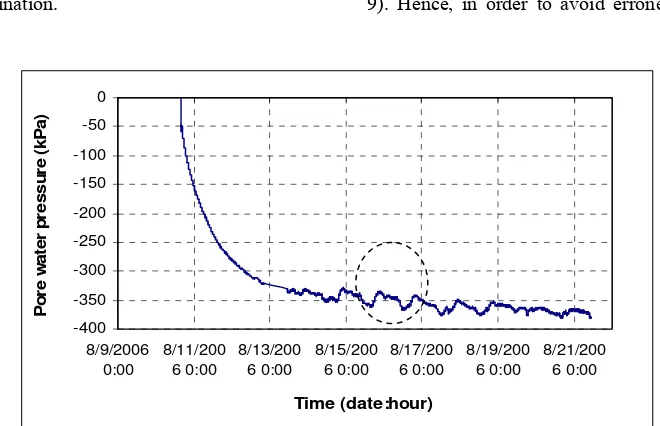
• For stage drying it is imperative to ensure achievement of equilibrium at the end of each stage. A suction rebound is sometimes observed after placing the tensiometer in contact with the soil, indicating lack of equalisation (Figure 9). Hence, in order to avoid erroneous
-400
Figure 8. Indication of poor contact between soil sample and tensiometer
-1000
8/21/2006 8/23/2006 8/25/2006 8/27/2006 8/29/2006 8/31/2006 Time (Date)
10 readings, enough time must be allowed for the stabilisation of suction at a constant value.
Besides those factors above, adequate saturation of the high air entry stone of the tensiometer is vital in order to prevent premature cavitation of the tensiometer during each suction measurement stage.
4. CONCLUSION
The paper presents the application of the WF-DU tensiometer for the determination of the soil water retention curve of a consolidated mixture of sand, bentonite and kaolin. Simple, rapid and realistic testing is of the main advantage of soil suction measurement using the tensiometer. The disadvantage of this tensiometer test is that volume change measurements can not be incorporated in the test set up, thus degree of saturation of the sample during testing can not be determined. Stage drying technique was employed in this study, which has got the advantage of allowing complete equalisation to be achieved during suction measurement. Possible sources of inaccuracy in this technique were identified which include the relative position of the tensiometer with the sample and the loss of soil mass during specimen handling.
5. ACKNOWDLEDGEMENT
The author would like to express thanks and gratitude to Dr. D. Gallipoli, Mr. S. Lourenço and Mr. B. McEleavey of Geotechnical Laboratory, School of Engineering, University of Durham, United Kingdom for their kind assistance and very informative discussions. Thanks are also due to Dr. Adrin Tohari of Pusat Penelitian Geoteknologi - LIPI for his helpful suggestions and thorough comments on this manuscript.
6. REFERENCE
Brooks, R. and Corey, A. (1964), Hydraulic properties of porous media, Hydrology paper No 3, Colorado State University, Fort Collins, CO.
Boso, M., Romero, E., and Tarantino, A (2003), The use of different suction measurement techniques to determine water retention curves. In: Schanz T (ed.) Unsaturated soils: Experimental studies, Springer-Verlag Berlin, pp 171-181
Cunningham, M., (2000), The mechanical behaviour of a reconstituted unsaturated soi, Ph.D. Thesis, Imperial College of Science, Technology and Medicine, London.
Donoghue, M., (2006) The performance effects of suction probe saturation in laboratory testing applications, M.Eng thesis, University of Durham, Durham.
Fredlund, D.G. and Rahardjo, H., (1993), Soil Mechanics for Unsaturated Soils; copyright Wiley, 1993.
Fredlund, D.G. and Xing, A., (1994), Equation for soil water characteristic curve, Canadian Geotechnical Journal, Vol. 31, No.3, pp.521-532.
Fredlund, D.G., Xing, A., Huang, S., (1994), Prediction of the permeability function for unsaturated soils using soil water characteristic, Canadian Geotechnical Journal, Vol.31, No.3, pp. 533-546.
11 Martins, J.P., (1983), Shaft resistance of axially
loaded piles in clay, PhD thesis, Imperial College, The University of London.
Toker, N., Germaine, J., Sjoblom, K., Culligan, P., (2004), A new technique for rapid measurement of continuous soil moisture characteristic curves, Géotechnique 54, 3:179-186
Toll, D.G., (1999), A data acquisition and control system for geotechnical testing, Computing Developments in Civil and Structural Engineering, (eds. B. Kumar and B.H.V. Topping), Edinburgh: Civil-Comp Press, pp. 237-242.
Van Genucthen, M.Th., (1980), A closed form equation prediction the hydraulic conductiviy in unsaturated soils, Soil Science Society of American Journal, No. 44, pp. 892-898.