banks using stochastic frontier analysis”
AUTHORS
Isfenti Sadalia https://orcid.org/0000-0001-5397-2135 Muhammad Haikal Kautsar
Nisrul Irawati
Iskandar Muda https://orcid.org/0000-0001-6478-9934
ARTICLE INFO
Isfenti Sadalia, Muhammad Haikal Kautsar, Nisrul Irawati and Iskandar Muda (2018). Analysis of the efficiency performance of Sharia and conventional banks using stochastic frontier analysis. Banks and Bank Systems, 13(2), 27-38. doi: 10.21511/bbs.13(2).2018.03
DOI http://dx.doi.org/10.21511/bbs.13(2).2018.03
RELEASED ON Monday, 11 June 2018
RECEIVED ON Tuesday, 06 February 2018
ACCEPTED ON Wednesday, 23 May 2018
LICENSE This work is licensed under a Creative Commons
Attribution-NonCommercial 4.0 International License
JOURNAL "Banks and Bank Systems"
ISSN PRINT 1816-7403
ISSN ONLINE 1991-7074
PUBLISHER LLC “Consulting Publishing Company “Business Perspectives”
FOUNDER LLC “Consulting Publishing Company “Business Perspectives”
NUMBER OF REFERENCES
42
NUMBER OF FIGURES
2
NUMBER OF TABLES
7
Abstract
There are two sectors of banks operating in Indonesia, namely Sharia banks and conventional banks. Improving performance is important in maintaining public confidence in the bank. Efficiency is one of the parameters to measure the performance of Sharia banks. This study measures the comparative level of technical efficiency of Sharia commercial banks and conventional banks by Stochastic Frontier Analysis method during 2011–2015 period by using 10 samples of Sharia commercial banks and conventional banks. Input variables in this study are total deposits, operational costs, and other operational costs. Total financing is an output variable. The results of this study show that total deposits and operational costs have a positive and significant impact on total financing in Sharia and conventional banks. The average score of the technical efficiency of Sharia commercial banks during the period observed is 0.84 and conventional banks is 0.85.
Isfenti Sadalia (Indonesia), Muhammad Haikal Kautsar (Indonesia), Nisrul Irawati (Indonesia), Iskandar Muda (Indonesia)
BUSINESS PERSPECTIVES
LLC “СPС “Business Perspectives” Hryhorii Skovoroda lane, 10, Sumy, 40022, Ukraine
www.businessperspectives.org
Analysis of the efficiency
performance of Sharia
and conventional banks
using stochastic frontier
analysis
Received on: 6th of February, 2018
Accepted on: 23rd of May, 2018
INTRODUCTION
Banks are financial institutions that play intermediary roles to bring together those who have excess funds with those in need of funds. In performing its role as a party to conduct intermediation, the bank has two concepts of implementation, conventional and Sharia. Conventional banks are banks that operate generally in the commu-nity, while Sharia banks are banks that run operations according to the Sharia principles. Islamic banks have grown in Indonesia, even though the number of non-Muslim customers is quite a lot. This shows that the principles adopted by Islamic banks can be accepted by various circles. The reputation of Islamic banks that has increased in relation to their success during a financial crisis, and other ratioh -nale of competence and service quality are important factors, which become the answer to the question: Why Islamic bank are appoint of interest not only for non Muslim (Dusuki et al., 2007). Berger and Humphrey (1997) find from efficiency methods inconsistent and inac-curate results. Altunbas and Chakravarty (1998) find from European integration in financial services that banks will be equally efficient be-tween countries with the abolition of cross-border restrictions. There remains doubt, however, that banks do not necessarily perform the same function in every country. Comparative efficiency of national cross-border banks requires a study of the differences between coun-tries in the institutional structure of the banking system. Bos and Kool (2006) stated that when conducting efficiency studies for the banking
© Isfenti Sadalia, Muhammad Haikal Kautsar, Nisrul Irawati, Iskandar Muda, 2018
Isfenti Sadalia, Dr., Faculty of Economics and Business, Universitas Sumatera Utara, Indonesia. Muhammad Haikal Kautsar, SE, M.Si, Faculty of Economics and Business, Universitas Sumatera Utara, Indonesia.
Nisrul Irawati, Dr., Faculty of Economics and Business, Universitas Sumatera Utara, Indonesia. Iskandar Muda, Dr., Faculty of Economics and Business, Universitas Sumatera Utara, Indonesia.
This is an Open Access article, distributed under the terms of the
Creative Commons Attribution-Non-Commercial 4.0 International license, which permits re-use, distribution, and reproduction, provided the materials aren’t used for commercial purposes and the original work is properly cited.
bank, technical efficiency, stochastic frontier analysis
Keywords
sector, environmental factors are not controlled appropriately in estimating the efficiency bias. The use of exogenous input prices rather than endogenous input prices is important for measuring inef-ficiencies where costs are greater. In addition, the research found that the expected inefficiency is managerial inefficiency. Valverde et al. (2007) reveal roughly equal efficiency after controlling for differences in business environments, banking costs, and bank productivity. The banking consol-idation proceeds and Europe moves toward a single market, cross-country differences in banking efficiency, helping to determine which European money centers may expand or contract. Casu and Molyneux (2003) examine whether there is an increase and convergence of productivity in the single internal market. The results and factors that produce regression can be biased. Casu and Girardone (2010) argue that finance and convergence are necessary in order to generate EU deregulation to im-prove the efficiency and performance of the banking sector. These results provide evidence that the convergence of efficiency levels in the EU can not be done thoroughly. Chortareas et al. (2013) invesr-tigate measures of financial freedom and bank efficiency. The results of the study found higher levels of financial freedom with higher rates. The effect of financial freedom on bank efficiency is more pronounced in countries with a more free political system. Casu et al. (2004) found that productivity changes are due to technological changes or efficiency changes.
Maintaining performance is a key factor for maintaining customer confidence, so banks will be competi-ing to keep their performance good. Therefore, the measurement of bank performance in Indonesia needs to be done to maintain public confidence in the bank in Indonesia. Efficiency is one of the performance parameters, which theoretically underlies the entire performance of a company. The ability to produce maximum output with existing inputs is an expected performance measure (Muda, 2018). At the time of efficiency measurement, the bank is expected to be able to obtain optimal output with existing input level, or use a minimum level of input with a certain level of output. With identified input and output allocations, it can be analyzed further to see the cause of inefficiency (Hadad et al., 2003). Some efficiency indicators int-clude the amount of deposits, financing, and total assets. If the value is greater, then the bank performance is better. If it decreases, the bank decreases the quality of its performance.
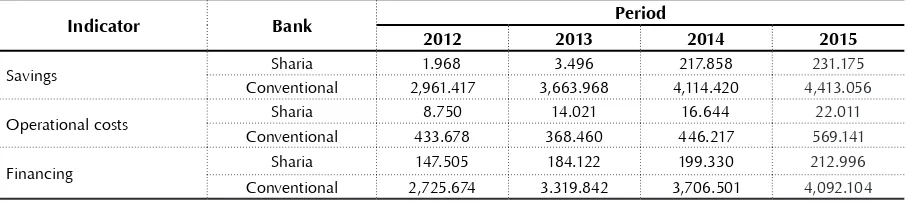
Table 1. The development of national Sharia banking performance(in trillion rupiah)
Source: Results of the researcher’s processed data (2017).
Indicator Bank Period
2012 2013 2014 2015
Savings Sharia 1.968 3.496 217.858 231.175 Conventional 2,961.417 3,663.968 4,114.420 4,413.056
Operational costs Sharia 8.750 14.021 16.644 22.011 Conventional 433.678 368.460 446.217 569.141
Financing Sharia 147.505 184.122 199.330 212.996 Conventional 2,725.674 3.319.842 3,706.501 4,092.104
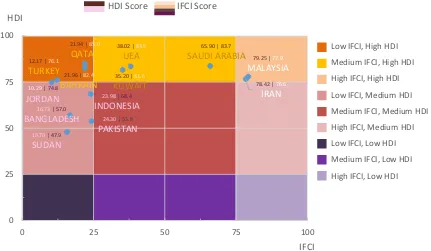
Table 1 compares indicators of edition of conventional banks and Sharia banks. In general, there is still a considerable comparison of capitalization between Sharia banks and conventional banks, where cone-ventional banks are much larger than Sharia banks. In the assessment of the Islamic Finance Country Index (IFCI), Malaysia ranks second related only to Iran having a potential and conducive to the devel-opment of the Islamic finance industry. This assessment is based on several aspects of the index calcula-tion, such as the number of Syariah banks, the number of non-bank Syariah institutions, and the size of Sharia financial assets that have the greatest weight. This is illustrated in Figure 1.
unavailabil-ity of these economies has made the operation of Sharia banks in Indonesia less efficient, especially the majority of Sharia banks in Indonesia are still in the expansion phase, which requires significant infra-structure investment costs. Using the operational cost ratio indicator to operating income in the three sample banks for each category shows that Sharia banks are still less efficient than conventional ones.
There are several ways to measure efficiency. First is the ratio approach to measure the efficiency by calcut-lating the ratio of inputs and the output used. This approach can be judged to have high efficiency if it can produce as much output as possible with minimal input. Second, this approach uses a model of a given level of output as a function of a particular input. The regression approach will result in an estimate of the relationships that can be used to produce the output generated by a particular input economy unit. The economic activity unit is efficient when the value of the calculation is greater than the estimated result. The disadvantage of this approach is the inability to accommodate the output, since in the equation, a regression can hold only one output indicator. When multiple merged outputs in one indicator then the resulting information becomes no longer detailed (Muharam & Purvitasari, 2007). The third approach is with frontier. The frontier approach to measuring efficiency is divided into two types, namely parametric frontier approach and non-parametric frontier approach.
The efficiency in this research is measured using Stochastic Frontier Analysis (SFA) method developed by Aigner et al. (1977). SFA has advantages over other models, first, the inclusion of distrubance term that represents interference, measurement error and exogenous shock that is out of control. Second, en-vironmental variables are more easily treated, allowing hypothesis testing using statistics, more easily identified outliers. There are three approaches in looking at inputs and outputs from banks. First, the asset approach reflects the primary function of a financial institution as the creator of the credit guar-antee. In this approach, output is actually defined into the asset form. Second, the production approach, this approach considers the financial institution as the producer of the deposit account and loan credit, then defines the output as the amount of labor, expenditure, capital on assets and other materials (Muda, 2018). Third is the intermediation approach. The intermediation approach is used in this research. This approach views the financial institution as an intermediary, which is changing and transferring finan-cial assets from surplus units selling deficit units. In this case, institutional inputs such as labor costs,
Figure 1. Islamic Finance Country Index (IFCI, 2017) 10.29| 74.8
JORDAN
15.70| 47.9 SUDAN
16.73| 57.0
BANGLADESH
21.96| 82.4 BAHRAIN
12.17| 76.1 TURKEY
23.98| 68.4
INDONESIA
24.30| 53.8 PAKISTAN
21.94|85.0 QATAR
38.02| 83.5 UEA
35.20| 81.6 KUWAIT
65.90| 83.7
SAUDI ARABIA 79.25 | 77.9
MALAYSIA
78.42| 76.6
IRAN
0 25 50 75 100
0 25 50 75 100
HDI
IFCI
HDI Score IFCI Score
capital, and interest financing on the deposit, then with the output are measured as loan credit and financial investment (Muda et al., 2016; Syahyunan et al., 2017; Sihombing et al., 2017). Finally, this approach sees the primary function of a financial institution as the creator of loan credit. Therefore, the input variables used in this study are total deposits, operational costs, and other operational costs. Financing is the output variable.
Several studies related to efficiency using SFA method for Sharia commercial banks ever conducted by Tahir and Haron (2010) conducted a technical analysis of conventional bank efficiency in Malaysia to find an efficiency level of 0.81. Haqiqi and Muharam (2015) conducted a study comparing the efficiency level of Sharia commercial banks and Sharia business units in Indonesia and found an efficiency score of 0.9 for Sharia commercial banks and Sharia business units.
Wahyudi (2014) conducted a comparative study of profit efficiency in Sharia banks in Indonesia and Malaysia and found the average efficiency of Sharia banks in Indonesia by 42.75% while Islamic banks in Malaysia by 67%. Rahmawati (2015) conducted efficiency analysis on Sharia banks with SFA method and envelopment analysis data and obtained the result of average value of cost efficiency with SFA and DEA model on each BUS, namely at BMI equal to 83.28% and 94.87; at BSM of 87.96% and 92.65%; at BMS of 92.38% and 92.86%; at BRIS of 78.35% and 91.95%; on BSB of 84.92% and 93.93%; and in the overall BUS of 85.38% and 93.25%. This shows that there is a difference in efficiency between the use of stochastic frontier analysis and data envelopment analysis.
Hamim et al. (2011) examined the efficiency of Islamic banks in Malaysia and found that its level has in-creased despite still not exceeding conventional banks. The purpose of this study is to measure the effect of deposits, operational costs, and other operational costs on financing. Then, to measure the efficiency level of Sharia commercial banks. The originality of this study is in measuring the level of comparative technical efficiency at Sharia commercial banks and conventional banks in Indonesia, while previous studies analyzed only the conventional banks. The study was conducted in Indonesia and Malaysia, because the two countries have very fast Sharia banking development and have the largest segment of Islamic banking customers in the world. Further, the researchers’ hope in terms of this research results is they are able to serve as research reference and decision-making for management and policy makers in improving the Sharia banks efficiency.
1.
LITERATURE REVIEW
1.1. Bank efficiency
The concept of banking efficiency measurement was first discovered by Farrell (1957). Technically, there are three concepts of efficiency, namely cost efficiency, standard profit efficiency, and alterna-tive profit efficiency. Cost efficiency measures how close is the difference between the real cost and the various possible cost levels that occur to gener-ate the same amount of output. The standard profit efficiency measures how close is the real gain with the maximum level of profit that can be achieved at certain input and output price levels. While the efficiency of alternative benefits measures how close are the benefits obtained by banks with the maximum profitability that may be achieved at
various levels of output quantities and input pric-es (Berger & Humphrey, 1997). Furthermore, cost efficiency is divided into two parts, namely output efficiency and input efficiency. The output efficien-cy is based on the ratio between cost at all output levels and their optimum cost. The essence of this efficiency is how much output can be improved proportionally without changing the number of inputs. While the input efficiency is related to the company’s ability to use input efficiently in gener-ating more output.
1.2. Stochastic Frontier Analysis
theory
pro-duction function, efficiency is measured by taking into account the maximum level of output that can be achieved with a certain number of input combi-nations. While the cost efficiency function is meas-ured based on the minimum level of cost that can be achieved by a company with a certain level of output. This research applies SFA method meas-urement with production function. Production efficiency is defined as the relationship between the amount of output production and the quan-tity of inputs. Production efficiency occurs when the firm carries out the optimum production that is the result of a particular input combina-tion. In this method, the production of a bank is modeled to be deviated from its efficient pro-duction frontier resulting in random noise and inefficiency. The standard function of SFA with production function has the following general form (log):
( )
( )
( )
( )
1 0 1 1
2 2 n n n
Ln Q
ln P
ln P
...
l
=
n P
E
β
β
β
β
+
+
+
+ +
+ ,
(1)where P1, P2, P3, and Pn are the inputs of this rese a rch, namely total savings, operational costs, and other operational costs at bank n, while Q1
is the quantity of output in this study, that is total financing at bank n. While En is an error term and consists of two functions of two comf-ponents, namely:
n i i
E
=
U
−
V
,
(2)
where Ui – random factor that can be controlled (inefficiency); Vi – random factor that can not be controlled.
The assumption used in the above equation is:
2
0 u
Ui≈iid N( .⋅
σ
),(3)
2
0 u
Vi≈iid N( .⋅
σ
), (4)
where Ui and Vi are distributed independently of each other also to input variables. The result of measurement of SFA method that appears is in the form of score between 0–1. The closer it is to one, the more efficient the bank is, while the results nearing to 0 indicates the bank is inefficient.
1.3. Total savings to total financing
According to Antonio (2001), deposits are a pure savi ngs from customers to banks, which are then used by banks in certain economic activities with bank records guaranteeing its return completely to customers. Deposits have a positive relationship to total financing. The greater the amount of deposit funds, the greater the amount of financing disbursed (Muda et al., 2018). Vice versa, when the amount of deposits is less, then the funds that can be distributed will be less too. So, it can be arranged into hypotheses.
1.4. Total operational costs
to total financing
According to Rivai (2007), other operational costs are all costs associated with bank operations ex-cept margin cost or profit sharing. Similar to the principle of operating costs where the more banks manage other operational costs the more efficient the bank (Sadalia et al., 2017). Conversely, the less the operational costs, the greater the ability to channel the financing, because the allocated funds are getting bigger.
1.5. Hypotheses development
H1: Total deposits have a significant positive ef-fect on total financing of Sharia commercial banks during the period 2012–2015.
H2: Total deposits have a significant positive ef-fect on total conventional bank financing during the period 2012–2015.
H3: Total operating costs significantly adversely affect the total financing of Sharia commer-cial banks during the period 2012–2015.
H4: Total operating costs significantly adverse-ly affect the total financing of conventional banks during the period 2012–2015.
H5: Other total operating costs have significant neg-ative effect on total financing at Sharia com-mercial banks during the period 2012–2015.
H7: There is a difference in efficiency level of Sharia commercial banks compared to con-ventional banks.
2.
RESEARCH METHOD
2.1. Population
and sample
The population of this study was all Sharia com-mercial banks during the period 2010–2015. While the sample used in this study was 11
com-panies of Sharia commercial banks during the pe-riod 2010–2015.
Table 2. Sample selection criteria
No. Criterion Note
1 A Sharia commercial bank having a similar conventional bank listed in the Financial
Services Authority 2015 10
2
Sharia commercial banks and conventional commercial banks that have been operating in Indonesia during the 2011–2015 observation period
10
3 2011–2015 observation period published by the Presents financial statements during the Financial Services Authority 10 4 A Sharia public bank that meets the criteria for sampling 10
2.2. Operational definition
The operational definition of this study is shown in Table 3.
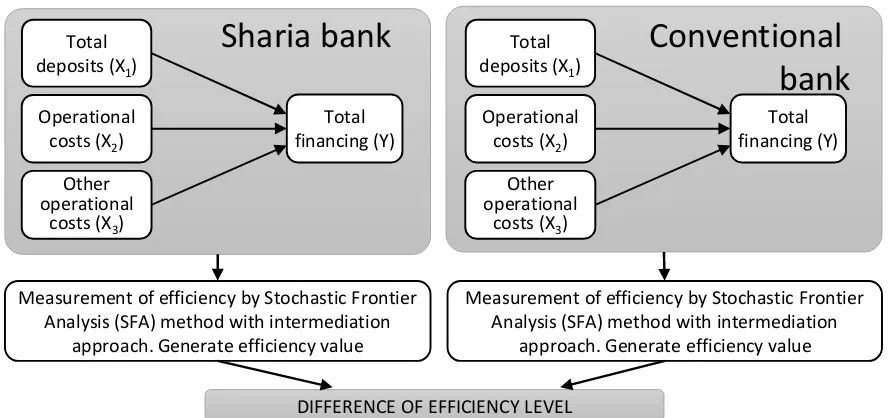
Figure 2. Theoretical framework Measurement of efficiency by Stochastic Frontier
Analysis (SFA) method with intermediation approach. Generate efficiency value
Measurement of efficiency by Stochastic Frontier Analysis (SFA) method with intermediation
approach. Generate efficiency value
DIFFERENCE OF EFFICIENCY LEVEL
Sharia bank
Conventional
bank
Total deposits (X1)
Operational costs (X2)
Total financing (Y)
Other operational
costs (X3)
Total deposits (X1)
Operational costs (X2)
Total financing (Y)
Other operational
costs (X3)
Table 3. Operational definition
Variable Operational definition Variable indicator Scale
Total deposits
Total deposits represent a number of public funds of either individuals or legal entities that have been collected by Islamic banks through fundraising products
Third-party funds Ratio
Operational costs Operationals costs are direct costs associated with the operational activities of the bank’s business
Personnel costs + Administration costs and general and office expenses + Provision allowance for possible losses + Costs for losses on commitments and contingencies
Ratio
Other operational costs
Other operational costs are operating expenses that do not fall into the operational costs
category Promotional costs + Other costs Ratio
Total financing
The main product of the bank as an
intermediary institution that connects between parties who have excess funds and those who need funds
2.3. Data analysis method
This econometric model is used to test individual persuasions. In this test, the output variable used was the total financing, which was a variable whose value is influenced by a combination of quantities of input variables.
( )
( )
( )
( )
1 0 1 1
2 2 3 3
i i
Ln Q
Ln P
Ln P
Ln P
U
V
β
β
β
β
=
+
+
+
+
+
− ,
(5)where Q1 – total financing; P1– total deposits; P2
– operational costs; P3 – other operational costs;
Ui – random factors that can be controlled (inef-ficiency); and Vi – random factor that can not be controlled.
From this mode, it will be known how to prove the hypothesis about whether there is an influence of input variables on output variables. The influ--ence of input variables on the output variable was measured by using one tailed test with α = 0.01. Meanwhile, to measure the efficiency, stochastic frontier analysis method was used to know the value of efficiency over time. The resulting effi-ciency value was 0–1. The closer it to 1, then the more efficient the company is and vice versa, when the number is closer to 0, then the company is in -creasingly inefficient. Stochastic Frontier Analysis method was used to get the efficiency value. For data processing of Stochastic Frontier Analysis software, the researcher used Frontier 4.1.
2.4. Differentiation testing
In this study, the differentiation testing used the independent statistical tools of sample t-test. Independent sample t-test was a test used to deter-mine whether two unrelated samples have differ-ent meanings. The purpose of this statistical meth-od was to compare the average of two groups that were not related to each other. The question that was answered is whether the two groups have the same or not the same average value significantly.
2.5. Hypotheses testing
This study formulated four hypotheses as stat-ed in the sub-section of the problem formulah -tion. The t-test was used in this study as a tool to
test the hypotheses (Muda 2017; Dalimunthe et al., 2017; Handoko et al., 2017). Based on the problem formula tion, hypotheses testing is proposed:
Hypothesis β
H0i: βi = 0; i = 1, 2, 3 where βi are the parameters of input of a Sharia public bank. βi = 0 means that there was no influence of input on out-put in Sharia banks.
a. If
t
count>
t
table or sig < 0.05, then H0is rejected.b. If
t
count>
t
tableor sig > 0.05, then H0 is accepted.Hypothesis α
H0i: α there is no difference in efficiency between Sharia commercial banks and conventional banks.
a. If tcount > ttableor sig < 0.05, then H0is rejected.
b. If tcount < ttable or sig > 0.05, then H0is accepted.
3.
RESULTS AND DISCUSSION
3.1. Results
3.1.1. The estimation of empirical model of Stochastic Frontier Analysis function using MLE
Maximum Likelihood Estimation is used to de-termine the maximum performance of Sharia commercial banks and conventional banks in channeling financing. In the Frontier 4.1 appli-cation, the Maximum Likelihood Estimation is obtained from estimation using Ordinary Least Square (OLS) and second phase grid search then it is estimated to find Stochastic Frontier function using Maximum Likelihood Estimation (MLE). The following table shows the results of Maximum
Likelihood Estimation with Frontier 4.1.
Then, given the level of significance, it is seen that the calculation of t-ratio value of 7.177 is great-er than the value of ttable of 2.41. It indicates that
H0 is rejected and H1 is accepted, meaning there is a significant influence of total deposits on total financing.
The coefficient of β2 shows that the value of 0.21 means that every 1 percent increase in opera-tional costs will have an impact on the financ-ing increase of 0.21 percent (ceteris paribus). Furthermore, as can be seen from the level of significance, the calculation of t-ratio of 2.994 is greater than the value of ttableof 2.41, which indii-cates that H0 is rejected and H1 is accepted, meanm ing there is a significant influence of total opera -tional costs on total financing.
Different things are shown by β3 coefficients that
get a value of –0.04, meaning that any 1 point increase in other operating costs will cause a financing decrease of –0.04 percent (ceteris par -ibus). Furthermore, following on from the level of significance, it can be seen that the calculation value of t-ratio of 0.646 is smaller than the ttable
value of 2.41. This indicates that H0 is accepted,
meaning there is no significant influence of to-tal other operational costs on toto-tal financing. Furthermore, the value of gamma (Υ) shows the value of 0.463. This shows that 46.3% difference occurs between the total actual financing with total financing maximum. This is due to
techni-cal ineficiency. While the other 53.7% difference
is caused by random noise (random factor). From the results of this estimate the following equation can be written:
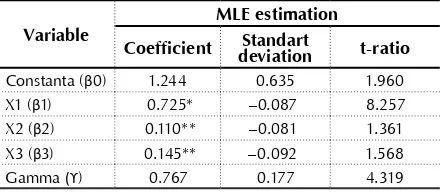
Table 5. Estimation results of a conventional
bank MLE
Source: Results of the researcher’s processed data (2017).
Variable
MLE estimation
Coefficient deviationStandart t-ratio
Constanta (β0) 1.244 0.635 1.960 X1 (β1) 0.725* –0.087 8.257 X2 (β2) 0.110** –0.081 1.361 X3 (β3) 0.145** –0.092 1.568 Gamma (ϒ) 0.767 0.177 4.319
Note: * – significant at α = 1%, ** – not significant.
From the results of this estimate the following equation can be written:
1
According to Table 5, the conventional bank
MLE estimation results in the coefficient of β1,
which shows the value of 0.725 and indicates that every 1 percent increase of total deposits will impact the total financing of 0.725 percent (ceteris pari bus). Then, following on from the level of significance, it is seen that the calcula-tion of t-ratio value of 8.257 is greater than the value of ttable of 2.41, which indicates that H0 is
rejected and H1 is accepted, meaning there is a
significant influence of total deposits on total financing. The coefficient of β2 shows the val-ue of 0.110 meaning that every 1% increase in operational costs will have an impact on the fi-nancing increase of 0.110 percent (ceteris pari-bus). Furthermore, following on from the level of significance, it appears that the calculation of t-ratio of 1.361 is smaller than the value of
ttable of 2.41. This indicates that H0 is accepted, meaning there is no significant influence of to-tal operational costs on toto-tal financing.
Table 4. Estimated results of MLE of Sharia commercial banks
Source: Results of the researcher’s processed data (2017).
Variable MLE Estimation
Coefficient Standard deviation t-ratio
Constant (β0) 2.034 0.989 2.056 X1 (β1) 0.675* 0.094 7.177 X2 (β2) 0.210* 0.0702 2.994 X3 (β3) –0.04** 0.063 0.646 Gamma (ϒ) 0.463 0.717 0.646
The β3 coefficient obtains a value of 0.145, this means that every 1 point increase in other oper-ating costs will lead to an increase in financing of 0.145 percent (ceteris paribus). Furthermore, procee ding from the level of significance, it is seen that the calculation of t-ratio of 1.568 is smaller
than the value of ttable of 2.41 meaning there is
no significant influence of total other operational costs on total financing. Furthermore, the value of gamma (Υ) shows a value of 0.767. This shows that 76.7% difference occurs between the total actual financing with the maximum total financing. This is due to technical ineficiency. While the other 23.3% difference is caused by random noise (ran-dom factor).
3.2. Discussion
3.2.1. Analysis of technical efficiency differences at Sharia commercial banks
and conventional banks
As expressed by Coelli (1996), the resulting efficien-cy value is 0 – 1. The closer it to 1, the more efficient the company is and vice versa, the closer it to 0, the
more inefficientе the company is. Furthermore, the discussion on the technical efficiency condi-tion of convencondi-tional and Sharia commercial banks will be shown in Table 6.
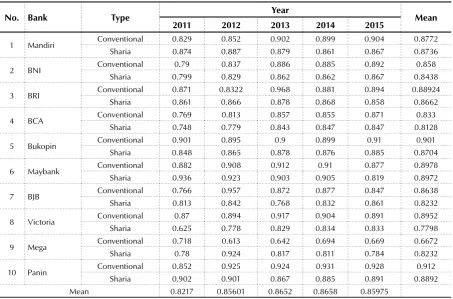
Table 6 shows the technical efficiency condi-tions of the Sharia and conventional banks dur-ing the period 2011–2015. Broadly speakdur-ing, both Sharia commercial banks and convention-al banks experienced a trend that tended to in-crease, although accompanied by fluctuations in certain years. However, there are also banks that have decreased the efficiency of a Sharia bank (Maybank) from the Sharia bank sector and Mega Bank from conventional bank sector. In general, the average score for Sharia banks is 0.84. While conventional banks have an aver-age efficiency score of 0.85, indicating both the sectors of Sharia banks and conventional banks in general have a fairly good level of efficiency. The next will be test differently as it is conductt-ed using t test to see whether there is a signifi-cant difference between the efficiency of Sharia banks and conventional banks. This difference test utilizes SPSS 22 software.
Table 6. Efficiency of Sharia commercial banks and conventional banks
Source: Results of the researcher’s processed data (2017).
No. Bank Type Year Mean
2011 2012 2013 2014 2015
1 Mandiri Conventional 0.829 0.852 0.902 0.899 0.904 0.8772 Sharia 0.874 0.887 0.879 0.861 0.867 0.8736 2 BNI Conventional 0.79 0.837 0.886 0.885 0.892 0.858
Sharia 0.799 0.829 0.862 0.862 0.867 0.8438 3 BRI Conventional 0.871 0.8322 0.968 0.881 0.894 0.88924
Sharia 0.861 0.866 0.878 0.868 0.858 0.8662 4 BCA Conventional 0.769 0.813 0.857 0.855 0.871 0.833
Sharia 0.748 0.779 0.843 0.847 0.847 0.8128 5 Bukopin Conventional 0.901 0.895 0.9 0.899 0.91 0.901
Sharia 0.848 0.865 0.878 0.876 0.885 0.8704 6 Maybank Conventional 0.882 0.908 0.912 0.91 0.877 0.8978 Sharia 0.936 0.923 0.903 0.905 0.819 0.8972 7 BJB Conventional 0.766 0.957 0.872 0.877 0.847 0.8638 Sharia 0.813 0.842 0.768 0.832 0.861 0.8232 8 Victoria Conventional 0.87 0.894 0.917 0.904 0.891 0.8952 Sharia 0.625 0.778 0.829 0.834 0.833 0.7798 9 Mega Conventional 0.718 0.613 0.642 0.694 0.669 0.6672 Sharia 0.78 0.924 0.817 0.811 0.784 0.8232 10 Panin Conventional 0.852 0.925 0.924 0.931 0.928 0.912
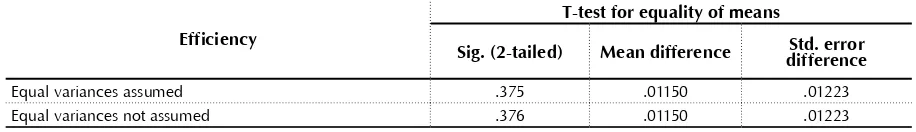
Based on the table, it seems that the value of signifa-icance (2-tailed) of 0.375 signifies greater than the specified significance value of 0.05. This means that there is no significant difference between the effi-ciency of a Sharia bank compared to a conventio nal
bank, so that H0 is accepted. Conventional banks have a larger amount of capitalization compared to Sharia banks. However, performance efficiency of conventional banks is not significantly different from that of Sharia banks.
CONCLUSION
The results of this study that measures the level of efficiency performed on 10 Sharia commercial banks and conventional banks in Indonesia during 2011–2015 with the stochastic frontier analysis approach, con-cluded there is a positive and significant influence of total deposits on total financing between Sharia and conventional banks. Furthermore, there is a positive and significant influence between total operational costs to total financing in Sharia and conventional banks. Then there is the negative and insignificant inn -fluence of total other operational cost on total financing at Sharia commercial banks and positive in-fluence on conventional banks. Finally, the average technical efficiency of Sharia commercial banks in Indonesia during the period 2011–2015 is 0.84. While the average technical efficiency of conventional banks during the period of 2011–2015 amounted to 0.85. This puts the two banking sectors at a good enough efficiency, although there is no significant difference between the two.
Limitations
Limitations in this study are not yet involving the Sharia business unit and Sharia rural bank in the analysis of the Sharia banking industry efficiency in Indonesia. In addition, this research has not measn -ured the efficiency level of the cost efficiency approach and also has not meas-ured the profit efficiency level of a Sharia commercial bank. Therefore, the researcher suggests that further research could involve Sharia business units and Sharia rural banks. In addition, it should analyze the efficiency of Sharia banks through cost efficiency or profit efficiency approaches, since both approaches will provide differn -ent efficiency perspective.
Suggestion
The next suggestion is to compare efficiency measurement using stochastic frontier analysis method and envelopment analysis of data. Use of different methods can provide different efficiency points of view of the same research object.
Table 7. Differentiation testing using t-test
Source: Results of the researcher’s processed data (2017).
Efficiency
T-test for equality of means
Sig. (2-tailed) Mean difference differenceStd. error
Equal variances assumed .375 .01150 .01223 Equal variances not assumed .376 .01150 .01223
REFERENCES
1. Aigner, D., Lovell, K., & Schmidt, P. (1977). Formulation and Estimation of Stochastic Frontier Production Model.
Journal of Econometrics, 6(1), 21-37. Retrieved from
https://pdfs.semanticscholar. org/3d6c/a6a699e579463e-0b01526d9842d41f26b314.pdf
2. Altunbas, Y., & Chakravarty, S. P. (1998). Efficiency Measures
3. Antonio, M. S. (2001). Sharia Bank. Theory and Practice. Jakarta: Gema Insani Publishers. Retrieved from https://catalogue.nla.gov.au/ Record/2477363
4. Berger, A. N., & Humphrey, D. B. (1997). Efficiency of Finan-cial Institutions: International Survey and Directions for Future Research. European Journal of Operational Research, 98(2), 175-212. Retrieved from https://www. sciencedirect.com/science/article/ abs/pii/S0377221796003426
5. Bos, J. W. B., & Kool, C. J. M. (2006). Bank Efficiency: The Role of Bank Strategy and Local Market Conditions. Journal of Banking
& Finance, 30(7), 1953-1974. Retrieved from https://www. sciencedirect.com/science/article/ pii/S037842660500155X
6. Casu, B., & Girardone, C. (2010). Integration and Efficiency Con-vergence in EU Banking Markets.
Omega, 38(5), 260-267. Retrieved from https://www.sciencedi-rect.com/science/article/pii/ S0305048309000826
7. Casu, B., & Molyneux, P. (2003).
A comparative study of efficiency in European banking. Applied Economics, 35(17), 1865-1876.
Retrieved from https://www. tandfonline.com/doi/a b-s/10.1080/0003684032000158109
8. Casu, B., Girardone, C., &
Molyneux, P. (2004). Productivity change in European banking: A comparison of parametric and non-parametric approaches. Journal of Banking & Finance,
28(10), 2521-2540. Retrieved
from https://www.sciencedi-rect.com/science/article/pii/ S0378426603002760
9. Chortareas G., Girardone C., & Ventouri, A. (2013). Financial Freedom and Bank Efficiency: Evidence from the European Union. Journal of Banking &
Finance, 37(4), 1223-1231. Retrieved from https://www. sciencedirect.com/science/article/ pii/S0378426612003640
10. Coelli, T. (1996). A Guide to Frontier 4.1: Computer Program for Stochastic Frontier Production and Cost Function Analysis
(CEPA Working Paper). University of New England. Retrieved from
https://onlinelibrary.wiley.com/ doi/pdf/10.1111/1468-0297.00445
11. Dalimunthe, D. M. J., & Muda, I. (2017). The Empirical Effect of Education and Training to the Performance of Employees.
International Journal of Eco-nomic Research, 14(21), 403-413. Retrieved from http://serialsjour-nals.com/serialjournalmanager/ pdf/1514013716.pdf
12. Danupranata, G. (2013). Management of Islamic Banking. Jakarta: Salemba Empat Pub-lishers. Retrieved from http:// repository.umy.ac.id/han-dle/123456789/2277
13. Dusuki, A. W., & Abdullah, N. I. (2007). Why Do
Malaysian Customers Patronise Islamic Banks? International Journal of Bank Marketing, 25(3), 142-160. https://doi. org/10.1108/02652320710739850
14. Eisazadeh, S., & Zeinab, S. (2012). An Analysis of Bank Efficiency in the Middle East and North Africa.
Internatinal Journal of Banking and Finance,9(4), 47-58. Retrieved from http://www.ijbf.uum.edu.my/ images/ijbfvol9no4dec2012/2-An- analysis-of-bank-efficiency-in-the-Middle-East.pdf
15. Farrell, M. (1957). The Measurement of Productive Efficiency. Journal of the Royal Statistical Society. Series A (General),120(3), 253-290. https:// doi.org/10.2307/2343100
16. Financial Service Authority (2017). Sharia Banking Statis-tic – April 2017. Retrieved from
https://www.ojk.go.id/en/kanal/ perbankan/data-dan-statistik/ statistik-perbankan-syariah/ Pages/Sharia-Banking-Statistic---April-2017.aspx
17. Global Islamic Financial Report (GFIR) (2011). Islamic Finance Country Index (IFCI). Retrieved from http://www.gifr.net/publica-tions/gifr2017/ifci.pdf
18. Hadad, M. D., Santoso, W., Ilyas, D., & Mardanugraha, E. (2003). Analysis of the Efficiency of Indonesian Banking Industry:
Use of Nonparametric Data Envelopment Analysis (DEA) Method. Jakarta: Bank Indonesia Bulletin. Retrieved from https:// www.bi.go.id/id/publikasi/per-& Syed, M. H. (2011). Efficiency of Islamic Banking in Malaysia.
Journal of Economic Cooperation, 2(2), 37-70. Retrieved from
https://pdfs.semanticscholar.org/7 45d/30feb374826f5ac654999d3ab0 6f635708a8.pdf
20. Handoko, B., Sunaryo, & Muda, I. (2017). Difference Analysis of Consumer Perception of Motorcy-cle Product Quality. International Journal of Economic Research, 14(12), 363-379. Retrieved from
https://www.researchgate.net/ (2015). Comparative Analysis of Efficiency of Sharia Commercial Bank (BUS) and Sharia Business Unit (UUS) with Stochastic Frontier Analysis (SFA) Method 2010–2013 Period. Diponegoro Journal of Management, 4(4), 1-15. Retrieved from http:// id.portalgaruda.org/index.php?ref =browse&mod=viewarticle&artic le=463550
22. Kuncoro, M. (2013). Research Methods for Business and Economics: How to Research and Write Thesis? (4th ed.). Jakarta: Erlangga Publishers.
23. Kustanti, H., & Indriani, A. (2016). Comparative Analysis of Efficiency of Sharia Commercial Bank (BUS) and Sharia Business Unit (UUS) with Stochastic Frontier Analysis Method. Diponegoro Journal of Management, 5(3), 1-10. Retrieved from https://ejournal3.undip. ac.id/index.php/djom/article/ view/14174
using the Stochastic Frontier Approach (SFA). Journal of Islamic Economics, Banking and Finance,
4(2), 107-130. Retrieved from
http://ibtra.com/pdf/journal/ v4_n2_article5.pdf
25. Muda, I. (2017). The Effect of Supervisory Board Cross-Membership and Supervisory Board Members’ Expertise to The Disclosure of Supervisory Board’s Report: Empirical Evidence From Indonesia. European Research Studies Journal, XX(3A),702-716. Retrieved from https://www.ersj.eu/ dmdocuments/2017-xx-3-a-47.pdf
26. Muda, I. (2018). The Effect of Allocation of Dividend of the Regional Government-Owned Enterprises and the Empower-ment Efforts on the Revenue of Regional Government: The Case of Indonesia. European Research Studies Journal, XX(4B),244-259. Retrieved from https://ersj.eu/ dmdocuments/2017-xx-4-b-19.pdf
27. Muda, I., Dharsuky, A., Sadalia, I., & Siregar, H. S. (2016). Impact of capital investments and cash dividend policy on Regional Development Bank (BPD) PT. Bank Sumut to the district own source revenue and economic growth. International Journal of Applied Business and Economic Research, 14(11), 7863-7880.
28. Muharam, H., & Pusvitasari, R. (2007). Comparative Analysis of Sharia Bank Efficiency in Indonesia with Data Envelopment Analysis Method Period 2005.
Jurnal Fakultas Ekonomi Diponegoro University, 11(3), 80-166. Retrieved from http://eprints. undip.ac.id/38915/
29. Pohan, N., Dalimunthe, R. F., Purwoko, A., & Muda, I. (2018). The Effects of Human Resource Development and Institutional Arrangements on Performance, Service Quality and Area Development in Indonesia.
Calitatea, 19(163), 94-103. Retrieved from https://search. proquest.com/openview/e44dd9d9 a94189f2122fc2216c4a5d47/1?pq-origsite=gscholar&cbl=1046413
30. Puspitasari, I. (2011). Analysis of Efficiency of Cigarette Industry in Indonesia by Using DEA (Data
Envelopment Analysis) Method 2006–2008. Media Economi, 19(2), 19-25. http://dx.doi.org/10.25105/ me.v19i2.830
31. Rahmawati, R. (2015). Cost Ef-ficiency Enhancement Strategy in Syariah-Based Commercial Banks of Stochastic Frontier Approach and Data Envelopment Analysis.
Bulletin of Monetary Econom-ics and Banking, 17(4), 457-480.
https://doi.org/10.21098/bemp. v17i4.506
32. Republika Online (2017). The Growth of Syariah Bank Stagnan.
Retrieved from www.republika. co.id
33. Rivai, V. (2007). Bank and Financial Institution Management. Jakarta: RajaGrafindo Persada. Retrieved from https://trove.nla. gov.au/work/34607041?q&version Id=42848080
34. Rivai, V., & Arifin, A. (2010).
Islamic Banking. Jakarta: Bumi Aksara Publishers. Retrieved from
https://www.belbuk.com/islamic-banking-p-11489.html
35. Sadalia, I., Rahamani, N. A. B., & Muda, I. (2017). The Signifi-cance of Internet Based Finan-cial Information Disclosure on Corporates’ Shares in Indonesia.
International Journal of Economic Research, 14(12), 337-346. Re-trieved from http://serialsjour-nals.com/serialjournalmanager/ pdf/1507618469.pdf
36. Sihombing, M., Muda, I., Jumila-wati, E., & Dharsuky, A. (2017).
Factors Affecting The Success of Local Innovation Systems with Government Programs As Mod-erators. International Journal of Economic Research, 14(20), 57-69. Retrieved from http://serialsjour-nals.com/serialjournalmanager/ pdf/1517201699.pdf
37. Sillah, M. B., & Harrathi, N. (2015). Bank Efficiency Analysis: Islamic Banks versus Conventional Banks in The Gulf Cooperation Council Countries 2006–2012.
International Journal of Financial Research, 6(4), 187-189. https:// doi.org/10.5430/ijfr.v6n4p143
38. Syahyunan, Muda,I., Siregar, H. S.,
Sadalia,I., & Chandra, G. (2017).
The Effect of Lerner Index and Income Diversification on the General Bank Stability in Indo-nesia. Banks and Bank Systems, 12(4), 171-184. http://dx.doi. org/10.21511/bbs.12(4).2017.05
39. Tahir, I. M., & Haron, S. (2010). Cost and Profit Efficiency of Islamic Bank: International Evidence Using the Stochastic Frontier Approach. Banks and Bank Systems, 5(4), 110-123. Re-trieved from https://businessper- spectives.org/images/pdf/applica-tions/publishing/templates/article/ assets/3668/BBS_en_2010_4_Ta-hir.pdf
40. Tahir, I. M., Bakar, N.M., & Haron, S. (2008). Technical Efficency of Malaysian Commercial Banks: a stochastic frontier approach.
Banks and Bank Systems, 3(4), 12-21. Retrieved from https:// businessperspectives.org/im-cross-country differences in bank efficiency support a policy of “national champions”? Journal of Banking & Finance, 31(7),
2173-2188. https://doi.org/10.1016/j.
jbankfin.2006.09.003
42. Wahyudi, S. (2014). The Com-paration Profit Efficiency Islamic Bank Indonesia and Malaysia with Stochastic Frontier Analysis Methods (ThesisMaster of Manajement, Medan, University of Sumatera Utara).