Full Length Research Paper
Net N mineralization of an andosol influenced by
chicken and cow manure applications in a maize-bean
rotation in Nicaragua
Francisco Salmerón-Miranda
1*, Henrik Eckersten
2and Maria Wivstad
21
Department of Crop Production, Faculty of Agronomy, Universidad Nacional Agraria (UNA), Apartado 453, Managua,
Nicaragua.
2
Department of Crop Production Ecology, Swedish University of Agricultural Sciences (SLU), Box 7043,SE-750 07
Uppsala, Sweden.
Accepted 24 June, 2008
An
in situ
nitrogen mineralization experiment was conducted to assess the response of chicken and
cow manure application at two different rates (5 and 10 Mg DM ha
-1) on net N mineralization in a
maize-bean rotation experiment in Nicaragua. The field study was carried out over four consecutive growing
seasons. Soil samples of the top soil (0-0.3 m) were taken every 30 days within the season in inserted
plastic tubes. The samples were analysed for content of soil mineral N and total organic N. Net N
mineralization was estimated as the difference in soil mineral N over time. The net N mineralization rate
in the treatment with chicken manure applied at the high rate (CHH) was on average 24.5 g N m
-2season
-1and significantly higher than all the other treatments and the unfertilized control, except during
the first season. From season two to season four, the net N mineralization of cow manure at both high
and low application rates were similar to that of low application rate of chicken manure. In the control,
the net N mineralization was significantly lower than in all fertilisation treatments and on average 9.9 g
N m
-2season
-1. It also decreased significantly over time and did not show any indication to increase in
the season following the N
2fixating crop. Only the CHH treatment showed such a tendency. The soil
total organic N did not show any clear pattern over neither time nor treatment. Consequently, the
variation in specific net N mineralization per unit of total organic soil N was similar to that of net N
mineralisation and ranged from 1.6 – 2.9 10
-330d
-1in the control to 4.4 - 6.7 10
-330 d
-1in CHH.
Key words:
Soil organic matter, low input tropical agriculture,
Zea mays
L.,
Phaseolus vulgaris
L.
INTRODUCTION
One of the most spread cropping systems in Central
America region is maize (
Zea mays
L.) and common
beans (
Phaseolus vulgaris
L.) cultivated in rotation and
generally under low input conditions. In such conditions,
the storage and release of nutrients from soil total organic
matter (SOM) are the primary determinant of soil fertility
(Tiessen et
al., 2001). Net nitrogen (N) mineralization
from SOM is largely regulated by soil carbon (C)
decom-position (Weil and Maddoff, 2004), often being rapid
under tropical conditions (Ayanaba and Jenkinson, 1990;
Chander et al., 1997; Goyal et
al., 1999), and thus having
*Corresponding author. E-mail: [email protected],
a high potential as N source. However, a high
decompo-sition rate also entails a rapid decrease in the amount of
SOM and amendments of organic fertilizers can be used
to preserve the SOM levels (Wivstad et al
.,
2005).
Table 1. Monthly rainfall (mm) during four seasons in the N mineralization experiment at La Compañía, Nicaragua (INETER, 2004).
In practical field experiments different qualities are
usually not explicitly expressed and estimates of
decom-posability often relate to SOM. As the C/N ratio of SOM is
fairly stable over shorter time periods (a few years), the
specific decomposability of SOM is fairly similar to the N
mineralisation rate per unit of soil total organic N.
Changes in the N mineralisation rate per unit of soil total
organic N then reflect changes of the specific
decomp-osability. Therefore, in the current study we omitted the
explicit analyses of the relations to soil carbon of the
young volcanic soil, and instead N mineralisation was
related to soil total organic N.
The objective of this work was to study the N
mine-ralization over four growing seasons in a maize (
Z. mays
L.) - bean (
P. vulgaris
L.) rotation on a young volcanic
tropical soil, in response to application of organic
ferti-lisers of different type and rate.
MATERIALS AND METHODS
Experimental site conditions
An in situ N mineralization experiment was carried out during four
consecutive rainfed growing seasons; from May to September (called Primera) and from October to January (Postrera) during the years 2002 and 2003 at the experimental station La Compañía, San Marcos, in Southern Nicaragua, located at 11o54’N and 86o09’W, and 450 m above sea level. The soil is classified as Mollic Andosol (WRB, 1998). The soil is moderately deep and has a top layer (0 - 0.2 m) with a silty loam texture, and has a high drainage capacity. The soil is characterized by: pH in H20 = 6.1, total C = 61 g kg-1, shown in Table 1. Average potential evapotranspiration is about 111 mm month-1 (INETER, 2004). During the growing period prior
the establishment of the experiment, maize was sown and fertilised
with N, P and K at the rates of 15.0, 5.5 and 3.5 g m-2, respectively.
Experimental design and treatments
The maize, cv NB-6 (PROMESA, 2002) was sown in the seasons of Primera 2002 and 2003 and common beans, cv DOR-364 (PROMESA, 2002), in the corresponding Postrera seasons. The experiment consisted of four fertilizer treatments with application of cow and chicken manure at two rates, 500 g dry weight (DW) m-2 (low) and 1000 g DW m-2 (high), respectively, and an unfertilized
control. The experimental plots of 20 m-2 size were arranged in a complete randomized block design with four replicates. The manures were applied before sowing in each of the four growing seasons. Prior to applying, the manures were carefully mixed and three composite samples of each type were taken for chemical analyses of total C and N contents (Table 2). Other manure charac-teristics were: total P = 3.6 and 3.1 g kg-1, NH4+-N = 2 and 0.2 g kg -bution of manure over the plot, the total manure applied to the plot was divided into equally large samples, one for each row, which were carefully distributed from the beginning to the end of the row. Maize was established in the third week of May in 2002 and in early June in 2003. Beans was established in late September and early October, respectively. Sowing was carried out by hand with 0.8 m between rows and 0.2 m between plants in the row, for maize, and 0.4 and 0.1 m, respectively for beans. Manual weed control was carried out on three occasions during the growing season using a machete. The weed residues were left on the soil surface. Pests and diseases were controlled using Methamidofos (phosphoramido-thioate) and benomyl for both maize and beans at a rate of 71.2 g m-2 season-1.
N mineralization experiment
Net N mineralization was estimated in an in situ incubation field experiment. The method used was a modification of the method proposed by Raison et al. (1987). At sowing, after manure applications, six plastic tubes (PVC) of 0.7 m length and 0.1 m inner diameter were inserted into the soil between rows, in each experimental plot. The tubes were pressed into the top 0.65 m of the soil profile, 0.05 m of the tube being above the soil surface. To be able to control water conditions and allow gas exchange the top of the tube was covered with a curved cap of PVC with free access to the air but protecting the tube from precipitation. All through the experimental period the soil moisture in the tubes was checked and in case it was needed water was added by hand, to adjust to the soil moisture of the surrounding soil. Only small amounts of water were added and leaching of N was expected to be small in accordance to Salmerón-Miranda et al. (2007) estimating it for this experiment to be less than 3% of plant N uptake, due to high evaporative demand (an exception was in one 30-day period when it was estimated to be 10%).
Soil sampling (0 – 0.3 m) for soil mineral N (NNH4 and NN03)
Table 2. Manure total C and N concentrations and amounts applied in the N mineralization experiment. Numbers in brackets are s.d. of the means (based on three replicates).
Manure concentration Amounts applied Total C Total N DW Total C Total N Manure treatments
g (kg DW)-1 g m-2
CN ratio
Chicken high CHH 306 (1.4) 33 (0.2) 1000 306 33 9.3 Chicken low CHL 306 (1.4) 33 (0.2) 500 153 16.5 9.3 Cow high COH 173 (1.9) 11.3 (0.1) 1000 173 11.3 15.3 Cow low COL 173 (1.9) 11.3 (0.1) 500 87 5.7 15.3
sampling occasion which, having four replicates, gave eight cores per treatment. The tubes were never used twice, however, not removed until after the third soil sampling to minimize the introduction of systematic disturbances. The tubes were reinstalled in undisturbed soil the next season as described above. In the Postrera seasons with beans the day 90 sampling was replaced by a sampling directly after crop harvest. All soil samples were placed in plastic bags, and stored at approximately 4°C until they were processed.
Chemical analysis
For the manures, total N and C were determined by dry combustion according to the Dumas method using a Leco analyser CNS-2000 (Leco Corporation St. Joseph MI, USA). To determine mineral N the manure samples were extracted with 2 M KCl. The extracts were distilled to recover mineral N with MgO and Devardas alloy. Ammonia liberated by the distillation procedure was collected in 0.025 M H2SO4 and titrated with 0.05 M NaOH. Total P and K were
extracted from wet digestion with nitric acid (HNO3 65%) during 4 h
at 125°C and determined using an Inductive coupled plasma-optical emission spectrometer (Perkin-Elmer Optima 3000DV).
Soil mineral N was extracted by shaking 10 g of soil in 100 ml of 2 M KCl in an end-to-end shaker for 1 h at 150 rotations per min during, and filtering through Whatman # 1 filter paper. The extracts were analysed colorimetrically using a Spectronic, Modelo 21D. Soil total organic N content was measured with the widely used Kjeldahl method (Jackson, 1973). Manure C was analyzed by the Walkley and Black method (Walkley, 1947) because it is widely used and has a low request of equipment (Nelson and Sommer, 1996).
The DW of samples was determined by oven drying at 105°C for 24 h. Soil pH was measured with a glass electrode in a soil to water ratio of 1/2.5. Soil CEC was determined by saturation with NH4OAc
at pH 7 and subsequent replacement of NH4+ by KCl- extraction
(Chapman, 1965). Available phosphorus in soil was extracted with sodium bicarbonate.
Estimations
Net N mineralization in the soil tubes (NMinTube) was estimated as
the difference in mineral N content (ammonium plus nitrate N) between sample occasions t+30 and t, where t is time in units of days.
NMinTube = (NNH4Tube + NN03Tube)t+30 (NNH4Tube + NN03Tube)t (1)
where NNH4Tube and NN03Tube are the observed ammonium and nitrate
N contents of soil in the tubes. The methodology is not an exact representation of the N mineralization from the cultivated soil outside the tubes since it does not consider differences in losses of mineral N through denitrification and leaching between inside and
outside the tubes, and neglects net mineralization or immobilisation from decomposition of the current year root turnover and possible priming effects of active roots (see further the section on discussion and Salmerón-Miranda et al. (2007)).
To express the net N mineralization per unit of soil organic matter the mineralization was estimated as a proportion (a) of the soil total organic N content (NOrgTube; i.e. N mineralization = a. Soil organic
N):
a = NMinTube / NOrgTube (2)
Statistical analysis
Analysis of variance was performed to evaluate statistical differ-rences in measured and estimated variables between treatments. A separate analysis was done to explore differences between seasons for each manure treatment. The SAS statistical program with GLM procedure and Fischer’s LSD test were applied (at 5% significance level; SAS Institute 2001).
RESULTS
Mineral N
0.0 2.0 4.0 6.0 8.0 10.0 12.0 14.0
June-17 July-17 Aug-17 Oct-26 Nov-26 Dec-26 July-04 Aug-04 Sep-04 Nov-04 Dec-04 Jan-04
M
in
e
ra
lis
e
d
N
CHH CHL COH COL Control
Primera2002 (Maize)
Postrera2002 (Beans)
Primera2003 (Maize)
Postrera2003 (Beans)
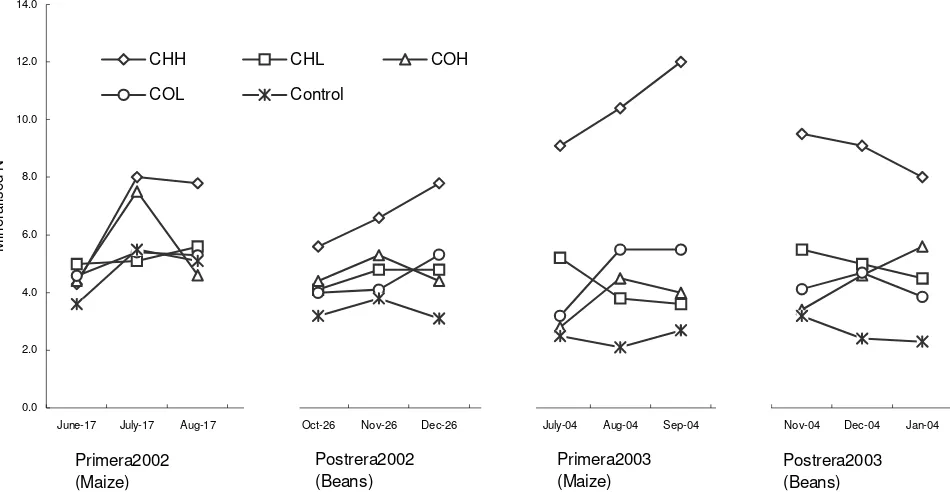
Figure 1. Net N mineralization of the soil layer 0 – 0.30 m (NMinTube; g N m-2 30d-1) between sampling occasions in the four
manure treatments and the control. CHH = chicken high, CHL = chicken low, COH = cow high, COL = cow.
0
500
1000
1500
2000
2500
June-17 July-17 Aug-17 Oct-26 Nov-26 Dec-26 July-04 Aug-04 Sep-04 Nov-04 Dec-04 Jan-04
T
o
ta
l
s
o
il
o
rg
a
n
ic
N
CHH CHL COH COL Control
Primera2002 (Maize)
Postrera2002 (Bean)
Primera2003 (Maize)
Postrera2003 (Bean)
Figure 2. Total soil organic N content of the soil layer 0 – 0.30 m (NOrgTube; g N m-2) in the four manure treatments and the
control. CHH = chicken high, CHL = chicken low, COH = cow high, COL = cow low.
the control it averaged 9.9 g N m
-2season
-1(Figure 1).
The soil total organic N content showed often
signify-cant differences between seasons however not in a
systematic way, although all treatments and the control
achieved their highest value in the last season (Figure 2).
Smallest differences between seasonal averages were
found for the control ranging between 1564 and 1664 g N
m
-2, a variation of about 6%. The spatial variation within
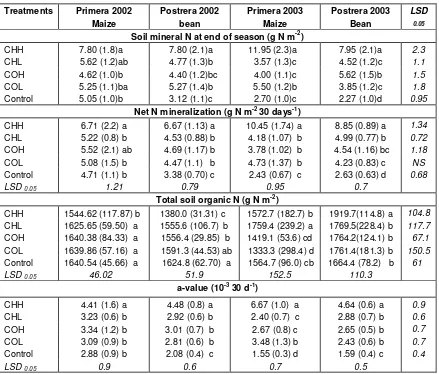
Table 3. Measurements in the tube experiment. Soil mineral N at end of season, seasonal mean values of net N mineralization, total soil N content, C/N ratio, and specific N mineralization rate (a-value) in different manure treatments and an unfertilized control during four consecutive seasons. N mineralization and the a-value are average of three 30-day periods. Soil organic N is an average of four values. Values in parenthesis are one standard deviation. Different letters denote significant differences between trials within seasons at the 0.05 level.
Treatments Primera 2002 Maize
Postrera 2002 bean
Primera 2003 Maize
Postrera 2003 Bean
LSD
0.05
Soil mineral N at end of season (g N m-2)
CHH 7.80 (1.8)a 7.80 (2.1)a 11.95 (2.3)a 7.95 (2.1)a 2.3
CHL 5.62 (1.2)ab 4.77 (1.3)b 3.57 (1.3)c 4.52 (1.2)c 1.1
COH 4.62 (1.0)b 4.40 (1.2)bc 4.00 (1.1)c 5.62 (1.5)b 1.5
COL 5.25 (1.1)ba 5.27 (1.4)b 5.50 (1.2)b 3.85 (1.2)c 1.8
Control 5.05 (1.0)b 3.12 (1.1)c 2.70 (1.0)c 2.27 (1.0)d 0.95
Net N mineralization (g N m-2 30 days-1)
CHH 6.71 (2.2) a 6.67 (1.13) a 10.45 (1.74) a 8.85 (0.89) a 1.34
CHL 5.22 (0.8) b 4.53 (0.88) b 4.18 (1.07) b 4.99 (0.77) b 0.72
COH 5.52 (2.1) ab 4.69 (1.17) b 3.78 (1.02) b 4.54 (1.16) bc 1.18
COL 5.08 (1.5) b 4.47 (1.1) b 4.73 (1.37) b 4.23 (0.83) c NS
Control 4.71 (1.1) b 3.38 (0.70) c 2.43 (0.67) c 2.63 (0.63) d 0.68
LSD 0.05 1.21 0.79 0.95 0.7
Total soil organic N (g N m-2)
CHH 1544.62 (117.87) b 1380.0 (31.31) c 1572.7 (182.7) b 1919.7(114.8) a 104.8
CHL 1625.65 (59.50) a 1555.6 (106.7) b 1759.4 (239.2) a 1769.5(228.4) b 117.7
COH 1640.38 (84.33) a 1556.4 (29.85) b 1419.1 (53.6) cd 1764.2(124.1) b 67.1
COL 1639.86 (57.16) a 1591.3 (44.53) ab 1333.3 (298.4) d 1761.4(181.3) b 150.5
Control 1640.54 (45.66) a 1624.8 (62.70) a 1564.7 (96.0) cb 1664.4 (78.2) b 61
LSD 0.05 46.02 51.9 152.5 110.3
a-value (10-3 30 d-1)
CHH 4.41 (1.6) a 4.48 (0.8) a 6.67 (1.0) a 4.64 (0.6) a 0.9
CHL 3.23 (0.6) b 2.92 (0.6) b 2.40 (0.7) c 2.88 (0.7) b 0.6
COH 3.34 (1.2) b 3.01 (0.7) b 2.67 (0.8) c 2.65 (0.5) b 0.7
COL 3.09 (0.9) b 2.81 (0.6) b 3.48 (1.3) b 2.43 (0.6) b 0.7
Control 2.88 (0.9) b 2.08 (0.4) c 1.55 (0.3) d 1.59 (0.4) c 0.4
LSD 0.05 0.9 0.6 0.7 0.5
CHH = high rate of chicken manure; CHL = low rate of chicken manure; COH = high rate of cow manure; COL = low rate of cow manure; Control = unfertilized.
except for the last season of CHH (Table 3).
Specific N mineralisation rate
The specific N mineralization rate (
a
; Eq. 2) of soil N,
which reflects the decomposition rate per unit of
substrate, not only includes effects of chemical
compo-sition of the substrate, but also abiotic factors like soil
moisture. It is estimated as the ratio between NMinTube
(Figure 1) and NOrgTube (Figure 2), and as NOrgTube showed
a more irregular pattern over time than NMinTube, the
pattern of the specific mineralisation rate was fairly
similar to that of NMinTube. All fertilisation treatments
showed a weak tendency of decreasing
a
-values from
about 3.0 – 3.3 10
-330d
-1in the first season to 2.4 - 2.9
10
-330d
-1in the fourth season, except for CHH which
showed no clear trend. However, the
a
-values of the
control decreased more (from 2.9 to 1.6 10
-330d
-1) (Table
3), and was significantly lower than all treatments from
season two to four (Table 3). The
a
-values of CHH were
significantly higher (ranging 4.4 - 6.7 10
-330d
-1) than all
other
a
values (ranging 1.6 – 3.5 10
-330d
-1) already from
the first season, and showed a considerably increased
value for the third season, the season following the bean
cultivation.
DISCUSSION
First, the mineralization inside the tubes might have been
different from outside the tube, and second the estimates
of the mineralisation inside the tubes might have been
uncertain. Concerning the latter, the N mineralisation
estimates assumed no losses of N due to leaching or
denitrification. This assumption would cause an
under-estimation of the real mineralisation in the tubes.
How-ever, Salmerón-Miranda et al. (2007) estimated the loss
of N by leaching from the soil outside the tubes, in the
current experiment, to have been quite small (0-0.8 g N
m
-230 d
-1) and less than 10% of the mineralisation in the
first 30-day periods, and less than 3% in the second and
third 30-day periods. They also assumed low
denitri-fication losses due to non-saturated soil conditions.
The biophysical conditions were though different inside
the tubes compared to outside. Inside the tubes there
was a larger accumulation of mineral N due to the
absence of root uptake, which might have stimulated the
N losses of the tubes by leaching. On the other hand the
water conditions might have been dryer than outside the
tubes, as they were protected against rainfall with a
curved open cap, which might have retarded the
leac-hing. However, to avoid systematically dryer conditions
compared to outside, the soil moisture in the tubes was
adjusted to the soil moisture of the surrounding soil by
watering at every sampling occasion. However, the need
of watering was found to be small. Further, the absence
of decomposition of root turnover organic material might
have underestimated the N mineralisation of the tubes as
many studies for diverse species have reported that
available substrates (e.g. proliferation and exudation of
organic substance by roots) to the soil is considered to
stimulate soil organic matter mineralization, named as
positive priming effect (Paterson et al., 2006; Kuzyakov et
al., 2002; Fu and Cheng, 2002; Ehaliotis, 1998). In
controlled environment, contribution of N associated to
root and nodule turnover in leguminous crops has been
quantified to range between 7 and 20% (Jenssen, 1994;
McNeill et al., 1997). However, fresh root litter fall with a
high C/N ratio might also act in the opposite direction,
causing an increased immobilisation in the short term
(days to weeks) (cf. Hamer and Marschner, 2005;
Kuzyakov et al., 2000). Also, the possible priming effects
of active roots might be absent (Mayer et al., 2004;
Fon-taine et al., 2003). Altogether, it seems though that most
factors act in a direction that the tube measurements
underestimated, rather than overestimated, the N
mine-ralisation of the soil outside the tubes.
The results show that the soil net N mineralization was
higher for the high chicken manure application rate (10
Mg ha
-1; CHH) than for all other manure applications and
the control (Figure 1). A reasonable explanation is the
large amount of N applied to this treatment, compared to
the other treatments (Table 2), and that this addition
increased the specific mineralization rate (
a
value; Table
3), suggesting that the differences to a large extent were
due to a higher decomposability of CHH. It is more
strange that the chicken low application treatment (CHL)
achieved similar low rate of mineralisation as cow
ma-nure despite higher addition of N (16.5 compared to
5.7-11.3 g N m
-2for cow) and a lower CN-ratio (9.3 compared
to 15.3 for cow) which would be expected to have
increased the net mineralisation (Constantinides and
Fownes, 1994; Kaye and Hart, 1997; Mary et al., 1998;
Nilsson, 2004). Other studies suggest though a
compli-cated relation between type of waste and type of soil that
influence the mineralization (Leifeld et al
.
, 2002) that
might explain the observed little effect of the low rates.
The soil at the experiment exhibits a considerable
amount of total N (5.7 g kg
-1), though we might assume
that a large portion of this N is probably part of a passive
pool considered to have low participation in the N
minera-lization process as it is commonly reported in volcanic
soil (Matus and Rodriguez, 1994). This in combination
with the relative high content of soil carbon might mask
the possible amount of mineralised N in the low rates.
However, at higher application of total N (300 kg total N
ha
-1) in the high rate of chicken manure might change the
relation between stabilised pools of soil carbon and N in
favour of the N mineralization process as confirmed by
the results. The net N mineralization of CHH was more
than 50% higher in season 3 when maize was cultivated
after bean, than in season 2, when bean was cultivated
after maize. This might be explained by a higher N
availa-bility after the preceding N2 fixing bean crop (Figure 1),
and is consistent with other studies of legumes in a
crop-ping system (Andersson and Domsch, 1989; Rao et al.,
1994; Fuhrmann et al., 1999). Sanchez et al. (2001)
com-pared a continuous maize mono-cropping system,
fertili-zed with mineral NPK, with a
maize-maize-soybean-wheat crop sequence fertilized with composted manure.
They found that the net N mineralization of the crop
sequence system was 90% higher than that of the
mono-cropped system.
The higher N mineralization of CHH in season 3 might
though also be caused by more favorable soil moisture
conditions during this season. In a related study at the
same site the N fixation per unit of bean biomass was
higher in season 3 than in seasons 2 and 4 (Salmeron et
al., manuscript 4), indicating a more efficient nodule
activity in season 3 which might have been caused by
higher moisture content due to a higher rainfall (about
900 mm compared to about 500 mm in seasons 2 and 4;
Table 1).
Conclusions
The higher net N mineralization of the chicken high
treat-ment (CHH) during seasons 2 – 4 compared to the other
manure treatments and the unfertilized control might be
explained by a higher specific mineralisation rate,
proba-bly related to a higher decomposability and low C/N ratio
of the chicken manure. For the same seasons, the other
fertilization treatments had similar N mineralization to
each other although both N addition rates and types of
manure application differed. All fertilization treatments
had significantly higher net N mineralization than the
con-trol. In the control both net N mineralization and the
specific N mineralisation rate decreased significantly over
time. An indication of priming effect in the season
follo-wing the N fixating bean crop was only found in the CHH
treatment.
REFERENCES
Andersson TH, Domsch KH (1989). Ratios of microbial biomass to total organic carbon in arable soils. Soil Biol. Biochem. 21: 471-479. Ayanaba A, Jenkinson DS (1990). Decomposition of C-14 labeled
rye-grass and maize under tropical conditions. Soil Sci. Soc. Am.J.54: 112-114.
Chander K, Goyal S, Mundra MC, Kappor KK (1997). Organic matter, microbial biomass and enzyme activity of soils under different crop rotations in the tropics. Biol. Fertl. Soils 24: 306-310.
Chapman HD (1965). Cation-Exchange Capacity. In: CA. Black (ed.) Methods of soil analysis Chemical and microbiological properties. Agronomy. 9: 891-901.
Constantinides M, Fownes JH (1994). Nitrogen mineralisation from leaves and litter of tropical plants; relationship to nitrogen lignin and soluble polyphenol concentrations. Soil Biol. Biochem. 26: 49-55. Ehaliotis C, Cadish G, Giller KE (1998). Substrate amendments can
alter microbial dynamics and N availability from maize residues to subsequent crops. Soil Biol. biochem. 30: 1281-1292.
Facelli JM, Pickett STA (1991). Plant litter: Its dynamics and effects on plant community structure. Bot. Rev. 57: 1-32.
Fontaine S, Mariotti A, Abbadie L (2003). The priming effect of organic matter: a question of microbial competitions?. Soil Biol. Biochem. 35: 837-843.
Fu SL, Cheng WX (2002). Rhizosphere priming effects on the decomposition of soil organic matter in C-4 and C-3 grassland soils. Plant and Soil. 238: 289-294.
Fuhrmann S, Neufeldt H, Westerhof R, Ayarza MA, da Silva JE, Zech W (1999). Soil Organic Carbon, Carbohydrates, Amino Sugars, and Potentially Mineralisable Nitrogen under Different Land-Use Systems in Oxysols of Brazilian Cerrados, Sustainable Land Management for Oxisols of the Latin American Savanas in Thomas R, Ayarza MA: CIAT. Colombia., pp. 42-51
Goyal S, Chander K, Mundra MC, Kapoor KK(1999). Influence of in- organic fertilizers and organic amendments on soil organic matter and
soil microbial under tropical conditions. Biol. Fertl. Soils. 29: 196-200. Hamer U, Marschner B (2005). Priming effects in soil after combined
and repeated substrate additions. Geoderma 128: 38-57.
Holland EA, Neff JC, Townsend AR, McKeown B (2000). Uncertainties in the temperature sensitivity of decomposition in tropical and subtropical ecosystem: implications for models. Global Biog. Cycl. 14: 1137-1151
INETER (2004). Instituto Nicaragüense de Estudios Territoriales. Nicaragua. http://www.ineter.gob.ni. Web Page viewed in April, 2007. Jackson ML (1973). Soil chemical analysis, Prentice-Hall, Inc.
Englewood Cliffs, N.J. USA.
Jenssen ES(1994).Dynamic of mature pea residue nitrogen turnover in unplanted soil under field conditions. Soil Biol Biochem26: 255-464.
Kaye JP, Hart SC (1997). Competition for nitrogen between plants and soil microorganisms. Trend Ecol. Evol. 12: 139-143.
Kuzyakov Y, Siniakina SV, Ruehlmann J, Domanski G, Stahr K (2002). Effect of nitrogen fertilisation on below-ground carbon allocation in lettuce. J. Sci. Food Agric. 82: 1432-1441.
Kuzyakov Y, Friedel JK, Stahr K (2000). Review of mechanisms and quantification of priming effects. Soil Biology & Biochemistry. 32: 1485-1498.
Leifeld J, Siebert S, Kögel-Knabner I (2002). Biological activity and organic matter mineralization of soils amended with biowaste composts. J. Plant Nutr. Soil Sci. 165: 151-159.
Mayer J, Buegger F, Jensen ES, Schloter M, He J (2004). Turnover of grain legume N rhizodeposits and effect of rhizodeposition on the turnover of crop residues. Biology and Fertility of Soils 39: 153-164. Mary B, Recous S, Robin D (1998). A model for calculating nitrogen
fluxes in soil using 15N tracing. Soil Biol. Biochem. 30: 1963-1979. Matus FJ, Roddriguez J (1994). A simple model for estimating the
contribution of nitrogen mineralization to the nitrogen supply of crops from stabilized pool of soil organic matter and recent organic input. Plant and Soil 162: 259-271.
McNeill AM, Zhu C, Fillery IRP (1997). Use of in situ 15N labelling to estimate the totral below-ground nitrogen in pasture legumes in intact soil-plant systems. Aust. J. Agric. Res. 48: 295-304.
Mikha MM, Rice CW, Miliken GA (2005). Carbon and nitrogen thesis, Swedish University of Agricultural Science, Uppsala, Sweden. Paterson E, Sim A, Standing D, Dorward M, McDonald AJS (2006). Root exudation from Hordeum vulgare in response to localized nitrate supply. J. of Experimental Botanic 57: 2413.
PROMESA(2002). Proyecto de Mejoramiento de Semilla Catalogo de Semillas. Hibridos y variedades. Managua, Nicaragua.
Raison RJ, Connell MJ, Khana PK (1987). Methodology for studying fluxes of soil mineral N in situ. Soil Biol. Biochem. 19: 521-530. Rao IM, Ayarza MA, Thomas RJ (1994). The used of carbon isotope
ratios to evaluate legume contribution to soil enhancement in tropical pastures. Plant Soil 162: 177-182.
Salmerón-Miranda F, Båth B, Eckersten H, Forkman J, Wivstad M (2007). Aboveground nitrogen in relation to estimated total plant uptake in maize and bean. Nutrient Cycling in Agroecosystems. 79: 125-139.
Sanchez JE, Willson TT, Kizilkaya K, Parker E, Harwood RR (2001). Enhancing the mineralizable N pool through the substrate diversity in ling term cropping systems. Soil Sci. Soc. Am. J. 65: 1442-1247. SAS Institute (2001). SAS/STAT user’s guide Software. Release 8.4.
Cary, NC.
Tiessen H, Sampaio EVSB, Salcedo IH (2001). Organic matter turnover and management in low input agriculture of NE Brazil. Nutr. Cyc. Agroeco. 61: 99-103.
Walkley A (1947). A critical examination of rapid method for determining organic carbon in soils–effects of variations in digestion conditions and of inorganic constituents. Soil Sci. 63: 251- 264.
Wivstad M, Dahlin AS, Grant C (2005). Perspectives on nutrient mana-gement in arable farming systems. Soil Use Manage. 21: 113-121. Weil RR, Magdoff F (2004). Significance of Soil Organic Matter to Soil
Quality and Health, in Magdoof, F., Weil, R. R.: Soil Organic Matter in Sustainable Agriculture. CRS Press, Boca Raton Florida. pp. 243-283.
WRB (1998). World reference base for soil resources. FAO, International Soil Reference and Information Centre, ISRIC, and International Society of Soil Science ISSS. 84 World Soil Resources
Reports. Rome