MOBILE MODELLING FOR CROWDSOURCING BUILDING INTERIOR DATA
J. Rosser*, J. Morley, M. Jackson
Nottingham Geospatial Institute, Triumph Road, University of Nottingham, Nottingham, UK. NG14 5BQ – (psxjr,jeremy.morley,mike.jackson)@nottingham.ac.uk
Commission IV, WG VI/8
KEY WORDS: Indoor mapping, mobile, building modelling, VGI
ABSTRACT:
Indoor spatial data forms an important foundation to many ubiquitous computing applications. It gives context to users operating location-based applications, provides an important source of documentation of buildings and can be of value to computer systems where an understanding of environment is required. Unlike external geographic spaces, no centralised body or agency is charged with collecting or maintaining such information. Widespread deployment of mobile devices provides a potential tool that would allow rapid model capture and update by a building’s users. Here we introduce some of the issues involved in volunteering building interior data and outline a simple mobile tool for capture of indoor models. The nature of indoor data is inherently private; however in-depth analysis of this issue and legal considerations are not discussed in detail here.
* Corresponding author.
1. INTRODUCTION
Digital modelling of buildings is required for a wide variety of purposes. As such, the topic has been approached in different ways from a variety of disciplines. Architecture, engineering and construction (AEC), navigation, positioning, robotics and emergency management are just some of the disciplines and application areas that have a stake in improving the digital capture, update, management and utilisation of building models. The term “building model” refers to digitally encoding useful information on both the geometric structure and the semantics of buildings and includes interior information which is focused upon here.
One motivating application for deriving interior models of environments is their use in different positioning and navigation scenarios. For example, this information is useful to first-responders in emergency situations (Lee, 2007). Locating people and objects with reference to an interior map is not an application restricted to large environments. Explicit spatial modelling of home environments is required if smart buildings and software agents are to understand a user’s context and activity. Indoor spatial models that hybridise geometric and symbolic information offer a promising approach for fulfilling the range of uses required for context-aware applications (Afyouni et al. 2011). 3D building models can also be used for improving Augmented Reality (AR) systems which benefit from provision of a prior initial scene model (Reitmayr & Drummond, 2006; Thomas et al, 2010).
2. CONCEPTUAL DESIGN
2.1 Motivation and setting
Crowdsourcing of data has proved successful within a variety of geospatial applications. The success of OpenStreetMap (OSM)
since its creation in 2004 has demonstrated the feasibility of generating large amounts of geographic data and illustrated individual’s willingness to volunteer time and effort to collaboratively generate a useful dataset. As yet, mapping of interior spaces within OSM is rarely completed, but ongoing research is looking at how this information might be incorporated (Goetz & Zipf, 2011).
Both public and private indoor spaces require digital modelling to fulfil the needs of applications identified in Section 1. Assuming that appropriate management tools for model data can be provided, the users of a building are in many ways the best sources of information about it. They have access to the building’s rooms, know about different levels of accessibility and understand roles fulfilled by particular areas. Putting the user in control of the interior data is a primary motivator for this research and for this we need some form of mobile data capture tool.
2.2 Requirements for crowdsourcing building geometry
For users to supply building information it is important to have a system that simplifies the mapping process and makes use of widely available equipment. However, modelling of indoor environments presents a variety of challenges. Although impressive results of reconstruction and scene understanding are demonstrated through fully-automated techniques (e.g. Snavely et al. 2006; Klein & Murray, 2007; Lee et al. 2009; Furukawa et al. 2009) it is recognized that such approaches are not appropriate to all indoor scenarios. This is usually due to the lack of textures found indoors, high levels of clutter obscuring important geometric features or restrictive computational demand and this limits their potential for wide-scale deployment. To ensure an appropriate method for determination of building geometry, we assume that mapping must be a semi-automated process and used the following requirements to guide implementation. Namely, that the system
International Archives of the Photogrammetry, Remote Sensing and Spatial Information Sciences, Volume XXXVIII-4/C26
operates on common devices; does not require instrumentation of the environment; and works across varying indoor locations.
3. PRELIMINARY IMPLEMENTATION
A preliminary application for capture of building interior data has been implemented using Google Android Version 4.0.2 and tested on the Samsung Galaxy Nexus phone.
3.1 Application details
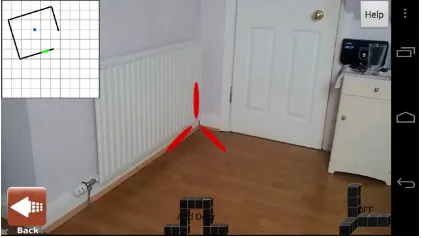
Application users fulfil an interaction similar to capturing a panoramic photograph - considered to be relatively familiar to many potential operators. Standing approximately in the centre of the space, the user directs the device camera at key features found located at ground level, namely floor-wall corners and points along the floor-wall intersection (see Figure 1). As the user rotates, denoting key features, a 2D polygon is constructed.
Figure 1: Depiction of floor-corner points.
For each point denoted by the user, the device orientation (azimuth, pitch and roll) is estimated using the accelerometer, magnetometer and gyroscope sensors. The accelerometer provides a gravity vector and is used to determine device pitch whilst the magnetometer is used to determine azimuth. Device orientation based on accelerometer and magnetometer data is provided within the Android SDK. Integrating the gyroscope rate values can also provide an estimate of device orientation across 3 axes. On their own these sensors can broadly be thought of as being subject to noise, interference and drift. To mitigate this, the orientation is stabilised using a complementary filter (Colton, 2007). This gives higher weight to the gyroscope readings in the short term, whilst increasing the weight of the accelerometer and magnetometer readings values in the long term. Time constants for these weighting coefficients are required, with values of 0.75s and 0.5s for pitch and azimuth respectively found to give good performance. As sensor polling is not completed at a constant rate, coefficients are updated at each time step (equations 1 and 2) and fed to separate filters for estimation of pitch and azimuth (equations 3 and 4). Sensor data is polled at the second fastest rate provided by the Android SDK, about 30Hz for the accelerometer and magnetometers. The fastest rate would in theory give better estimates, however it was found that the polling interval seemed to fluctuate more
where
c
1 = filter coefficient for pitch estimation2
c
= filter coefficient for azimuth estimation0
θ
,α
filtered= updated estimates dT = time since last reading
Two-dimensional coordinates of points with respect to the device are then estimated using trigonometry, assuming a fixed, user-selected, device height across all points. During the capture process the user is able to estimate room height. This is achieved through collection of z-values for corresponding ceiling-level and floor-level points from which the room height can be estimated, again using trigonometry.
)
where h = user-selected device height x, y = point coordinates relative device z = height of ceiling point
θ
= filtered device pitchα
= filtered device azimuthA point submission also triggers the capture of a photograph for association with the location. Finally, the model is geographically located by the user with translation and rotation actions against the Google Maps imagery layer.
This simple modelling approach contains a variety of sources of error based on several key assumptions: an accurate height measurement for the device, an unobstructed view of key features, a single-level floor and ceiling and a reasonably accurate orientation estimate. Furthermore, relying on the user accurately marking features via the camera preview means that positional accuracy will degrade with larger distances – slight hand movements result in large displacements. These issues contribute to irregularities apparent in the resultant 2D polygon. To compensate for this we assume the room conforms to a Manhattan-world assumption where all key points are orthogonal to or parallel with each other. This assumption is enforced by fitting a 2D polygon based on constrained least-squares.
3.2 Example model capture, results and discussion
An example model of an L-shape type room has been produced to illustrate the process and typical accuracy. Seven ground-level and one ceiling height point were collected. The device
International Archives of the Photogrammetry, Remote Sensing and Spatial Information Sciences, Volume XXXVIII-4/C26
height was measured to 1.6m to ensure accurate scale. But as the tool relies on a user-selected device height some understanding of how error in this value changes scale of a typical room model was thought to be important. Thus, the same point set was used to estimate areas using device heights of +0.2m and -0.2m of the actual value. To illustrate this and the level of correction applied by constrained model fitting, the estimated area of the 2D polygon versus actual (ground-truth) area (measured as 12.25m2) is presented in Table 1.
Height h
(metres)
Room Area (all values in m2)
Uncorrected Corrected
Corrected – Actual (12.25)
1.8 15.23 15.10 2.85
1.6 (actual height) 12.03 11.93 -0.32
1.4 9.21 9.13 -3.11
Table 1. Areal estimates for uncorrected and corrected areas.
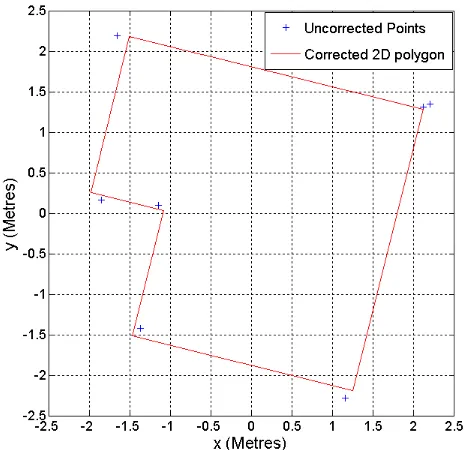
It is clear that if accurate device heights are used then a high level of real-world scale can be achieved. The estimated area differs from the ground-truth by just 0.32m2. Figure 2 shows both estimated feature locations together with the corrected floor-plan polygon.
Ceiling height was estimated at 2.21m, and measured to be 2.3m. Usually, the height will be underestimated due to the arc of hand movement when pointing the device at a ceiling corner. Visualisation of KML polygon in Google Earth is possible, although height values are restricted to integer values (see Figure 3).
Figure 2. Estimated and corrected feature points (top-down perspective)
Work is ongoing to finalise the application for user testing. Texturing of the model with captured imagery is planned. Also, of importance is the facility to capture non-Manhattan-world environments.
Figure 3. Example extruded KML model, 3m height. Base Map Source: InfoTerra Ltd & Bluesky 2011.
4. CONCLUDING REMARKS
This paper presented an overview of volunteering building information and a preliminary data capture application for determining simple room geometry.
Conflation of these models with existing map data, such as building outlines, will be required to maintain accuracy. This will likely be required if such data is to be integrated into modelling standards such as CityGML LoD 4, with its positional accuracy of 0.2m (Gröger, et al. 2008). Users may want to model spaces where there are few existing geographic features to refer to. We envisage employment of a rule-based engine to help optimise and enforce constraints, also leaving the possibility of sourcing data from other methods. Buildings are not static entities and their components may change over time. Therefore, consideration of the infrastructure requirements for the combining and editing of these models is needed and will form an important part of further work.
4.1 Acknowledgements
The first author is supported by the Horizon Doctoral Training Centre at the University of Nottingham (RCUK Grant No. EP/G037574/1) and by the RCUK’s Horizon Digital Economy Research Institute (RCUK Grant No. EP/G065802/1).
REFERENCES
Afyouni, I., Ray, C. & Claramunt, C., 2011. Spatial Models for Indoor & Context-Aware Navigation Systems?: A Survey. Journal of Spatial Information Science.
Colton, S. 2007. The Balance Filter, A Simple Solution for Integrating Accelerometer and Gyroscope Measurements for a Balancing Platform; Chief Delphi white paper.
http://web.mit.edu/scolton/www/filter.pdf (27th March 2012)
Furukawa,Y, Curless, B, Seitz, S., Szeliskim, R. 2009. Reconstructing Building Interiors from Images. ICCV.
International Archives of the Photogrammetry, Remote Sensing and Spatial Information Sciences, Volume XXXVIII-4/C26
Goetz M., Zipf, A. 2011. Extending OpenStreetMap to Indoor Environments: Bringing Volunteered Geographic Information to the Next Level In: Rumor, M., Zlatanova, S., LeDoux, H. (eds.) Urban and Regional Data Management: UDMS Annual 2011: Delft, The Netherlands. p. 47-58.
Gröger, G., Kolbe, T., Cyerwinski, A., Nagel, C (2008). OpenGIS® City Geography Markup Language (CityGML) Encoding Standard. Open Geospatial Consortium Inc. Version 1.0.0
Klein G., and Murray, D. 2007. Parallel Tracking and Mapping for Small AR Workspaces, In 6th IEEE and ACM International Symposium on Mixed and Augmented Reality, IEEE, 1-10.
Lee, D.C., Hebert, M. & Kanade, T., 2009. Geometric reasoning for single image structure recovery. IEEE Conference on Computer Vision and Pattern Recognition, pp.2136-2143.
Lee, J. 2007. A Three-Dimensional Navigable Data Model to Support Emergency Response in Microspatial Built-Environments. Annals of the Association of American Geographers Vol. 97, Iss. 3.
Reitmayr, G. & Drummond, T., 2006. Going out: robust model-based tracking for outdoor augmented reality. IEEE/ACM International Symposium on Mixed and Augmented Reality, pp.109-118.
Snavely, N., Seitz, S., Szeliski, R. 2006. Photo tourism: Exploring photo collections in 3D. ACM Transactions on Graphics, 25(3), 835-846.
Thomas, V., Daniel, S., and Pouliot, J. 2010. 3d Modeling for Augmented Reality in Unprepared Environment. In 5th 3D GeoInfo Conference, Berlin, Lecture Notes in Geoinformation and Cartography.
International Archives of the Photogrammetry, Remote Sensing and Spatial Information Sciences, Volume XXXVIII-4/C26