INSAT-3D QUALITY ANALYSIS SYSTEM (i3dQAS)
Deepika Jindal*, Shilpa Prakash*, Jaimin Sanghvia, B. Kartikeyan*, B. Gopala Krishna*
*Image Analysis and Quality Evaluation Division, SPDCG, SIPA, SAC, ISRO, Satellite, Ahmedabad-380 015, Gujarat, India *(deepika, pshilpa, bkartik, bgk)@sac.isro.gov.in
a
Globaltech (I) Pvt. Ltd., Bodakdev, Ahmedabad-380 054, Gujarat, India – [email protected]
KEY WORDS: DQE, Geometric accuracy, Radiometric Quality, Payload health, Level-0, i3dQAS, Quality Database
ABSTRACT:
INSAT-3D, an advanced meteorological satellite of ISRO carrying Imager and Sounder payloads is designed for acquiring data required for detailed climatological applications. At established data centres, Raw (L-0) data is processed to generate systematically corrected (Level-1) and geo-physical (Level-2) products which are further disseminated for use in climate related studies. Data quality evaluation (DQE) of basic data products of INSAT-3D is being operationally carried out at MOSDAC, Ahmedabad to monitor in-orbit sensor health, quantify data quality and provide feedback to various missions teams for corrective actions. DQE methodology and quality parameters have been defined keeping in view repeatability of data acquisition and quality requirements of meteorological data. In this paper, we have described INSAT-3D Quality Analysis System (i3dQAS) designed to facilitate effective data quality monitoring through web based portal. Overall context of i3dQAS in a typical data centre set-up, major objectives and design aspects to highlight the architectural and functional view of system are described. Utility of i3dQAS for mission monitoring is described through analysis scenarios for monitoring payload health and geometric accuracy of Imager.
1. INTRODUCTION
INSAT-3D, an advanced geostationary meteorological satellite of ISRO carrying Imager and Sounder payloads acquires repetitive images of India and its environs in visible and infra-red (IR) channels for climatological studies and applications. At ground stations established at Indian Meteorological Department (IMD) Delhi and MOSDAC Ahmedabad, RAW (Level-0) data acquired by satellite is systematically processed to generate geometrically corrected, radiometrically calibrated Level-1 data products which are further used for generation of geo-physical (Level-2) products such as Sea Surface Temperature, Upper Tropospheric Humidity etc for climate studies.
Data quality evaluation (DQE) is an important ground segment activity carried out to ensure quality of basic data products (Level-0 and Level-1) which in turn affect the quality of geo-physical parameters. Purpose of quality monitoring is firstly, to monitor in-orbit sensor health by means of validation of telemetry/raw (Level-0) data and secondly to derive radiometric and geometric accuracy parameters from Level-1 data products. With this objective, DQE system is operationalised at MOSDAC, where evaluation of basic data products of Imager and Sounder is carried out regularly by using in-house developed DQE software. DQE parameters for INSAT-3D have been arrived at keeping in view repeatability of data acquisition and quality requirements of meteorological missions.
Output of DQE activity is large amount of quality data, which captures temporal trends of system behaviour. It is very important to organize this data, develop techniques for detection of system malfunction or anomaly, develop tools for quality trend analysis and facilitate mission monitoring. In this paper, INSAT-3D Quality Analysis System (i3dQAS), a web portal for data quality monitoring is described. Objective of
i3dQAS is to systematically archive quality parameters generated through operational DQE procedure, allow registered users - analysts from various mission teams - to access quality information through browser, enable users to study temporal behaviour of the system, visualize and store results in form of graphical plots/reports and aid in detection of system malfunction or anomaly.
This paper is organised as follows - Section 2 describes the overall context of i3dQAS in data centre set-up. In this section, list of DQE parameters, their significance and operational evaluation scenario is briefly described. In Section 3, objective of i3dQAS, design aspects – Architectural design, Database design, Front-end design and implementation view is described. Section 4 describes two mission analysis scenarios using i3dQAS. Here, payload (Imager) health monitoring and geometric accuracy analysis for Level-1 Imager products is described.
2. SYSTEM CONTEXT OF i3dQAS
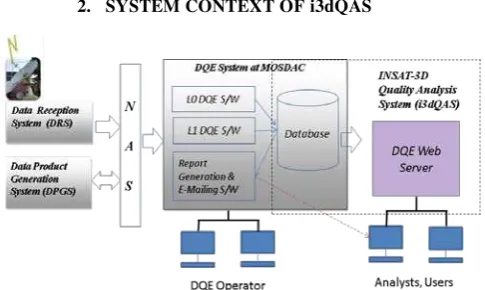
Figure 1. System Context of i3dQAS in a typical data-centre set-up
In Figure 1 overview of the DQE system set-up at MOSDAC The International Archives of the Photogrammetry, Remote Sensing and Spatial Information Sciences, Volume XL-8, 2014
data centre is shown. Raw data is received by Data reception system and formatted Level-0 products are copied to common storage (NAS). Data product generation system (DPGS) accesses the raw data, applies correction algorithms to generate Level-1 products and further geo-physical parameter retrieval algorithms for Level-2 data product generation. Level-1 & 2 products are further disseminated to users. For DQE, Level-0 and Level-1 data products form primary input for purpose of operational evaluation.
Sensors on-board INSAT-3D have been specially designed to achieve 24x7 imaging in IR/Visible channels from geo-stationary platform and meet accuracy requirements. Some of the typical features are – Use of servo controlled scan-mirror to achieve 18degx18deg earth coverage, bi-annual yaw-flip, use of cooled detectors for IR channels, in-orbit calibration of IR channels by viewing black-body source and motion compensation to account for short/long term attitude disturbances due to scan mechanism and external factors (eg. solar radiation pressure) affecting station-keeping.
To study quality aspects related to in-orbit payload health, platform stability and final quality of data products, a two-level approach (Charles Elaichi, 2006 and George Joseph, 2005) is formulated, in which evaluation is carried out with unprocessed (Level-0) as well as systematically corrected (Level-1) data. Scene-wise DQE parameters identified for both these levels are listed in Table-1.
Product Table -1. DQE Parameters for Imager & Sounder
A new concept of L-0 DQE is introduced wherein telemetry and calibration records contained in raw data are analysed to derive statistics on sub-system temperatures (eg. black-body, electro-optical module, cooler patch), instrument servo errors and in-orbit calibration coefficients. L-0 DQE parameters are computed automatically for all acquisitions and validated with expected operating ranges.
From Level-1 products, quality parameters are estimated by using mathematical/image analysis techniques (Rafael C.
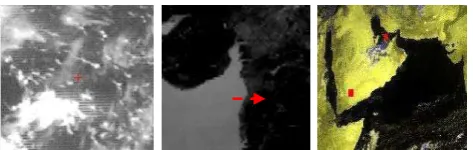
Gonzalez , 2009) and validated with qualified references. To estimate geometric accuracy, prominent features (eg. Land-sea boundary) are identified as ground control points (GCPs) over target and reference image. Reference images give precise geo-location of identified features, they are generated using downsampled IRS-AWIFS data. Using ground coordinates of co-located point pairs on target and reference, geo-location error, internal distortion, scale and residual platform attitude are estimated. Four-to-six passes of L-1 data are evaluated by DQE operator everyday to estimate geometric quality at day and night time. Mis-registration within channels of a scene (Band-to-Band) and between feature positions of successive half-hourly images (Image-to-Image) is estimated on monthly basis. Typical layout of GCPs on Level-1 product of Imager and effects of high geo-location error are shown in Figure 2(a,b).
Figure 2 (a) Figure 2(b) Figure 2(c)
Figure 2. Geometric quality for Imager: a) GCP Layout, b) Effect of Geo-location Error, c) Feature breaks at boundaries due to Servo Error
Due to opto-mechanical scanning by payload facilitated servo motor, servo error effect is observed in image. Residual servo effect after correction is seen as feature breaks (Figure 2(c)). For radiometric evaluation, overall visual quality of scene such as edge sharpness, scene contrast and residual striping (Figure 3 a, b) due to detector non-uniformity are estimated. Uniform targets (desert/sea) are identified (Figure 3 c) for which spectral profile, radiance/brightness temperature are computed and validated with radiometric references. Target signal-to-noise ratio (SNR) and signal-to-noise equivalent differential temperature (NEdT) are also periodically monitored to study seasonal variations.
Figure 3. Radiometric Quality for Imager a) Striping effect, b) Edge considered for estimating sharpness, c) Radiometric targets identified in Desert & Sea
DQE reports are circulated to various mission teams as feedback on daily basis. However, it is required to systematically archive the quality information during various phases of mission such as in-orbit testing, initial phase, post-commissioning operational phase and also provide easy access to various mission teams to conduct in-depth quality analysis. For this purpose, web based quality analysis system is developed to enable users/analysts to access quality information from their desktops and facilitate long-term mission monitoring. In the next section, major functionalities detailed design of i3dQAS are described.
Knowledge Layer
Generation of Quality Trends,
Summary Statistics, Identify Anomaly
H
T
T
P
J
D
B
C
Information Layer
INSAT-3D Quality Database
Presentation Layer
User profile management, Browser
interface for Query, Visualization of
Plots/Reports
3. i3dQAS – FUNCTIONALITY & DETAILED DESIGN
Major functions of i3dQAS are as follows:
1)To systematically archive quality data generated through operational evaluation of INSAT-3D products
2)To allow users to register with portal and access INSAT-3D quality database through browser
3)Facilitate user to carry out temporal analysis to study system performance and data product accuracy
a. To enable users to carry out analysis of payload health parameters extracted from Level-0 data b. To enable users to analyse geometric and radiometric
accuracy of Level-1 data products
c. To enable dynamic querying of quality database and display results in form of graphical charts, tables and plots in browser
d. To identify anomalies and perform traceability analysis
4)To facilitate generation of daily, monthly and customized quality reports in standard formats such as PDF.
3.1 Architectural View
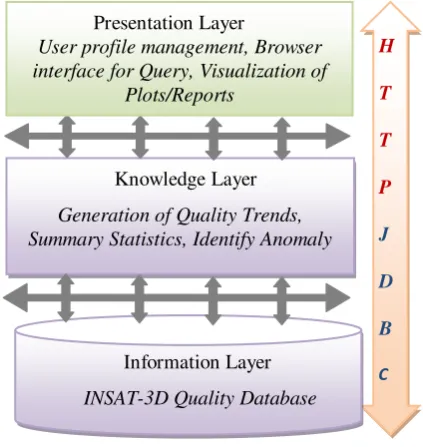
Based on detailed requirement analysis, multi-layered architecture is designed for i3dQAS as shown in Figure 4.
Quality database forms the information (base) layer of the system where DQE parameters derived from regular evaluations are archived along with ancillary information. Knowledge layer responds to queries from the presentation layer by interacting with information layer to generate specific quality trends for user-defined duration. It also contains logic to generate summary statistics, validate values with specifications and identify anomalies if any.
Figure 4. i3dQAS: Architectural View
Presentation layer is the top-most layer which provides browser interface for user profile management, web pages for quality analysis with controls to generate queries and visualize results in form of graphical plots and charts. Communication between the layers is carried out using standard protocols for web and database connectivity.
3.2 Quality Database Design
The database is organized in form of POSTGRES tables to archive ancillary and quality information generated through DQE operations. There is one master table for archival of ancillary information to uniquely identify each evaluation and eight tables for storage of DQE activity specific quality statistics (Table-1) as shown in Figure 5. Contents of each table are described as follows:
A) Master Table – It stores ancillary information such as satellite ID, sensor name, date/time of pass, level of processing and DQE activity. A unique acquisition ID is generated for each evaluation which is used as foreign key to access quality records of eight quality tables. B) Level-0 Quality Tables-There are four tables to store Level-0 quality for Imager & Sounder. Two tables are designed to store temperature statistics of on-board sub-systems like black-body, electro-optical module, mirror, cooling patch. Other two tables store channel/detector-wise calibration counts & coefficients computed from warm (black-body) and cold (space-look) counts C) Level-1 Geometric Quality Tables-Three tables are designed to store geometric quality statistics corresponding to geo-location error(GLOC), Band-to-Band registration (BBR), Image-to-Image registration (IIR), residual servo (GSER) and residual stagger (GSTR). These parameters are separately archived for different channels. D) Level-1 Radiometric Quality Table – In this table results of radiometric DQE (RDQE) are stored. Scene-wise and target specific radiometric quality statistics as described in Table-1 are stored in RDQE table.
Figure 5. Quality tables for INSAT-3D
Presently, L-0 quality database is populated with half hourly acquisitions of Imager (~48 per day) and one hourly acquisitions of Sounder (~24 per day). Level-1 evaluations are done on a sampling basis defined as per DQE operational plan, where daily and monthly activities are defined.
After launch, there are In-orbit testing (IOT) and other The International Archives of the Photogrammetry, Remote Sensing and Spatial Information Sciences, Volume XL-8, 2014
campaigns like pre/post yaw flip testing when parameters related to platform attitude, stability and geometric calibration of sensor (channel registration, alignment angles) are required to be estimated from data products.
During campaign mode & IOT phase, a closed loop exercise is conducted, in which derived DQE parameters are provided as feedback to payload and data product teams for fine-tuning the processing configuration. Typically 12 to 48 GLOC evaluations and 6 BBR/IIR/RDQE evaluations are performed per day in this mode at different acquisition times. After initial phase tuning, during normal phase of operations, up-to six passes are evaluated on daily basis to provide feedback on consistency of geometric quality. In normal phase, BBR/IIR/RDQE estimation is carried out monthly.
3.3 Front-end Design
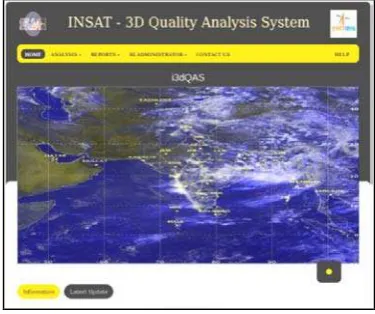
Snapshot of main page of the portal is shown in Figure. 6. From the main page there are links for user login, Level-0, Level-1 quality analysis and Report generation. Other information such as mission news updates can also be viewed by user.
Figure 6. Front end of i3dQAS-Home page
There are two types of users – registered users and visitors. Users can register with portal through GUI provided by filling in relevant credential information, email-id and password. Registered users can login to the portal, access all functionalities of portal and query quality database. Users can also view/edit their profile and send feedback to administrator in form of email. Non-registered users (visitors) can have access to limited functionalities such as information updates and news that are provided on home page. All the information related to user is stored in a separate user profile database.
3.3.1 Analysis Page: Layout of Level-1 analysis page is shown in Figure. 7. It is divided into two main panels, top-panel for selection of fields for user-query and mid-top-panel for display of results in the form of time/date-wise plot. Help on query fields/controls is provided through FAQ tool tips.
In the query panel, controls for selection of sensor, range of dates of pass (start and end date), acquisition time (start and end time) and selection lists for DQE parameter are provided.
When user clicks on date selection field, a color-coded calendar appears. In the calendar, result availability in quality
database for selected month/year is shown with different colors. By browsing through calendar, user can short-list range of dates for analysis. Single-date (one day), or multiple dates (months) can be selected for analysis.
Available times of evaluations are dynamically generated for user query and added to start/end time of pass lists. From the available list, user can select single or range of time-of-pass for analysis.
List of DQE parameters appear as check-boxes in the parameter list. User can select single or multiple parameters for each plot. Selection of up to three parameters is supported. According to selection, single or multiple parameters can be overlaid in the result panel with line or scatter plotting styles. Title and legend of plotted data series is also shown in plot area. Plot can be saved as a picture file (JPEG/PNG formats) through browser.
Figure 7. Layout of Level-1 Analysis Page
3.3.2 Reports Page: This page supports generation of daily, monthly or customized dynamic PDF reports as per pre-designed report templates. Layout of Level-1 report page is shown in Figure 8.
From the controls provided, user can select sensor, date of acquisition and type of report. For each type of report, DQE parameters and types of plots (eg. single date, multiple time, scatter/line etc) are pre-defined in report layout. For selected combination, a dynamic report is generated with ancillary, quality and summary statistics information in form of tables, plots and bar or pie charts.
Figure 8. Layout of Level-1 Report Generation Page The International Archives of the Photogrammetry, Remote Sensing and Spatial Information Sciences, Volume XL-8, 2014
3.3.3 Implementation View: i3dQAS is realized through different packages having specific functionalities. Implementation view (package diagram) in shown in Figure 9.
Web or Presentation Layer is made up of packages for creation of web-pages for portal, supporting user interactions through browser and visualization of quality information in browser. In this layer, implementation is carried out using web-technologies and programming languages such as – Hyper Text Markup Language (HTML), Cascade Style Sheet (CSS), JavaScript and Java Server Pages (JSP) (KOGENT Learning Solution INC., 2013).
Knowledge Layer includes Java packages (Herbert Schildt, 2006) for generation of queries for user requests, validation of results and generation of dynamic plots and reports. Application Servlet package includes Structured Query Language (SQL) package for generation of dynamic queries and Asynchronous JavaScript and XML (AJAX) (KOGENT Learning Solution INC., 2013 and Santoshkumar K, 2008) to display plots on the web page without refreshing the page to reduce the user request response time. Functional Servlet package includes Java classes to generate single/multi series plots and scatter charts. Dynamic Jasper Reports – an open source java reporting tool is used to generate reports in customised formats.
Information Layer contains packages that interact with quality database and user profile database. It contains Data Access and Data Source packages implemented using JavaBeans to perform low-level operations such as connecting to database, fetching and inserting records in specific database tables. It also contains configuration packages (Java Database Connectivity- JDBC) to set-up database connectivity code
Cross cutting Layer contains common functionalities that spans layers. It contains packages for encryption /decryption for user password and operations like registration, login, logout, user history and user approval.
Figure 9. Package Diagram of i3dQAS
4. ANALYSIS SCENARIOS
In this section, usage of i3dQAS for purpose of payload health and geometric accuracy monitoring for Imager is described.
4.1 Payload health monitoring through i3dQAS
All the sub-systems of payload are designed to operate in pre-defined operating temperature range. If the values are exceeding limits, it can have effect on radiometric or geometric quality of image. For example, anomaly may be seen as noise, loss of sharpness, calibration in-accuracy, channel mis-registration or scan mechanism errors. Therefore, it is required to monitor the above values on daily/monthly basis and take corrective actions if required.
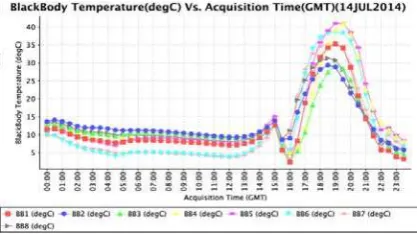
Figure 10 (a) shows diurnal variation in mean temperature of on-board black-body (14th July 2014), generated through Level-1 analysis page of i3dQAS. Here temperature measurements by eight thermistors (PRTs) are overlaid.
Figure 10 (a). Diurnal blackbody temperature variation
Figure 10 (b). Diurnal variation of Calibration slope of TIR-1 channel of Imager
A large temperature gradient is observed during 16:00 hrs to 22:00 hrs, due to in-orbit conditions. Similar trend in calibration slope estimated for TIR-1 channel of Imager is shown in Figure 10 (b).
User can analyse on-board sub-system temperatures and related statistics generated from analog telemetry for Imager and Sounder. Along with scene-wise mean temperature of each of all sub-systems, variability (standard deviation), minimum and maximum values for each scene are also archived. Most frequently occurring temperature count (mode) and number of deviations observed are recorded per sub-system/scene. The International Archives of the Photogrammetry, Remote Sensing and Spatial Information Sciences, Volume XL-8, 2014
Figure 11 (a). Monthly profile of black-body temperature
Figure 11 (a) shows profile of mean temperature of black-body for month of July. Color-coded monthly report of sub-system temperatures for August is shown in Figure 11 (b). Maximum temperature values with date and time of occurance are shown in tabular format. Green color indicates mean values are in valid operating range.
Figure 11 (b). Monthly onboard temperature statistics as color-coded table
4.2 Geometric Accuracy monitoring through i3dQAS
Figure 12 shows diurnal variation of geo-location error computed on two-hourly products of Imager for 1st March and 14th July 2014. These dates are selected to compare system behavior pre and post yaw-flip of the satellite.
Comparison of day and night time navigation accuracy for duration April-June 2014 is shown in tables 2 and 3. Geo-location error (RMS) in both directions (North-South and East-West) computed on Imager products for time duration between 00:00 hrs to 12:00 hrs is shown in Table-2. It can be seen that more than 97% of products have accuracy better than 5 IR pixels during day time, out of which 36% are having RMS error less than 2.5 IR pixels. Table 3 shows the statistics of night time navigation accuracy (12:30 hrs to 23:30 hrs). Here about 90% products are found to have RMS error less than 5 IR pixels.
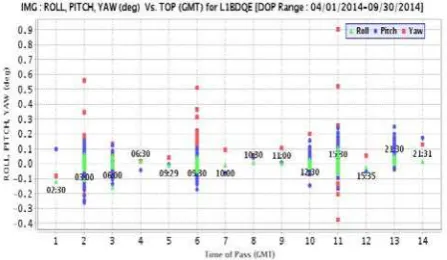
Uncertainty in platform attitude is seen as geo-location error in the processed products. During DQE evaluation, platform attitude is estimated from Imager products by using identified GCPs. Figure 13 shows a plot of estimated roll, pitch and yaw residuals for duration of April-September 2014 at different times of acquisition. Roll and Pitch uncertainty is found to vary between +/-0.1 deg and +/- 0.25 deg respectively. Yaw uncertainty is found to be vary in +/- 0.2 deg range, except for 3:00, 9:30 and 15:30 hours where high residuals (upto 0.6 deg) are observed.
Figure 12 (a). Diurnal variation of mean Geo-location error in terms of IR pixels (Along direction – Difference in Latitude) for Imager products
Figure 12 (b). Diurnal variation of mean Geo-location error in terms of IR pixels (Across direction – Difference in Longitude) for Imager products
Table 2. Geo-location error (RMS) statistics for day
Table 3. Geo-location error (RMS) statistics for night
Figure 13. Platform attitude for duration April-September Location Error:
RMS (IR Pixels)
Location Error N-S (%)
Location Error E-W(%)
<1.25 13.69 1.36
<2.5 68.49 35.61
<5.0 15.06 61.64
>5.0 2.73 1.36
Total Samples - 73
Location Error: RMS (IR Pixels)
Location Error N-S (%)
Location Error E-W(%)
<1.25 13.41 3.65
<2.5 47.56 34.14
<5.0 32.92 52.43
>5.0 6.097 9.75
Total Samples – 82
In Figure 14, GCP based geo-location error (RMS, circular) estimated from Level-1 Sounder products generated during April to September is shown in form of pie-chart. It can be seen that approximately 70% of products have location accuracy better than 5 pixels during day time (upto 12:00hrs)
Figure 14. Geo-location error (RMS) in pixels for Level-1 Sounder products during day-time for April-Sept 2014 (Total Samples-144)
5. CONCLUSION AND FUTURE WORK
Web based portal - i3dQAS designed for quality monitoring of INSAT-3D is described here. Two-level quality evaluation approach for analysis of Level-0 and Level-1 data and specific quality parameters suitable for meteorological imagery are discussed. Functional requirements, Architectural overview, Quality database design and Browser based interface of i3dQAS is described. Brief description of tools and technologies used for implementation of portal is provided. The utility of portal for monitoring payload health and geometric accuracy of Imager is described. Different types of plots, summary tables and color-coded reports for visualization of temporal trends of quality and identification of anomaly are described. In future, it is planned to enhance the functional capability to automatically detect anomaly and raise alarms. It is also planned to extend the system for quality analysis of up-coming meteorological missions such as INSAT-3DR.
ACKNOWLEDGEMENTS
Authors are grateful to Shri. A. S Kiran Kumar, Director, Space Applications Centre (SAC), Ahmedabad, for taking continued interest in DQE activity. Authors thank Shri. Santanu Chowdhury, Deputy Director, SIPA/SAC for providing motivation and guidance to carry out this work. Special thanks are due to Dr. R. Ramakrishnan, Project Director IMDPS and Dr. Nitant Dube MSDPD/DPSG/SAC for useful discussions and extensive support. Support received from all members of Image Analysis and Quality Evaluation Division (IAQD) is gratefully acknowledged.
REFERENCES
1. Charles Elachi, Jakob Van Zyl, 2006. Introduction to the
Physics and Techniques of Remote Sensing. 2nd ed., Jin
Au Kong, John Wiley & Sons.
2. George Joseph, 2005. Fundamentals of Remote Sensing, Universities Press.
3. Herbert Schildt, 2006. The Complete Reference, Java, Seventh Edition.
4. KOGENT Learning Solution INC., 2013. AJAX Black Book, Dreamtech Publication.
5. KOGENT Learning Solution INC., 2013. Web
Technologies Black Book, Dreamtech Publication.
6. Rafael C. Gonzalez, Richard E. Woods, 2009. Digital
Image Processing. Pearson Education Asia.
7. Santoshkumar K, 2008. JDBC, Servlet and JSP Black
Book, New Edition, Dreamtech Publication.