Effects of reduced tillage and liming on microbial activity and soil
properties in a weakly-structured soil
Maria Stenberg
a,∗, Bo Stenberg
b, Tomas Rydberg
aaDepartment of Soil Sciences, Swedish University of Agricultural Sciences, P.O. Box 7014, SE-750 07 Uppsala, Sweden bDepartment of Microbiology, Swedish University of Agricultural Sciences, P.O. Box 7025, SE-750 07 Uppsala, Sweden
Received 1 October 1998; received in revised form 6 January 2000; accepted 14 January 2000
Abstract
The effects of reduced tillage and lime on crop yield and soil physical and microbial properties were studied in a weakly-structured silty clay loam soil. Two autumn primary tillage practices were compared, mouldboard ploughing to 20–25 cm and cultivation to 12 cm. Seedbed preparation was carried out by several harrowing operations in the mouldboard ploughed treatment, and with a PTO-driven harrow in the same operation as sowing in the shallow cultivation treatment. The tillage treatments were applied alone or were combined with liming aimed at soil structural improvement. Lime was added as 6.5 Mg CaO ha−1before the start of the experiment and mixed into the top 12 cm of soil with a disc cultivator. A 4-year
crop rotation was used: spring barley, spring oilseed rape, spring/winter wheat and oats, and all crops were compared each year. Crop residues were retained in the experiment and incorporated at cultivation. Aggregate stability was improved by the shallower tillage depth, probably as an effect of an increase in soil organic matter and a more active microbial biomass. Liming had little effect on soil structure variables but increased microbial activity to some extent. This was reflected in higher crop yields, especially when the shallow tillage depth was combined with liming. Penetration resistance in the seedbed subsoil was highest when mouldboard ploughing was carried out in plots without liming. Data were examined with principal component analyses, and the structures in the data were presented as scores and loading plots, which revealed groupings between samples and relationships between variables, respectively. © 2000 Elsevier Science B.V. All rights reserved.
Keywords:Aggregate stability; Mouldboard ploughing; Reduced tillage; Soil microbial activity; Cereal–oil seed rotation; PCA; Penetration resistance
1. Introduction
To maintain and improve good soil structure, the activity of soil organisms is crucial. The organisms form humus and particle aggregates and may improve soil aeration. Filamentous fungi, and actinomycetes in particular, entrap soil particles to form aggregates (Gupta and Germida, 1988; Dorioz et al., 1993). In
ad-∗Corresponding author. Tel.:+46-18-67-12-13; fax:+46-18-67-27-95.
E-mail address:[email protected] (M. Stenberg)
dition, extracellular metabolites, e.g. polysaccharides, lipids and proteins from microbial degradation of plant residues and soil humus, function as gums and ce-menting agents, which stabilize the aggregates (Tisdall and Oades, 1982; Dorioz et al., 1993; Tisdall, 1994). Furthermore, the importance of soil organic carbon content for soil structural stability has been shown in several reports (e.g. Tisdall and Oades, 1982; Chaney and Swift, 1984). On weakly structured clay soils, hardening of the surface soil soon after sowing is often detrimental for crop establishment in spring (Stenberg et al., 1995). Generally these soils are also susceptible
to slaking of the soil surface after precipitation, which may promote excessive water losses through evapora-tion.
In an Australian soil, the tendency to hardset was inversely related to the soil organic carbon content (Chan, 1995). The input of fresh organic residues is especially important for the production of aggregat-ing substances (Burns and Davies, 1986). Other man-agement practices, which have a stimulating effect on the microorganisms, may have a similar outcome. Im-provement of the pH by liming is one such practice (Balloni and Favilli, 1987).
Agricultural crop production in Sweden largely oc-curs on clay soils. These soils often have a favourable soil structure, deliver sufficient amounts of important plant nutrients and provide sufficient moisture if man-aged properly. However, clay soils with a high silt content have properties which often cause soil struc-ture problems such as surface crust formation at plant establishment. In a laboratory experiment, addition of
lime as CaO or Ca(OH)2 increased aggregation and
aggregate stability of clay soils (Berglund, 1971). In the field, improvements in soil structural stability of a clay soil may be sustained 8 years after application of
lime in the form of CaO or Ca(OH)2 (Ledin, 1981).
Adding CaO or cement (64.4% (w/w) CaCo3as CaO)
to a clay soil resulted in stabilization of soil against compaction, shrinkage and swelling. The addition of cement or gypsum (CaSO4) to a sandy loam (12% clay) also stabilized the aggregates (Shanmuganathan and Oades, 1983).
In this investigation, the effects of reduced tillage and lime were evaluated in a weakly-structured silty clay loam soil. Crop yields and soil physical and mi-crobial properties, characterizing the structure and fer-tility of this soil, were measured to evaluate the effects of soil management improvements.
2. Materials and methods
2.1. Experimental site and treatments
The experiment was started in autumn 1987 at Sundby in central Sweden (59◦42′N, 16◦40′E, altitude 30 m). The silty clay loam soil (Table 1) had previ-ously been subjected to annual autumn mouldboard ploughing to 20–25 cm depth. The soil was a
Cam-Table 1
Soil particle size distribution and organic matter content (g kg−1)
at Sundby
Depth (cm) Particle size (mm) Organic matter
<2 2–20 20–200 200–2000
0–20 392 320 258 31 25
40–60 554 272 161 13 –
bisol (FAO) of postglacial origin. Soil water content in the plough layer at a matric tension of 1.5 MPa was
136 g kg−1. Mean annual precipitation in the area in
1961–1990 was 578 mm and mean annual temperature
(not measured) was estimated at 5.5◦C from nearby
meteorological data (Västerås and Sala Meteorologi-cal Stations; Alexandersson et al., 1991). The growing season usually extends from late April to October.
When used for cereal and oil seed crop production, this soil is prone to slaking and crust formation. The experiment was started to evaluate the effect on soil properties of different management practices, such as addition of lime, tillage practices, nitrogen fertiliza-tion level and crop rotafertiliza-tion. The crop rotafertiliza-tion was spring/winter wheat–spring oats–spring barley–spring oilseed or peas. The experiment was divided into four sub-experiments with the full crop rotation running in each sub-experiment in such a way that all four crops were grown each year on the experimental site. All tillage, liming and nitrogen treatments were stud-ied in each crop but without replication. Tillage and liming treatments were systematically placed between
sub-experiments. The plot size was 12 m×22.5 m.
The measurements in this study were limited to two soil tillage systems (P and S) in plots with (WL:
6.5 Mg CaO ha−1) or without (NL: no CaO) addition
of lime at the start of the experiment and with normal nitrogen fertilizer amounts:
1. (P) Primary tillage: autumn stubble cultivation once (12 cm depth) and autumn mouldboard ploughing (20–25 cm depth) Secondary tillage: three harrow-ings (4–5 cm depth with a spring-tine harrow) as seedbed preparation and separate sowing.
2. (S) Primary tillage: stubble cultivation three times (12 cm depth) in autumn. Secondary tillage: seedbed preparation (4–5 cm with PTO driven harrow) and sowing in one operation.
calcium oxide (CaO) ha−1 was added to WL plots and mixed into the soil with a disc cultivator to 12 cm depth. Annual stubble cultivation was carried out once soon after harvest in all plots, then two more times in S, the last one soon before ploughing in P. Crop residues were retained in the experiment and incor-porated at cultivation. All plots were combi-drilled. That is, fertilizer was placed in every second inter-row about 2 cm below the seeds in the same operation as sowing. The rate of nitrogen fertilizer added in
the spring was 90 kg ha−1for all cereal and oil-seed
crops except winter wheat where 90–110 kg ha−1was
used according to local recommendations based on expected crop yields. Sowing of spring-sown crops could generally be carried out some days earlier in S than in P. Pesticides were applied according to lo-cal recommendations. Grain yields were measured in each plot at harvest. Crop yields from 1988–1995 are presented.
2.2. Sampling
Soil sampling (40 disturbed samples per plot) for chemical and microbiological laboratory analyses and aggregate stability determinations were carried out on 26 April 1995, before fertilizing and sowing were car-ried out on 8 May. All samples were taken in the topsoil, which was divided into two layers: 0–12 and 12–24 cm. On 9–11 May, undisturbed cylindrical soil cores from the 4–9 and 17–22 cm soil layers were taken with steel cylinders, 50 mm high and 72 mm in diameter, for physical laboratory analyses. Air perme-ability was measured on 9–11 May. Penetration resis-tance was measured on 26 May.
2.3. Measurement of soil parameters
2.3.1. Physical soil analyses
To determine the stability of aggregates in the sam-pled soil, a number of measurements were carried
out. Tensile strength (Y, N mm−2) was measured by
a crushing test on 20 oven-dried (105◦C, 24 h) aggre-gates with 12 mm average diameter, sieved from each disturbed soil sample (Dexter and Kroesbergen, 1985). Aggregate stability in the wet condition determined as dispersed clay after shaking (Watts et al., 1996) was measured on 12 aggregates per sample, stored air-dry and then re-wetted before measurements. Dispersed
clay after shaking was measured on a turbidimeter (T,
mg dispersed clay g−1 dry soil aggregate). A
stabil-ity index (AGS) was calculated from the aggregate stability measured in wet and dry conditions, respec-tively: AGS=(1−T/Tr)(1−Y/Yr) whereTr andYr are reference values for artificially made, remoulded ag-gregates (Watts et al., 1996). The friability (Frb) of the aggregates was calculated asσY/Y±sY/(Y(2n)1/2)
whereYis the average tensile strength for each
sam-ple,σYis the standard deviation of the measured
val-ues of tensile strength,n is the number of replicates
and±σY/(Y(2n)1/2) is the standard error of the coef-ficient of variation (Watts and Dexter, 1998).
Dry bulk density (BD, g cm−3) and soil water
con-tent (WC, g (100 g)−1 soil) were measured on the
undisturbed soil cores (two per plot). The cores were
oven-dried at 105◦C for 72 h before weighing.
Soil water content at 0.5, 3, 10, 60 and 300 kPa ma-tric tension was also determined on the undisturbed soil cores using standard porous sand blocks and ce-ramic plates. The measurements were carried out af-ter saturation of the cylinders, which occurred slowly from the base, but before BD determination. Total porosity (TPV, %) was calculated from the dry bulk density and particle density of the soil in the sam-pled cores. Equivalent pore diameters were calculated from the measured water contents at the different ten-sions (Childs, 1940; Andersson, 1962) and were ex-pressed in eleven pore diameter classes:<1, >1, 1–5, <5, 5–30, <30, >30, 30–600, 30–100, 100–600 and
>600mm. Water content at−1500 kPa was determined
on separate soil samples.
Soil penetration resistance (Pen, kPa) was deter-mined with a Bush recording penetrometer (Anderson et al., 1980) with a cone diameter of 12.8 mm. The resistance was registered at 2 cm increments.
Soil air permeability was measured in the field after sowing operations (Green and Fordham, 1975; Lind-ström et al., 1990). Air permeability was measured on undisturbed soil in steel cylinders, 10 cm high and 72 mm in diameter, both with the cylinders in the ground (Kaid, mm2) and removed (Kaiu,mm2) from
the ground. The soil sample within the cylinder was 5 cm high.
The basal respiration rate (B-res, mg CO2–C g−1
DM h−1) and substrate induced respiration (SIR,
mg
CO2–C g−1 DM h−1) were analyzed. The evolution
of CO2 was determined hourly with a respirometer
(Respicond III, Nordgren Innovations AB, Umeå, Sweden). The B-res was calculated as the average res-piration rate over the 40 h interval between 200–240 h incubation. The SIR was measured after the basal res-piration by mixing a substrate consisting of glucose,
talcum powder and (NH4)2SO4into each sample. SIR
was used as a microbial biomass indicator and was calculated with nonlinear regression as the sum of initial CO2–C evolved by growing and nongrowing organisms (Stenström et al., 1998). The specific
res-piration (qCO2) was calculated as the ratio between
B-res and SIR.
The nitrogen mineralization capacity (N-min, mg
NH4+–N g−1DM 10 days) was analyzed under
anaer-obic incubation (Waring and Bremner, 1964). Samples
were incubated for 10 days at 37◦C before extraction
and analysis of NH4+. The potential ammonium
ox-idation rate (PAO,mg NO2−–N g−1 DM min−1) was
assayed as accumulated nitrite according to the chlo-rate inhibition technique (Belser and Mays, 1980). The potential denitrification activity (PDA,mg N2O–N g−1
DM min−1) was assayed according to the C2H2
inhi-bition method (Smith and Tiedje, 1979). From these data the specific growth rate of the denitrifiers (mPDA,
min−1) was also calculated (Pell et al., 1996). Soil pH was determined in 0.02N CaCl solution. Soil organic carbon content (C-org, %) and total nitro-gen (N-tot, %) were measured on a Leco® CNS-2000.
2.4. Data analyses
Only interactions between treatments could be tested by analysis of variance due to the lack of repli-cates within each sub-experiment. Standard deviations for the variables are presented.
To reveal similarities and differences between the sampled plots, and the relationships between the dif-ferent variables, principal component analysis (PCA, Wold et al., 1987) was performed on all analyzed soil data. For this the Unscrambler® software pack-age (Camo A/S, Trondheim, Norway) was used. The components extracted in PCA models are linear repre-sentatives, which describe the maximum variation in
the original data set. In a PCA model the objects (soil samples) are represented by their scores and the vari-ables are represented by their loadings. The scores and loadings can be presented in graphs where two com-ponents (as score vectors or loading vectors) are plot-ted against each other. In score plots, similar samples will be positioned close to each other. In loading plots, positively and negatively correlated variables will be positioned close to each other, or opposite each other, respectively. Samples that are high in a specific vari-able will be pulled towards the area of the score plot where the variable in the corresponding loading plot is located. The number of components to be used was optimized through full cross validation (Wold et al., 1987). The number of variables was reduced by excluding those explained to less than 50% by the significant components.
3. Results and discussion
3.1. Crop yield
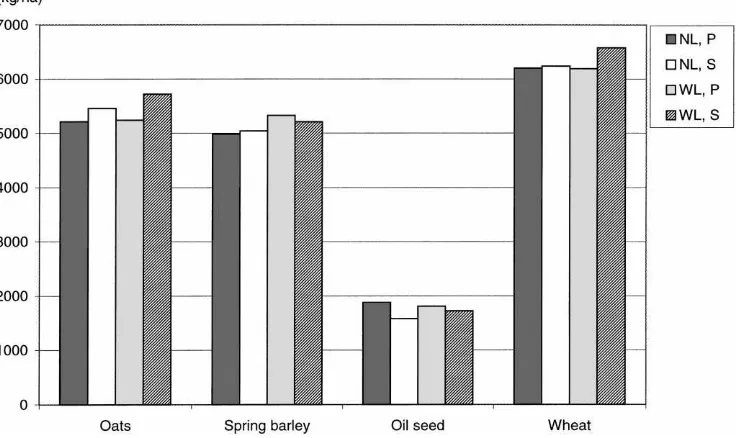
Crop yields, as means for all yields from 1988 to 1995, were higher on stubble cultivated soil than on mouldboard ploughed soil (Fig. 1 and Table 2). Lim-ing also improved yields. Yields were highest in plots stubble cultivated and limed, but interactions were not statistically significant. In the last full crop sequence before soil property measurements, from 1991 to 1993 there were only small differences in yield between the treatments (data not shown). In 1994 all yields were relatively low, but considerably higher in the plots with reduced cultivation, especially in combination with
lime (2538 kg ha−1compared to mouldboard ploughed
without lime 1305 kg ha−1). In this year there were
problems with early crust formation, which was fol-lowed by a long dry period. Thus, germination was in-hibited. Stubble cultivation and liming reduced these problems compared to mouldboard ploughing.
3.2. Principal components
Fig. 1. Average yields (kg ha−1at 85% dry matter) for each crop 1988–1995 at Sundby (NL=No CaO, WL=6.5 Mg CaO ha−1, P=Mouldboard
ploughing as primary tillage, S=Stubble cultivation as primary tillage).
(i) tensile strength of dry aggregates (Y) was not
in-cluded as it correlated strongly (r2=0.86) with the
aggregate stability index (AGS) in which it is in-cluded, (ii) the total porosity (TPV) was excluded as it was derived from dry bulk density and as it strongly correlated to pores >30mm (r2=0.83). One sample,
the 0–12 cm P–NL treatment cropped with oats, was excluded as an outlier, due to a large number of missing values.
Samples from the two layers of the topsoil and the different treatments were well separated by the four components, as illustrated by the score plots (Figs. 2–4). An increase in variables related to the organic matter, aggregate stability and pores<1 and >30mm
separated the stubble cultivated upper layers from
Table 2
Average grain yield (kg ha−1 at 85% dry matter) at Sundby
1988–1995 for all crops in treatments studied in the present investigationa
Without CaO With CaO Average
Mouldboard ploughed 4570 4642 4606 Stubble cultivated 4579 4808 4693
Average 4575 4725 4650
aInteractions were not statistically significant.
the lower layers and somewhat from the interme-diate mouldboard ploughed upper layers (Fig. 2B). In the 0–12 cm layer with reduced tillage a higher concentration of organic carbon was found, as was higher aggregate stability (Table 3). Substrate induced respiration (an index of microbial biomass), basal respiration rate and potentially mineralizable nitrogen were also increased (Fig. 2A, Table 3).
Table 3
Average variable values and standard deviations (S.D.) in the 0–12 cm layer for each treatment combination
Variablea Stubble cultivated Mouldboard ploughed
With CaO Without CaO With CaO Without CaO
0–12 S.D. 0–12 S.D. 0–12 S.D. 0–12 S.D.
C-org 1.8 0.045 1.8 0.076 1.6 0.053 1.7 0.068
N-tot 0.16 0.007 0.17 0.009 0.15 0.007 0.16 0.005
C/N2 10.9 0.27 10.9 0.53 10.5 0.39 10.3 0.53
pH 6.9 0.136 6.2 0.066 6.9 0.039 6.0 0.123
B-res 0.44 0.037 0.43 0.058 0.29 0.053 0.27 0.036
SIR 6.4 0.59 6.3 0.37 4.4 0.40 5.0 0.84
qCO2 0.069 0.006 0.068 0.008 0.065 0.008 0.053 0.002
N-min 33 13.2 22 8.4 17 3.5 17 4.6
PAO 7.4 1.55 4.0 0.42 6.7 0.22 6.0 0.51
PDA 6.8 1.2 11.5 1.7 4.1 0.7 7.7 1.5
mPDA 0.0065 0.0011 0.0044 0.0013 0.0070 0.0005 0.0049 0.0013
WC 24.0 1.4 28.2 9.4 24.4 1.9 22.1 0.6
TPVb 49.3 2.7 49.6 2.7 49.4 2.5 48.6 3.2
<1 29.1 2.4 28.8 2.0 29.1 0.7 28.5 2.1
>30 13.8 5.5 14.4 4.9 14.0 2.7 13.8 5.5
BD 1.34 0.071 1.33 0.071 1.34 0.067 1.36 0.084
Kaid 143 30 397 206 93 81 240 227
Kaiu 461 129 832 296 407 240 772 213
AGS 0.51 0.033 0.54 0.129 0.46 0.078 0.48 0.081
Yb 0.266 0.045 0.243 0.121 0.288 0.092 0.263 0.077
Tb 16.9 1.3 16.5 5.2 20.0 5.8 19.9 4.4
Frbb 0.455 0.132 0.385 0.081 0.458 0.071 0.535 0.080
Pen 1039 91 1147 54 1066 109 1553 151
aC-org (total organic carbon, %); N-tot (total nitrogen, %); B-res (basal respiration rate,
mg CO2–C g−1DM h−1); SIR (substrate induced
respiration,mg CO2–C g−1 DM h−1);qCO2(specific respiration, ratio between B-res; and SIR); N-min (nitrogen mineralization capacity,
mg NH4+–N g−1 DM 10 days); PAO (potential ammonium oxidation rate,mg NO2−–N g−1 DM min−1); PDA (potential denitrification
activity,mg N2O–N g−1DM min−1);mPDA (specific growth rate of the denitrifiers, min−1); WC (actual water content, g (100 g)–1 soil);
TPV (total porosity, %);<1 (porosity from pores with equivalent diameter<1mm); >30 (porosity from pores with equivalent diameter
>30mm); BD (dry bulk density, g cm−3); Kaid (field air permeability with cylinders into soil, mm2);Kaiu(field air permeability with
cylinders removed from soil,mm2); AGS (aggregate stability index); Y(dry tensile strength, N mm−2);T(dispersed clay, mg dispersed
clay g−1 dry soil aggregate); Frb (soil friability); Pen (penetration resistance, kPa). bNot included in the model (not shown in Figs. 2–4).
microbiology by Anderson and Domsch (1985) who
proposedqCO2as an index of system age. A change
towards increased amounts of labile organic mat-ter would result in a younger system with a higher turnover rate of organic matter.
The positive influence of organic matter on aggre-gate stabilisation is generally suggested to act through the activity of microorganisms. Microbially produced extracellular metabolites such as polysaccharides and proteins cement microaggregates together and im-prove their stability (Lynch, 1984; Gupta and Germida, 1988; Dorioz et al., 1993). The intermediate position of the 0–12 cm P samples on the first component was
Table 4
Average variable values with standard deviations (S.D.) in the 12–24 cm layer for each treatment combination
Variablea Stubble cultivated Mouldboard ploughed
With CaO Without CaO With CaO Without CaO
12–24 S.D. 12–24 S.D. 12–24 S.D. 12–24 S.D.
C-org 1.6 0.083 1.6 0.071 1.6 0.051 1.6 0.097
N-tot 0.15 0.003 0.16 0.006 0.15 0.007 0.15 0.004
C/N2 10.5 0.61 10.5 0.53 10.4 0.46 10.3 0.73
pH 6.9 0.101 6.1 0.122 6.8 0.103 6.0 0.103
B-res 0.26 0.054 0.22 0.046 0.28 0.029 0.23 0.034
SIR 4.0 0.41 4.3 0.26 4.7 0.31 4.7 0.66
QcO2 0.066 0.012 0.052 0.013 0.061 0.010 0.049 0.009
N-min 15 5.7 20 8.3 20 4.5 17 4.9
PAO 6.2 0.58 4.8 0.70 6.7 0.77 5.3 0.38
PDA 4.3 0.8 7.1 2.3 5.4 0.4 8.7 3.5
mPDA 0.0069 0.0006 0.0052 0.0012 0.0066 0.0009 0.0040 0.0016
WC 22.9 0.2 23.1 0.3 30.5 3.6 26.8 0.4
TPVb 41.6 1.6 41.7 2.5 44.7 1.4 44.2 1.7
<1 31.2 1.6 31.6 2.1 33.6 1.6 32.6 1.4
>30 4.9 3.5 4.7 5.1 3.2 2.6 4.3 3.3
BD 1.55 0.043 1.55 0.066 1.47 0.036 1.48 0.044
Kaid 31 12 36 10 1 1 4 47
Kaiu 261 280 360 284 29 38 90 23
AGS 0.32 0.114 0.26 0.083 0.24 0.043 0.35 0.104
Yb 0.465 0.103 0.590 0.134 0.639 0.054 0.475 0.115
Tb 23.1 8.0 21.6 1.9 18.9 7.4 19.9 3.7
Frbb 0.450 0.138 0.559 0.021 0.423 0.130 0.549 0.096
Pen 1669 105 1682 64820 86 951 95
aSee Table 3 for explanation of variable abbreviations. bNot included in the model.
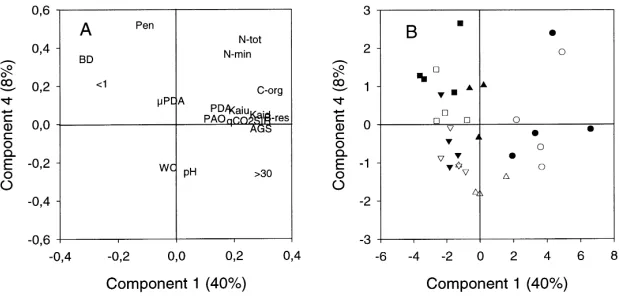
Fig. 3. Results of the PCA analyses. Principal components 1 vs 3. (A) Loading plot showing the relations between variables; (B) Score plot showing the relations between samples. Open symbols=with lime; Filled symbols=no lime;d=stubble cultivated 0–12 cm;j=stubble cultivated 12–24 cm;m=mouldboard ploughed 0–12 cm;.=mouldboard ploughed 12–24 cm. (A) and (B) can be read interactively as their respective quadrants correspond to each other (see Section 2.3). Abbreviations are explained in Table 3.
upper 24 cm. The explanation for this is probably a combination of effects. A carbon input remained in the 12–24 cm layer from root-exudates and residues, and dissolved organic carbon from the upper 12 cm could have leached down as suggested by Eghball et al. (1994). [b] In addition, with the higher yields un-der reduced tillage (Table 2), there would have been a higher total input of crop residues, although not measured here.
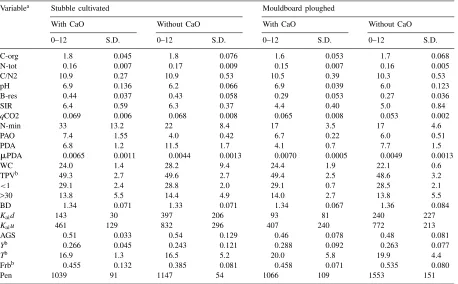
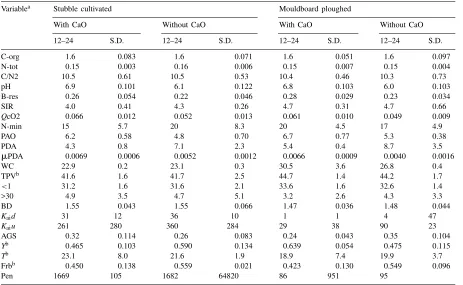
Fig. 4. Results of the PCA analyses. Principal components 1 vs 4. (A) Loading plot showing the relations between variables; (B) Score plot showing the relations between samples. Open symbols=with lime; Filled symbols=no lime;d=stubble cultivated 0–12 cm;j=stubble cultivated 12–24 cm;m=mouldboard ploughed 0–12 cm;.=mouldboard ploughed 12–24 cm. (A) and (B) can be read interactively as their respective quadrants correspond to each other (see Section 2.3). Abbreviations are explained in Table 3.
Fig. 5. Penetration resistance in 0–50 cm at Sundby 1995. WL=with lime, NL=no lime, S=stubble cultivation, P=mouldboard ploughing.
textured soils are more dependent on the organic mat-ter content (Berglund, 1971; Ledin, 1981). However, the potentially mineralizable nitrogen appeared to be partly dependent on the organic matter content and partly on the pH, which could to some extent ex-plain the higher yield in the limed treatments. Nitri-fiers are a rather small group of organisms sensitive to pH (Haynes, 1986; Stenberg et al., 1998b). A pH closer to the physiological optimum probably affected the growth rate of denitrifiers positively. The relation to pH is in agreement with earlier studies (Stenberg et al., 1998b). As denitrification occurs under anaero-bic conditions, the lower potential in the limed plots could be explained by poorer aeration there. However, none of the structure variables support this. On the contrary, the air permeability tended to be decreased by liming. The explanation could instead be stronger competition for nitrogen in the limed plots, from plants and other organisms, due to the more favourable pH.
The third component separated between the tillage treatments in the lower topsoil (Fig. 3B). The main factor here was the penetration resistance, which was highest in the lower S and lowest in the lower P layer (Fig. 3A). The penetration resistance in the experi-ment throughout the profile is shown in Fig. 5 (SD in Tables 3 and 4). The water content at the time of
sampling was correspondingly highest in the lower P layer, which probably explains the lower penetration resistance there, as expressed by the third component. However, most of the remaining variance of the pen-etration resistance was explained by the fourth com-ponent (38 out of a total explained penetration resis-tance variance of 89%), while this was not the case for the water content (only 8 out of 71% was explained by PC4) (Fig. 4A). Thus, in the fourth component the penetration resistance was largely corrected for differ-ences in water content. Nevertheless, with one excep-tion the separaexcep-tion between tillage treatments in the lower layers remained in the fourth component (Fig. 4B). The high resistance in the lower S layer was most likely due to the lack of cultivation for 8 years. In ad-dition, the mouldboard ploughed limed and unlimed plots were separated in the 0–12 cm layer, with a lower penetration resistance in the limed plots. Except for a small part of the variation in bulk density and pores
>30mm, none of the other structure variables were
explained by the fourth component.
4. Conclusions
The concentration of plant residues in the upper topsoil by reduced depth of primary tillage increased the organic matter content, stimulated the microbial biomass and supported an increase in aggregate stabil-ity. Although the differences were small they accom-modated an increase in grain yield in this treatment, mainly by reducing the effects in 1994 of weather con-ditions promoting crust formation in the soil surface. A similar result from liming in this year indicated that it improved the structure in a way that was not ac-counted for by any of the measured structure variables in this weakly-structured soil.
Reducing tillage to stubble cultivation in the up-per 12 cm in this silty clay loam improved biological properties and physical conditions important for sus-tainable agriculture. Liming for improved structure in-creased the positive effects.
Acknowledgements
and Andreas Trautner who carried out most of the measurements are all acknowledged for their con-tributions. The field experiment was partly financed by the Swedish Farmers Foundation for Agricultural Research.
References
Alexandersson, H., Karlström, C., Larsson-McCann, S., 1991. Temperaturen och nederbörden i Sverige 1961–1990. Referensnormaler. (Temperature and precipitation in Sweden 1961–1990. Reference normals). Swedish Meteorological and Hydrological Institute, SMHI, Meteorologi No. 81, Norrköping, 88 pp.
Anderson, T.H., Domsch, K.H., 1985. Determination of ecophysiological maintenance carbon requirements of soil microorganisms in a dormant state. Biol. Fertil. Soils 1, 81–89. Anderson, T.H., Domsch, K.H., 1986. Carbon link between microbial biomass and soil organic matter. In: Megusar, F., Gantar, M. (Eds.), Perspectives in Microbial Ecology. Slovene Society for Microbiology, Ljubljana, pp. 467–471.
Anderson, G., Pidgeon, J.D., Spencer, H.B., Parks, R., 1980. A new hand-held recording penetrometer for soil studies. J. Soil Sci. 31, 279–296.
Andersson, S., 1962. Markfysikaliska undersökningar i odlad jord XIII. Några teoretiska synpunkter på vattenhaltskurvor, dräneringsjämvikter och porstorleksfördelningar. (Theoretical aspects on water retention curves, drainage equilibria and pore size distributions). Grundförbättring 15, 51–108.
Angers, D.A., Ndayegamiye, A., Cote, D., 1993a. Tillage-induced differences in organic matter of particle-size fractions and microbial biomass. Soil Sci. Soc. Am. J. 57, 512–516. Angers, D.A., Bissonnette, N., Légère, A., Samson, N., 1993b.
Microbial and biochemical changes induced by rotation and tillage in a soil under barley production. Can. J. Soil Sci. 73, 39–50.
Balloni, W., Favilli, F., 1987. Effects of agricultural practices on the physical, chemical and biological properties of soils Part I. Effects of some agricultural practices on the biological soil fertility. In: Barth, H., L’Hermite, P. (Eds.), Scientific Basis for Soil Protection in the European Community. Elsevier ASP, Barking, Essex, pp. 161–179.
Belser, L.W., Mays, E.L., 1980. Specific inhibition of nitrate oxidation by chlorate and its use in assessing nitrification in soils and sediments. Appl. Environ. Microbiol. 39, 505–510. Berglund, G., 1971. Kalkens inverkan på jordens struktur. (The
influence of lime on soil structure). Grundförbättring 24, 81–93. Burns, R.G., Davies, J.A., 1986. The microbiology of soil structure. In: Lopez-Real, J.M., Hodges, R.D. (Eds.), The Role of Microorganisms in a Sustainable Agriculture. A B Academic Publishers, Berkhamstead, UK, pp. 9–27.
Carter, M.R., 1991. The influence of tillage on the proportion of organic carbon and nitrogen in the microbial biomass of medium-textured soils in a humid climate. Biol. Fertil. Soils 11, 135–139.
Chan, K.Y., 1995. Strength characteristics of a potentially hardsetting soil under pasture and conventional tillage in the semi-arid region of Australia. Soil Tillage Res. 34, 105–113. Chaney, K., Swift, R.S., 1984. The influence of organic matter
on aggregate stability in some British soils. J. Soil Sci. 35, 223–230.
Childs, E.C., 1940. The use of soil moisture characteristics in soil studies. Soil Sci. 50, 239–252.
Dexter, A.R., Kroesbergen, B., 1985. Methodology for determination of tensile strength of soil aggregates. J. Agric. Eng. Res. 31, 139–147.
Dorioz, J.M., Robert, M., Chenu, C., 1993. The role of roots, fungi and bacteria on clay particle organization. An experimental approach. Geoderma 56, 179–194.
Eghball, B., Mielke, L.N., Mccallister, D.L., Doran, J.W., 1994. Distribution of organic carbon and inorganic nitrogen in a soil under various tillage and crop sequences. J. Soil Water Conser. 49, 201–204.
Friedel, J.K., Munch, J.C., Fischer, W.R., 1996. Soil microbial properties and assessment of available soil organic matter in a haplic luvisol after several years of different cultivation and crop rotation. Soil Biol. Biochem. 28, 479–488.
Green, R.D., Fordham, S.J., 1975. A field method for determining air permeability in soil. MAFF Tech. Bull., No. 29, pp. 273–288. Gupta, V.V.S.R., Germida, J.J., 1988. Distribution of microbial biomass and its activity in soil aggregate size classes as affected by cultivation. Soil Biol. Biochem. 20, 777–786.
Haynes, R.J., 1986. Nitrification. In: Haynes, R.J. (Eds.), Mineral Nitrogen in the Plant–Soil System. Academic Press, Orlando, Florida, pp. 127–165.
Ledin, S., 1981. Physical and micromorphological studies of the effects of lime on a clay soil. Department of Soil Sciences, SLU, Uppsala.
Lindström, J., Jonsson, B., McAfee, M., 1990. Measurements and interpretation of air permeability coefficients in six Swedish soils. Swedish J. Agric. Res. 20, 69–76.
Lynch, J.M., 1984. Interactions between biological processes, cultivation and soil structure. Plant and Soil 76, 307–318. Odum, E.P., 1969. The strategy of ecosystem development. Science
164, 262–270.
Parton, W.J., Persson, J., Anderson, D.W., 1985. Simulation of organic matter changes in Swedish soils. In: Lauenroth, W.K., Skogerboe, G.V., Flug, M. (Eds.), Analysis of Ecological Systems: State-of-the-Art in Ecological Modeling. Elsevier, Amsterdam, pp. 511–516.
Pell, M., Stenberg, B., Stenström, J., Torstensson, L., 1996. Potential denitrification activity assay in soil — with or without chloramphenicol? Soil Biol. Biochem. 28, 393–398.
Shanmuganathan, R.T., Oades, J.M., 1983. Modification of soil physical properties by addition of calcium compounds. Aust. J. Soil Res. 21, 285–300.
Smith, M.S., Tiedje, J.M., 1979. Phases of denitrification following oxygen depletion in soil. Soil Biol. Biochem. 11, 261–267. Stenberg, B., Johansson, M., Pell, M., Sjödahl-Svensson, K.,
Stenberg, B., Pell, M., Torstensson, L., 1998b. Integrated evaluation of variation in biological, chemical and physical soil properties. Ambio 27, 9–15.
Stenberg, M., Håkansson, I., von Polgár, J., Heinonen, R., 1995. Sealing, crusting and hardsetting soils in Sweden — occurrence, problems and research. Proceedings of Second International Symposium on Sealing, Crusting and Hardsetting Soils: Productivity and Conservation, Brisbane, Australia, 7–11 February 1994, pp. 287–292.
Stenström, J., Stenberg, B., Johansson, M., 1998. Kinetics of substrate-induced respiration (SIR): theory. Ambio 27, 35–39.
Tisdall, J.M., 1994. Possible role of soil microorganisms in aggregation in soils. Plant and Soil 159, 115–121.
Tisdall, J.M., Oades, J.M., 1982. Organic matter and water-stable aggregates in soil. J. Soil Sci. 33, 141–163.
Waring, S.A., Bremner, J.M., 1964. Ammonium production in soil under waterlogged conditions as an index of nitrogen availability. Nature 201, 951–952.
Watts, C.W., Dexter, A.R., 1998. Soil friability: theory, measurements and the effects of management and organic carbon content. Eur. J. Soil Sci. 49, 73–84.
Watts, C.W., Dexter, A.R., Dumitru, E., Arvidsson, J., 1996. An assessment of the vulnerability of soil structure to destabilisation during tillage Part I. A laboratory test. Soil Tillage Res. 37, 161–174.