DYNAMIC 3D MODELING OF A CANAL-TUNNEL USING PHOTOGRAMMETRIC AND
BATHYMETRIC DATA
E. Moisana, C. Heinkelea, P. Charbonniera, P. Fouchera, P. Grussenmeyerb, S. Guilleminb, M. Koehlb
a
Cerema Est, Laboratoire de Strasbourg, 11 rue Jean Mentelin, B.P. 9, 67035 Strasbourg, France (Emmanuel.Moisan, Christophe.Heinkele, Pierre.Charbonnier, Philippe.Foucher)@cerema.fr
bICube Laboratory UMR 7357, Photogrammetry and Geomatics Group, INSA Strasbourg, 24 Boulevard de la Victoire,
67084 Strasbourg, France - (pierre.grussenmeyer, samuel.guillemin, mathieu.koehl)@insa-strasbourg.fr
Commission II
KEY WORDS:3D modeling, multibeam echosounder, photogrammetry, inspection, underwater
ABSTRACT:
This contribution introduces an original method for dynamically surveying the vault and underwater parts of a canal-tunnel for 3D modeling. The recording system, embedded on a barge, is composed of cameras that provide images of the above-water part of the tunnel, and a sonar that acquires underwater 3D profiles. In this contribution we propose to fully exploit the capacities of photogram-metry to deal with the issue of geo-referencing data in the absence of global positioning system (GPS) data. More specifically, we use it both for reconstructing the vault and side walls of the tunnel in 3D and for estimating the trajectory of the boat, which is necessary to rearrange sonar profiles to form the 3D model of the canal. We report on a first experimentation carried out inside a canal-tunnel and show promising preliminary results that illustrate the potentialities of the proposed approach.
1. INTRODUCTION
In order to enable inland navigation, 33 canal-tunnels were bored during the 19th and 20th centuries in France. Nowadays, most of them are still in use, for commercial navigation and pleasure boating. Thus, maintaining them meets a double need: preserving a heritage and ensuring safety. To reach this goal, periodical vi-sual inspections are necessary, which is both time-consuming and impeding for traffic. Moreover, surveying the underwater parts of tunnels by divers is rather awkward due to the turbidity of water and tunnel drying may be hazardous for the tunnel structure. Fi-nally, traditional bathymetric techniques cannot be employed due to the lack of Global Navigation Satellite Systems (GNSS) signal in tunnels. Therefore, innovative solutions are needed.
In this context, we are developing an automatic inspection sys-tem, in collaboration with Voies Navigables de France (VNF, the French operator of waterways) and the Centre d’ ´Etudes des TUn-nels (CETU). In this paper, we introduce a method for surveying the above and underwater parts of the tunnel in a dynamic fashion and then, for reconstructing the full 3D model of the canal-tunnel.
The proposed prototype, which is embedded on a barge, asso-ciates image acquisitions for modeling the vaults to sonar record-ing, for the canal. Reconstructing the above-water parts in 3D from images is not very difficult thanks to photogrammetric tech-niques. The choice of sonar technology for surveying the canal is motivated by the turbidity of the water. A multibeam echo-sounder records 3D profiles of the canal walls and soil perpendic-ularly to its trajectory. Hence, it is necessary to rearrange these profiles along the recorded path of the boat to build the under-water part of the model. Since no GNSS signal is available in tunnels, we propose to estimate the trajectory thanks to the suc-cessive positions of the cameras provided by photogrammetry. In other words, we fully exploit the potential of photogrammetric techniques to replace the traditional GNSS-INS (Inertial Naviga-tion Systems) couple. Of course, an evaluaNaviga-tion of the method
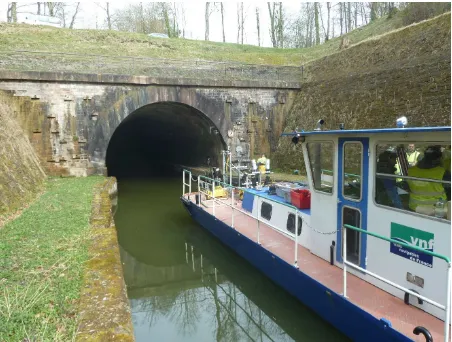
Figure 1. View of the barge supporting the modular acquisition system, on the experimental site.
will be needed, which can be done either by assessing the ob-tained trajectory using an external reference, or by comparing the reconstructed model to a reference one, built from static acqui-sitions (Moisan et al., 2015), as described in (Charbonnier et al., 2013).
In this paper, we report on a first experimental campaign, that was performed in a canal-tunnel near Strasbourg (France), and show the first 3D models obtained with the proposed method.
2. RELATED WORK
Recently, several systems were devised for surveying 3D semi-submerged structures such as harbours or dams, e.g. (Rondeau et al., 2012). These systems are based on the combination of terres-trial mobile mapping and bathymetry. They associate a Terres-trial Laser Scanner (TLS), for surveying above-water parts, and a multibeam echosounder, for the underwater ones. Since the dy-namic use of these two devices requires the position and orienta-tion of the acquisiorienta-tion platform during surveying, INS and GNSS are employed in open environments. However, the lack of GNSS signal inside tunnels makes this localisation method inoperative in our context.
An alternative, proposed in (Papadopoulos et al., 2014), is based on high-update-rate TLS acquisitions: the trajectory is estimated by registering scans with each other thanks to the ICP (Iterative Closest Point) algorithm. To be effective, this method requires common features between scans, which might be difficult to find in tubular environments, such as tunnels. Moreover, such meth-ods often use rotative scanners and it is then necessary to care-fully eliminate rotational effects in the scans to avoid false corre-spondences and hence to estimate the trajectory properly.
Photogrammetry is an appealing solution since it enables gath-ering navigation information at the same time as reconstructing the 3D model. This technique can be used in real-time, which is called visual odometry. It was chosen in (Kriechbaumer et al., 2015) to automatically survey river banks from a moving vessel. Photogrammetry may also be employedoff-line, using bundle ad-justment, as in (Charbonnier et al., 2013), for example: the tra-jectory is then derived from the successive camera positions and orientations. This is the approach we choose for this paper.
3. DATA RECORDING
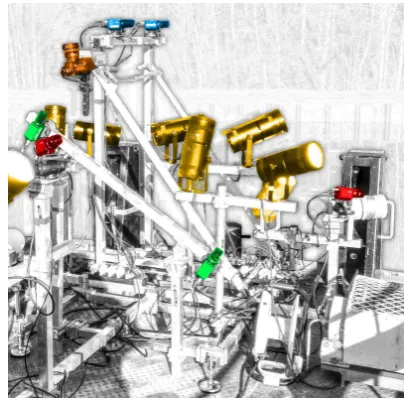
To experiment our method, a prototype was developed and tested in a tunnel-canal. The system includes a set of cameras that record images of the vault and side walls, and an underwater sen-sor to survey the canal. All these sensen-sors were placed on a boat thanks to a modular structure (Charbonnier et al., 2014), shown on Fig. 2.
3.1 Set-up
The image acquisition system is made of six industrial cameras and one photographic camera. In fact, four cameras are arranged to form two stereo rigs. The first one is directed towards the vault, perpendicularly to the tunnel longitudinal axis (green cameras, called cam5 and cam6, on Fig. 2). Since the aperture angle of the cameras does not allow capturing all the vault, several passes are needed, with two different angles with respect to the vertical axis of the tunnel (58◦
and 0◦
), as shown on Fig. 3. The second one is horizontal and placed so as to take pictures of the right side wall, parallel to it (blue cameras, cam1 and cam2, on Fig. 2). The remaining two cameras are also used to take pictures of the side wall, but with an oblique angle, which is necessary to limit cur-vature effects in the reconstructed model (see red cameras, cam3 and cam4, on Fig. 2), as shown in (Nocerino et al., 2014). These six cameras are Pike F210 C (1920×1080pixels) cameras with 12.5mmfocal length. They are triggered simultaneously, at a 5Hz frequency. The industrial cameras are individually calibrated with well-known procedure (Tsai, 1987, Zhang, 1999, Szeliski, 2010) using standard calibration patterns. Stereo rigs are also calibrated in order to measure in 3D.
The photographic camera is a Canon EOS 5D MarkIII (5760× 3840pixels) with a fisheye lens. It takes wide-angle pictures, triggered every 2 s, that may be used to ease 3D reconstruction. All these elements are attached to the modular structure, that also supports lightings, and is placed on the front deck of the barge.
Figure 2. Image acquisition system with the first stereo rig in green, the second stereo-rig in blue, the oblique cameras in red, the fish-eye camera in orange, and the lighting system in yellow.
The sonar device used for underwater 3D data acquisition is a multibeam echosounder, namely the MB1350 (Blueview). For this first experimentation the device was operated by a sub-contractor, the Sub-C Marine company (France). The device is attached to the boat thanks to a removable pole. The emitted sound wave has a frequency of 1.35 MHz and the receiving an-tenna is composed of 256 beams arranged in a fan shape with 45◦
aperture. It acquires point profiles at a regular rate of 40 Hz. The high frequency of the emitted signal offers a good resolution in distance, but at the same time, limits the acquisition range to 30 m. Moreover, due to the 1◦
beam width, the signal footprint on a perpendicular plane 5 m away from the device is a square of 87 mm side. More information about the sonar capacities may be found in (Moisan et al., 2016), where it was used to survey a lock in a static manner thanks to a mechanical rotation system. Several observations have been made, such as the granular aspect of the resulting point cloud or the presence of acoustic phenom-ena or, the ability to detect defects of decimetric size. In dynamic acquisitions, the surveyed area is swept thanks to the vessel mo-tion and the 3D model is obtained by gathering profiles along the trajectory of the system. However, due to the limited aper-ture angle, several passes are necessary. In this experiment, three tilt angles were applied to the MB1350: 11.25◦
, 45◦ and 90◦
(see Fig. 3). Regarding sonar calibration, only the speed of sound in water was measured with a suitable instrument.
3.2 Experimentation
Figure 3. Schematic views of the three system configurations used for scanning a half tunnel.
along the bench. A well-suited lighting makes these landmarks easily detectable in images using simple image processing algo-rithms. In the photogrammetric process, they help scaling and geo-referencing the model.
As previously mentioned, three different set-ups of the sonar and two stereo-rig orientations are required to enable the survey of the half vault and canal. Thus, a minimum of three back and forth passes inside the tunnel are necessary (see Fig. 3). As the boat speed was roughly1 m.s−1, images are taken every 20 cm
and sonar profiles, every 2.5 cm. Hence, during each pass through the tunnel, about 15000 images are recorded by industrial cam-eras, and almost 20000 profiles are acquired by the sonar. Last, roughly 250 pictures are taken by the photographic camera.
Figure 4. Intensity image taken while scanning the sonar and its supporting mast (in the foreground). The imaging system can be
seen in the background.
Furthermore, in order to estimate the relative position between each sensor, namely the lever-arm (see§4.1), each set-up has to be recorded. Therefore, the whole system was surveyed thanks to a Terrestrial Laser Scanner (TLS) each time an element was
modified (stereo rig orientation or sonar orientation). Scans were carried out on the boat for all devices attached to the modular structure, and from the dock for above-water part of the sonar support. The sonar and its mast were also scanned onshore, as shown on Fig. 4.
Figure 5. Views of sonar acquisitions during the experimentation (top) ; typical image of the vault (bottom).
Finally, in order to foresee the method evaluation, the boat motion was recorded using tacheometric tracking, thanks to a couple of active prisms attached to the cabin of the boat.
4. 3D MODELING
At the end of the acquisition campaign, we have in hand several image sequences of the side walls and vaults, and several series of sonar profiles (see Fig. 5). To construct the full 3D model of the canal-tunnel with these data in the absence of GPS signal, we propose a method that fully exploits the capacities of photogram-metry.
Using photogrammetry to build the above-water model is rather straightforward thanks to bundle adjustment techniques (Luh-mann et al., 2014). A simplified visual odometry method (Char-bonnier et al., 2014) is applied, which allowstilingthe images (i.e. gathering them by cross-sections) along the tunnel in order to reduce the computational requirements of the correspondence matching. Images are processed using photogrammetric software MICMAC APERO (Pierrot-Deseilligny and Clery, 2011). A bun-dle adjustment is performed, taking into account rigidity con-straints between the six cameras at each acquisition time. This step also provides the successive positionsPn
ti and orientations
of the six cameras in a common geo-referenced coordinate sys-tem.
set of successive camera positions provided by the bundle adjust-ment. To this end, it is necessary to estimate the relative position of all sensors, which is called lever-arm estimation.
In the following, we first describe the level-arm estimation pro-cess and then, we introduce the 3D sonar model reconstruction.
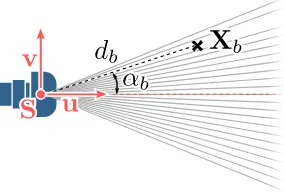
The notations used in this section are summarized in Tab. 1. In particular, sonar data are given in a 2D polar coordinates system centered at the sonar acquisition center, whose axes are given by the central beam of the swath and its perpendicular direction in the swath plane (see Fig. 6).
Figure 6. Definition of the coordinate system and measurement vector attached to the sonar.
X Acquired sonar point
S Sonar acquisition center
u Direction vector of the central sonar beam
v Vector in the sonar swath plane and perpendicular tou
d distance fromXtoS
α Beam angle
P Optical centers of industrial cameras
R Rotation matrix
T Translation vector
...v Element defined in the vessel coordinate system ...n Element defined in the national coordinate system
...ti Element defined for thetiimages acquisition
...ts Element defined for thetssonar acquisition
...b Element defined for one beam of the sonar’swath
Table 1. Chart of the notations used in this section.
4.1 Lever-arm estimation
Geo-referencing the sonar profiles requires estimating the rela-tive offsets of sensors (lever-arm), i.e. calibrating the system. We carry out a direct estimation using a global point cloud of the experimental setup built from the TLS survey of the imaging sys-tem, shown in red on Fig. 7, and TLS surveys of the sonar and its supporting mast, shown in blue (indeed, an acquisition is per-formed each time the tilt angle of the sonar is modified, as noticed in§3.2).
To align both models, features on the supporting mast are used, namely the axis, handles and top of the tube. The alignment pro-cedure provides a 3D point cloud of the whole acquisition system.
In a second step, we align the Computed-Aided-Design (CAD) model of each sensor on the point cloud, to obtain their accurate position and orientation. More specifically, we first segment the
Figure 7. Full-set-up point cloud obtained by laser scanning with in red the above-water part of the system and in blue the aligned
sonar point cloud.
Figure 8. Segmented point cloud exemple of an industrial camera from TLS acquisitions (top) and the corresponding CAD
constructor model (bottom).
global point cloud to isolate each sensor (see Fig. 8, top) then we align the CAD model (see Fig. 8, bottom) on it.
To perform mesh-to-point cloud alignement, an ICP-like algo-rithm was developed. A first modification to the initial algoalgo-rithm concerns the mesh-point cloud distances computation: we apply the method introduced in (Bærentzen and Aanæs, 2002). More-over, at each iteration of the ICP algorithm, the new transforma-tion is estimated from vectors defined by points of the cloud and their normal projections on the mesh.
Since the CAD model are furnished by the constructors of the sensors, their acquisition centers are accurately located. Hence, at the end of the procedure, we know the optical center posi-tion of the cameras,Pv, and the position and orientation of the echosounder measuring head, in a common coordinate system (i.e.Sv
,uv
andvv
) attached to the vessel.
Notice that the accurate position of the prism centers may be extracted from the global point cloud using a constructor CAD model as well.
4.2 3D sonar point cloud building
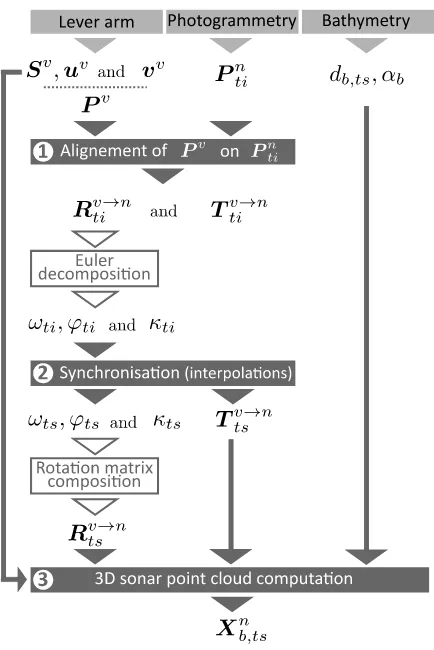
Figure 9. Diagram of sonar point cloud process. Notations are introduced in Tab. 1.
major steps, summarized on Fig. 9. At the first time, the posi-tions of the camera optical centers defined in the vessel coordi-nates system are transformed into the national coordinate one. At each image acquisition, positionsPv
provided by the lever-arm are aligned on photogrammetric computed positionsPnti. The Procrustes method, described in (Golub and Van Loan, 2012), is applied to estimate both the rotation (Rv→n
ti ) and translation
(Tv→n
ti ) matrices. Note that the rotation matrix is decomposed
into Euler anglesωti, ϕti, κti.
In the second major step, sonar and image acquisitions are syn-chronized. At each sonar acquisition, translation vector (Tv→n
ts )
and rotation matrix (Rv→n
ts ) need to be estimated. The translation
vector is computed by linear interpolation. Indeed, we assume that the trajectory is roughly linear and the boat speed between two camera acquisitions is constant. The rotation matrix is given by the Euler anglesωts, ϕts, κts. These angles are computed by using spline interpolations from Euler anglesωti, ϕti, κti.
Lastly, every sonar profile is geo-referenced by applying the pre-viously computed transformations. This operation begins by computing beam direction vectors for each acquisition. Then, we straightforwardly obtain the sonar point cloudXnb,ts in the national reference system.
4.3 Results
We first study the inter-camera distances given by the direct esti-mation described in§4.1, the bundle adjustment and the stereo calibration, shown in Tab. 2. We note that the distances ob-tained by photogrammetry are mean distances. Indeed, despite
the rigidity constraints, we observed small variations, especially at the extremities of the image sequences. However, for the stereo rigs (cam1-cam2 and cam5-cam6), the difference between pho-togrammetry and stereo calibration is small: about 1 or 2 mm. One may observe that the difference between TLS survey (§4.1) and photogrammetry ranges from 1 mm to 3.7 cm. These dif-ferences include errors from both methods. However, we believe that the photogrammetric processing can be improved.
TLS photogrammetry stereo calibration
dist. mean
dist. diff. dist. diff. cam1-cam2 0.499 0.503 -0.004 0.502 -0.003
cam1-cam3 1.556 1.536 0.020 -
-cam2-cam3 2.027 2.009 0.018 -
-cam1-cam4 1.472 1.496 -0.023 -
-cam2-cam4 1.589 1.626 -0.037 -
-cam3-cam4 1.617 1.601 0.017 -
-cam1-cam5 1.591 1.598 -0.007 -
-cam2-cam5 1.904 1.908 -0.005 -
-cam3-cam5 0.986 0.967 0.018 -
-cam4-cam5 0.984 0.985 -0.001 -
-cam1-cam6 0.930 0.916 0.015 -
-cam2-cam6 1.390 1.372 0.018 -
-cam3-cam6 0.739 0.730 0.009 -
-cam4-cam6 1.472 1.478 -0.007 -
-cam5-cam6 0.999 1.009 -0.010 1.007 -0.008
Table 2. Distances between cameras (inm) obtained from lever-arm estimation, photogrammetry and optical calibration.
Differences (inm) between TLS distance and the two other computation methods are also given.
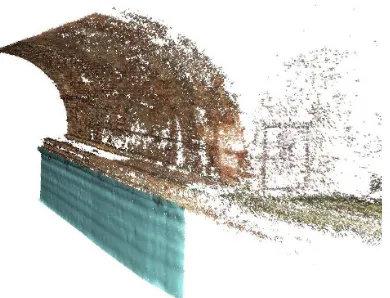
A rough model is shown on Fig 10. This model was built from simplified trajectories, i.e. we considered the boat motion as lin-ear, at a constant speed, and the geo-referencing required man-ual processing. The resulting model offers a good visman-ualisation underwater part of the tunnel, but this method leads to wrongly placed elements. Moreover, when merging the models provided by different acquisitions, one observes longitudinal shifts.
Figure 10. Rough model obtained from dynamic acquisitions and an approximated trajectory of the boat.
Figure 11. Part of the final model resulting from the developed approach.
However, two kinds of issues were highlighted during data pro-cessing. First, we observed imperfection in time synchronisation. Such errors can have a large impact on modeling since a shift of 0.01 s on time stamping cause a1cmerror, bearing in mind that the boat speed is roughly1 m.s−1. In order to improve it,
ad-justments on the prototype are requested. Second, the estimation over time of the system orientation has a significant impact on the resulting underwater model and still needs improvements.
5. CONCLUSION AND FUTURE WORK
In this paper, we have introduced a method to model a canal-tunnel in 3D by using photogrammetric and bathymetric data. To reach this goal, we had to address an important issue in geo-referencing bathymetric data, namely the lack of GNSS signal in-side the tunnel. Photogrammetry was selected to build the above-water model, since images suffice to compute a 3D point cloud, but also to estimate the trajectory of the boat, in order to geo-reference sonar data. We reported on the first experimentation of our system in a canal-tunnel and provided preliminary results that illustrate the potentialities of the method.
These encouraging results may be improved by perfecting the synchronisation between devices. Moreover, introducing tempo-ral filtering may help robustifying the estimation and tracking of the orientation angles, leading to better trajectory estimations. Fi-nally, the data gathered in several passes will be combined in a natural fashion by building a common photogrammetric model to estimate the whole set of trajectories simultaneously and register all sonar profile sequences to form a full 3D model of the canal.
In order to assess quantitatively the performance of the method, two kinds of experiments will be conducted in a near future. First, differences between the trajectory obtained by photogrammetry and the one measured by tacheometry will be analyzed. Second, a reference model (see Fig. 12), which was built from static TLS and sonar 3D acquisitions during a previous experiment (Moisan et al., 2015), will be used to assess the dynamic model, according to the methodology proposed in (Charbonnier et al., 2013).
ACKNOWLEDGEMENTS
This work was funded by the Cerema under PhD Grant No. 64 and supported by the Cerema research program APHOGEOPHY
Figure 12. 3D reference model of Niderviller tunnel entrance.
funded by the General directorate for infrastructure, transport and the sea (DGITM, French Ministry of Environment, Energy and the Sea).
REFERENCES
Bærentzen, J. A. and Aanæs, H., 2002. Generating signed dis-tance fields from triangle meshes.Informatics and Mathematical Modeling, Technical University of Denmark, DTU.
Charbonnier, P., Chavant, P., Foucher, P., Muzet, V., Prybyla, D., Perrin, T., Grussenmeyer, P. and Guillemin, S., 2013. Accuracy assessment of a canal-tunnel 3D model by comparing photogram-metry and laserscanning recording techniques. In: 24th CIPA Symposium, Vol. XL-5, Int. Arch. Photogramm. Remote Sens. Spatial Inf. Sci., pp. 171–176.
Charbonnier, P., Foucher, P., Chavant, P., Muzet, V., Prybyla, D., Perrin, T., Albert, J., Grussenmeyer, P., Guillemin, S. and Koehl, M., 2014. An image-based inspection system for canal-tunnel heritage. International Journal of Heritage in the Digital Era
3(1), pp. 197–214.
Golub, G. H. and Van Loan, C. F., 2012. Matrix computations. Johns Hopkins Studies in the Mathematical Sciences, Vol. 3, 4 edn, Johns Hopkins University Press.
Kriechbaumer, T., Blackburn, K., Breckon, T. P., Hamilton, O. and Rivas Casado, M., 2015. Quantitative evaluation of stereo visual odometry for autonomous vessel localisation in inland wa-terway sensing applications. Sensors15(12), pp. 31869–31887. Special Issue Robotic Sensory Systems for Environment Protec-tion and ConservaProtec-tion.
Luhmann, T., Robson, S., Kyle, S. and Boehm, J., 2014. Close-range photogrammetry and 3D imaging. 2nd edn, Walter de Gruyter.
Moisan, E., Charbonnier, P., Foucher, P., Grussenmeyer, P., Guillemin, S. and Koehl, M., 2015. Adjustment of sonar and laser acquisition data for building the 3D reference model of a canal tunnel. Sensors15(12), pp. 31180–31204. Special Issue Sensors and Techniques for 3D Object Modeling in Underwater Environments.
Nocerino, E., Menna, F. and Remondino, F., 2014. Accuracy of typical photogrammetric networks in cultural heritage 3D mod-eling projects.ISPRS - International Archives of the Photogram-metry, Remote Sensing and Spatial Information SciencesXL-5, pp. 465–472.
Papadopoulos, G., Kurniawati, H., Shariff, A. S. B. M., Wong, L. J. and Patrikalakis, N. M., 2014. Experiments on surface re-construction for partially submerged marine structures. Journal of Field Robotics31(2), pp. 225–244.
Pierrot-Deseilligny, M. and Clery, I., 2011. Apero, an open source bundle adjustment software for automatic calibration and orientation of set of images. 38(5), pp. 269–276.
Rondeau, M., Leblanc, E. and Garant, L., 2012. Dam in-frastructure first inspection supported by an integrated multi-beam echosounder MBES)/LiDAR system. In: Proceedings of
the Canadian Dam Association annual conference, Saskatoon, Canada.
Szeliski, R., 2010. Computer Vision: Algorithms and Applica-tions. 1st edn, Springer-Verlag New York, Inc., New York, NY, USA.
Tsai, R., 1987. A versatile camera calibration technique for high-accuracy 3D machine vision metrology using off-the-shelf tv cameras and lenses. IEEE Journal on Robotics and Automa-tion3(4), pp. 323–344.