DESIGN OF AN INTELLIGENT INDIVIDUAL EVACUATION MODEL
FOR HIGH RISE BUILDING FIRES BASED ON NEURAL NETWORK WITHIN
THE SCOPE OF 3D GIS
U. U. Atila a, I. R. Karas b, M . K. Turan c, A. A. Rahmand
a
Ankara MYO, Gazi University, Ankara, Turkey- [email protected] b
Department of Computer Engineering, Karabuk University, Karabuk, Turkey - [email protected] c
Department of Computer Engineering, Karabuk University, Karabuk, Turkey - [email protected] d
Department of Geoinformatics, UniversitiTeknologi Malaysia, Johor, Malaysia- [email protected]
Commission III WGIII/4
KEY WORDS : 3D-GIS, Network Analysis, Evacuation, Navigation, Intelligent Routing, M ultilayer Perceptron
ABS TRACT:
One of the most dangerous disaster threatening the high rise and complex buildings of today’s world including thousands of occupants inside is fire with no doubt. When we consider high population and the complexity of such buildings it is clear to see that performing a rapid and safe evacuation seems hard and human being does not have good memories in case of such disasters like world trade center 9/11. Therefore, it is very important to design knowledge based realtime interactive evacuation methods instead of classical strategies which lack of flexibility.
This paper presents a 3D-GIS implementation which simulates the behaviour of an intelligent indoor pedestrian navigation model proposed for a self -evacuation of a person in case of fire. The model is based on M ultilayer Perceptron(M LP) which is one of the most preferred artificial neural network architecture in classification and prediction problems. A sample fire scenario following through predefined instructions has been performed on 3D model of the Corporation Complex in Putrajaya (M alaysia) and the intelligent evacuation process has been realized within a proposed 3D-GIS based simulation.
1. INTRODUCTION
One of the most dangerous disaster threating the high rise and
complex buildings of today’s world including thousands of
occupants inside is fire with no doubt. Especially after 9/11 disaster, one of the most important research area is evacuating the buildings through the shortest path with safety in a case of extraordinary circumstances (i.e. disastrous accidents, massive terrorist attacks) happening in complex and tall buildings of
today’s world.
In research environments, two main approaches to indoor evacuation systems are currently accepted. One is 3D modelling environment that this study follows and the other is fire simulation models. Originating from 3D modelling environment, evacuation and routing is based on graph networks (Karas et al. 2006, Jun et al. 2009), while 3D visualization problems achieved by CityGM L (Kolbe 2008) and most studies used to work with Lee's Node Relation Structure on 3D network construction (Lee, J., 2001).
Disasters such as world trade center 9/11 have made researchers attempt to use GIS technologies in response to disasters occurring in microspace of multilevel structures such as interior of the buildings in urban areas. M ost of the navigat ion systems
use 2D or 2.5D data to find and simulate the shortest path route which is lacking in building environment. These systems have limitations in geometric and topological representations of complex structures of buildings at 3D. These limitations complicate to understand and analyse human behaviour in microscale environments such as high office buildings, shopping centers etc. (Lee, J., 2007; M usliman and Rahman 2008).
Researchers following the network approach generally modify the existing 2D routing algorithms to the 3D aspect (Lee, J., 2001; Karas et al., 2006; M usliman and Rahman 2008). M ost popular algorithm has been Dijkstra's for this purpose (Dijkstra, E. W., 1959). The lack of using Dijkstra's algorithm in dynamically changing networks has led some researchers to develop approaches on dynamic routing in which they modify Dijkstra's algorithm (G. Ramalingam and T. Reps, 1996; V. King, 1999; C. Demetrescu and G.F. Italiano, 2003).
Kwan and Lee (2005) examined the potential of using real-time 3D GIS for the development and implementation of GIS-based intelligent emergency response systems (GIERS) that aim at facilitating quick emergency response to terrorist attacks on multi-level structures. They have measured the relative accessibility of emergency response between a disaster site within a building and an emergency station in order to evaluate
ISPRS Annals of the Photogrammetry, Remote Sensing and Spatial Information Sciences,
the potential benefit of a 3D GIS for improving the speed of emergency response within microscale areas (Kwan and Lee, 2005). They observed that extending conventional 2D GIS to 3D GIS representations of the internal structures of high-rise buildings can significantly improve the overall speed of rescue operations. Their findings have motivated other geospatial scientists to develop intelligent emergency evacuation systems for complex buildings using 3D GIS (M eijers, Zlatanova, and Pfeifer 2005).
In another study, Lee has developed a 3D Navigable Data M odel based on the 3D Geometric Network Data M odel. In their study they proposed an indoor navigation model based on the Dijkstra algorithm to identify optimal routes within a multilevel structure (Lee, J., 2007).
Network modelling based evacuation approaches have concentrated on a modification of Dijkstra's shortest path algorithm with distance or time as edge weights. Evacuation of a building in case of emergency requires the evaluation of various human and environmental factors such as distribution of people inside the building, avoided exits, interactions of people with each other, their physical features, behaviour of people with disabilities, architectural structure of the building and the management of elevators. Human related factors in regard to emergency situations are indicated by some researchers but there is still a lack of appropriate routing algorithm for evacuation purpose (Pu and Zlatanova 2005). M eijers et al. (2005), Lee (2007) and Lee and Zlatanova (2008) acknowledge this deficiency.
Beside 3D modelling approaches, crowd simulation modelling methods have been developed to predict emergency situations and to evaluate interior design for planning purpose. During the last decade, pedestrian flow and evacuation have attracted the attention of researchers (Kuligowski, E. D. 2005; Pelechano, N.; M alkawi, A. 2008). For emergency situations, modifying evacuation model based simulators has become a main goal to the researchers to provide protection in pedestrian facilities such as fire safety protection (Lo, 1999; Zhao, Lo, Lu, and Fang, 2004).
Although it is aimed to guide human behaviour under certain conditions both in network model and simulation model based approaches, connection with the real time building environment is missing. While simulation models have been developed from user perspective taking into account the individuality and physical state of human beings (gender, body type, age etc.) which lack of thorough semantic model of urban space, network based approaches have been limited to networks without a connection to the actual building structure. Therefore, both approaches are inadequate in one or more particular interests of urban planning (Vanclooster, A. et al., 2010).
Routing someone to an appropriate exit in safety can only be possible with a system that can manage and use spatial data of 3D topological transportation network of a building. In such systems also called navigation systems, realizing an evacuation
of a building by guiding people in real time requires to implement complex analysis on 3D spatial data. Therefore, simulation process of our intelligent indoor individual evacuation model proposed in this study is directly related to formalization of 3D GIS environment with the abilities mentioned above.
In this study it is intended to explain the design of an intelligent individual evacuation model and focus on integration of this model with a 3D-GIS based simulation for demonstrating an individual evacuation process. Our proposed model considers the physical conditions of the environment and the properties of the person to be evacuated and produce the personalized instructions in real-time for providing a safe evacuation using the most appropriate routes for the user in emergency situations of high buildings. In the study, M ultilayer Perceptron (M LP) which is well known and widely used neural network structures was used for proposing intelligent evacuation model.
All samples highlighted in this paper are on a 3D model of Corporation Complex in Putrajaya, M alaysia. Section 2 presents the properties of high rise building fires and critical factors affecting fire response performance of people inside a building. From Section 3 to Section 6 we elaborate our proposed intelligent indoor individual evacuation model, data generation process and neural network structure proposed for the model. Section 7 gives a sample fire evacuation scenario of an individual and presents the integration of our intelligent routing model within a 3D-GIS based simulation.
2. FIRE AND HIGH RIS E BUILDING FIRES
Fire by definition is " A rapid oxidation process with the evolution of light and heat in varying intensities". Fire is a chemical process where by a fuel combines with Oxygen in the presence of heat source. This process will continue as long as there is fuel, oxygen and heat (John Jay College of Criminal Justice,2001a).
Fire occurrences came into being with the discovery of fire and are closely related to the evolution process of human being. Fire is also one of the most important threat for the high rise complex buildings of today's world with thousands of occupants inside. Well, the first question to be answered is "What is high-rise building?". According to NFPA (National Fire Protection Association), high-rise building is a building more than 75 feet (23 meters) in height, measured from the lowest level of fire department vehicle access to the floor of the highest story to be occupied. A height of 75 feet translates into roughly seven stories (John R. Hall, 2011). So, what are the main differences between high-rise building fires and the lower-height building fires when considered from a fire life perspective?
The existence of multiple, occupied floors, one on top of another usually means a higher concentration of occupants and greater potential fuel load of the building.
ISPRS Annals of the Photogrammetry, Remote Sensing and Spatial Information Sciences,
The probability of a large uncontrolled fire moving upward is of concern in a high rise building because of its vertical nature.
The more individuals assembled in one location at any one time, the more likely it is that some of these people could be injured or killed, particularly by an incident occurring close to them.
Depending on the location of an emergency, there may be a delay in reaching the area to provide assistance.
Evacuation of occupants when an emergency occurs is hampered by the fact that large number of people (sometimes hundreds, but possibly thousands when it is a large office building) cannot all leave the structure at once via elevators or emergency exit stairwells.
Access by the fire department from both outside and inside the building may be restricted.
Delivery of fire personnel and their equipment to the fire may be blocked by very hazardous falling glass which may cut hose lines and injure personnel.
The effect of wind, internal air circulation and difference in the temperature increase the effect of smoke and hot air.
Construction of high rise buildings without windows complicate the evacuation of smoke.
Open office plans increase the risk for the spread of fire from one location to another (Geoff C., 1996).
The items given above can help us to consider about the difficulties for rapid and safe evacuation of high rise buildings and can summarize the need for an intelligent system that will provide understandable and clear information to all users in real time and resolve concerns of them during evacuation process. This is what motivated us for proposing an intelligent routing model for emergency situations such as fires occurring in high and complex buildings.
2.1 Critical Factors Affecting Fire Response Performance
The assessment of the capacity to move out of the building has usually been based on mobility . However, the literature on fires and human behaviour has shown that fire response performance have to be considered in case of fire (M .Kobes et al, 2010).
Fire response performance is an individual’s ability to perceive
and interpret signs of danger, and make and carry out decisions aimed at surviving a fire. There are generally three factors determine the degree of fire response performance in the event of fire in a building. These are as follows (M .Kobes et al, 2010):
Fire characteristics.
Human characteristics.
Building characteristics.
The first factor that has direct influence on the degree of fire response performance is the nature of fire itself. Human behaviour is affected by the fire hazards and its effects on escape constitute the type of danger involved. The critical factors are the perceptible characteristics of the fire, namely its
growth rate, smoke yield, toxicity, and heat generated (M .Kobes et al, 2010).
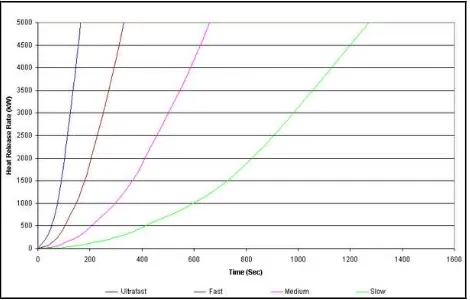
Fire growth rate represents the heat release rate of the fire over time (kW/s). Fire growth rate is an important factor in determining fire fatality since many fatal incidents are characterised by rapid fire development after its initial discovery. In 1972, Heskestad first proposed that for these early times, the assumption that fires grow according to a power law relation works well and is supported by experimental data. He suggested fires of the form:
where;
Q = the rate of heat release (kW) c = fire intensity coefficient (kW/snn) t = time (sn)
It was shown that for most flaming fires (except flammable liquids and some others), n=2, the so called T -squared growth rate. A set of specific T-squared fires labelled slow, medium, fast and ultra-fast with fire intensity coefficients such that the fires reached 1055 KW in 600, 300, 150 and 75 seconds (Figure-1) (Bukowski, P.E, 1996; NFPA 92B).
Figure 1. NFPA fire growth rate curves.
Temperature effect varies with the length of exposure, humidity and breathability. Intense illness may occur with temperatures
as low as 50 ºC and temperatures above 65 ºC causes
deformation. Temperatures above 100 ºC will cause death. The following table shows the physiological effects of heat (Table-1) (John Jay College of Criminal Justice, 2001b).
ISPRS Annals of the Photogrammetry, Remote Sensing and Spatial Information Sciences,
Physiological Effects Temperature (ºC)
Possible heat stroke 60
Able to tolerate temperature for 49 minutes
82
Very rapid skin burns in humid air
Temperature limit for escape 148
Rapid, unbearable pain to dry
Table 1. Physiological effects of heat.
While people move or remain within the building, they may be exposed to smoke and toxic products of combustion. The exposure is generally quantified in terms of a Fractional Effective Dose (FED). FED depends on the concentration of toxins within fire gases and the duration of exposure. In the smoky environment, stamina limits depends on the concentration of a combustion product or smoke optical density since these prevent escape when the critical value is reached. Other limits depend on concentration and likely time of exposure and often related to FED. Although there are no standard values, the following may be taken as rules of thumb for the common parameters affecting building occupants (Chitty, R. and M itchell, J. F., 2003).
Clear layer height 1 m above head (for small rooms /corridors)
Table 2. Stamina limits in smokey environment.
Apart from the risk of fire, the human factor also influence the fire response performance which is related to how people behave during fire. In terms of human characteristics, the critical elements are individual, social, and situational features (M .Kobes et al, 2010).
There are individual factors that will determine how we will act under fire situations. How we react to heat, smoke and flame is based on following (John Jay College of Criminal Justice,
o mobility ( weight, flexibility, muscular/skeletal diseases )
Respiratory capacity
Disability of a person also has a verse impacts on fire response performance. The disabilities may impose on a person's ability to be aware of, react and escape from a developing fire. Physical disabilities may affect speed of movement and prohibit certain routes being used unaided (eg wheelchairs on stairs) (Chitty, R. and M itchell, J. F., 2003).
The majority of fire deaths are result of smoke inhalation. Because of this people's respiratory capacity is critical to their survival. Chronic diseases such as emphysema or asthma will lower this capacity. Acute conditions such as flu, pneumonia will also have an effect on capacity (John Jay College of Criminal Justice,2001b).
The studies showed that behaviour of individuals varied by sex. The male were predominate in the fire fighting aspects and females were predominately concerned with alerting others and helping them leave the building (John Jay College of Criminal Justice,2001b).
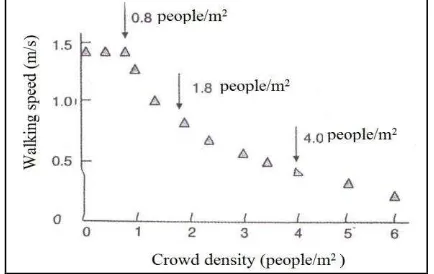
Another influential individual factor is speed of movement and this varies by several individual properties. Young adults walk faster than elderly people or children and men walk faster than women. Distribution of people inside building is also an important factor which affects speed of movement. In crowded conditions, people can walk unimpeded, however, as the crowd density increases, movement slows down and at some point effectively stops (Figure 2) (Chitty, R. and M itchell, J. F., 2003).
Figure 2. Walking speeds depending on the crowd density .
ISPRS Annals of the Photogrammetry, Remote Sensing and Spatial Information Sciences,
Another critical factor is familiarity with the layout of a building. The factors that influence exit choice are complex, and quantitative data is scarce. In quantitative terms, people tend to stick to familiar routes. A distinction can therefore be made between buildings where the occupants are familiar with the geometry (eg office workers), and buildings where they are not (eg public assembly) (Chitty, R. and M itchell, J. F., 2003).
3. INTELLIGENT INDOOR EVACUATION MODEL
When we consider high population and the complexity of high rise buildings it is clear to see that performing a rapid and safe evacuation seems hard and human being does not have good memories in case of such disasters like world trade center 9/11. In such cases, panic, gathering, mashing each other and having difficulties to reach exits is inevitable. Therefore, it is very important to design knowledge based real-time interactive evacuation methods instead of traditional strategies which lack of flexibility.
Traditional fire evacuation systems having components such as smoke, heat, radiation-sensitive sensors, alarm systems and emergency warning lights are quite insufficient for today's modern buildings due to their lack of flexibility . Evacuation systems which are prepared in accordance with pre-defined evacuation scenarios are not capable of routing according to the knowledge of what is inside the building during and after the occurrence. This may lead to direct people to the paths which are closed or have gas leaks.
Increasing human needs, constantly changing and evolving comfort conditions, efforts to improve energy efficiency and to create a high level of fire safety in high rise, complex and crowded buildings has given birth to the need for the establishment of systems with variety of disciplines and this has put forward the concept of Intelligent Building. In recent years, the strengthening of fire alarm systems with intelligent control techniques and the development of wireless sensor network technology have helped achievement of more intelligent and powerful fire safety systems which is one of the sub-systems of intelligent buildings. To be able to control all subsystems of a smart building by Building M anagement Systems within the framework of a common communication protocol has led to create the technological infrastructure that allows developing more flexible, dynamic and mobile interactive evacuation models than traditional ones.
Emergency situations are not static events but rather dynamic and uncertain. An ideal evacuation and routing system should be capable of taking into account and evaluate the status of users or user groups and produce special evacuation instructions according to these users or user groups. The stage in which people spend most of time in case of emergency is not reacting or taking action but rather the stage of realizing the event before starting to move. Uncertainty at the time of the emergency and the lack of clear information about the incident are factors in delaying the evacuation of the building. Therefore, a system that can provide understandable and clear information to all users in
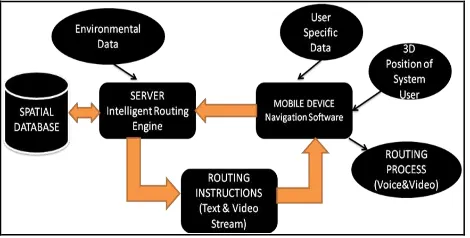
real time and resolve concerns of them will surely shorten the evacuation process. Such an ideal system is a smart evacuation system that should avoid congestion by sharing people in different paths or guide people to areas of risk (smoky and dangerous) to be taken in cases of necessity without the need for the user to determine the route and allow them to progress rapidly without hesitation (Figure 3).
Figure 3. Components of an intelligent indoor evacuation model.
To realize an ideal intelligent indoor evacuation system, a number of main functionalities should be addressed. These functionalities are a spatial database for the management of large spatial datasets, 3D GIS based routing engine centralized in an appropriate host, mobile based navigation software for passing user related data to the host and present routing instructions routing process of an indoor evacuation system gain intelligence. The aim of our proposed model is to take into count the environmental and user specific variables in case of fire occurring in a building and generate evacuation instructions needed till the user reaches the exit in safety by predicting the usage risk of links on transportation network of a building. The environmental and user specific variables which have been presented in Section 2.1 briefly, has been taken as input factors of neural network proposed in this study to build our intelligent evacuation model.
Because there is no resource to obtain data needed for our study, we have generated our own data in respect to literature on critical factors affecting fire response performance. To create our universal data set we firstly have formed the risk levels for each factor and transformed their values into [1-5] system (Table 3).
ISPRS Annals of the Photogrammetry, Remote Sensing and Spatial Information Sciences,
Num Factor name Real values T ransformed
Table 3. Used factors and their risk values.
Three factors including Physical Disability, Alter native Ramp and Link Type have been considered together as one factor
Table 4. Numerical demonstration of triple risk values.
By obtaining all combinations of 16 factors given above with each other, totally 49.766.400 records have been generated. After extracting meaningless combinations, we had 14.817.008 records which constitute the universal set for our problem.
For calculating the risk score of each record in universal set properly, we need to weight each factor to provide priority order. For this purpose we have prepared a survey in which 78 people have participated to determine the weight of each factor on risk score calculation. With this survey we also aim t o transfer people's perceptions on the factors affecting fire response performance. In the evaluation process of the survey results, we have referred to the opinions of three experts on fire evacuation. We have used corresponding value of Fibonacci series for each priority order as shown in Table 5.
Fibonacci series was discovered by an Italian mathematician Leonardo Pisano Bogollo (Fibonacci). The Fibonacci series of numbers can be defined in the form of an infinite sequence, thus:
N1, N2, N3, N4, ...,
where N1 and N2 may be given any value and each successive term is the sum of the two previous terms. The most interesting Fibonacci series, generally called basic Fibonacci numbers is that in which N1=1 and N2=1, thus:
1, 1, 2, 3, 5, 8, 13, 21, 34, 55, 89, …;
this series has extraordinary arithmetic properties (A. M organ-Voyce, 1959). There is a special relationship between Fibonacci
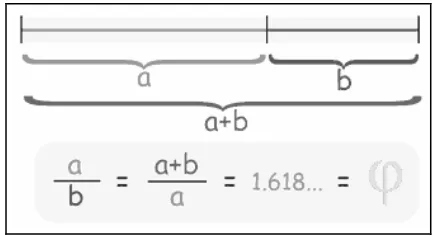
Sequence and Golden Ratio (φ). The ratio of any two successive (one after the other) Fibonacci numbers is very close to Golden Ratio which is approximately 1.618. The bigger the pair of Fibonacci numbers, the closer the approximation. The idea behind Golden Ratio is easy. If we divide a line into two parts so that the longer part divided by the smaller part is also equal to the whole length divided by the longer part. Then we have the Golden Ratio (Figure 4) (M ath is Fun, 2013).
Figure 4. Caluculation of the Golden Ratio.
The Golden Ratio is used in various fields such as geometry, astronomy, botany, architecture, financial markets and so on. For more information on Fibonacci Sequence and Golden Ratio you can see the related references.
ISPRS Annals of the Photogrammetry, Remote Sensing and Spatial Information Sciences,
Priority Order Factor Name Priority Weight
1 Physical Disability 1597
2 Respiratory Disease 987
3 Visibility 610
4 Fire Growth Rate 377
5 T emperature 233
6 Gas Mask 144
7 Carbon monoxide
concentration 89
8 Population 55
9 Fire Protection Wear 34
10 Link Length 21
11 Familiarity with Building
Geometry 13
12 Joint -Muscle Disease 8
13 Body T ype 5
14 Age 3
15 Heart Disease 2
16 Sex 1
Table 5. Priority order of the factors affecting the fire response performance.
To calculate the risk score of each record we have used cumulative sum of 16 factors as given below.
Total Risk = (Weight1 x Risk Value1) + (Weight2 x Risk Value2)+ ... + (Weight16 x Risk Value16)
As we need to submit risk scores to neural network to make it learn from samples we need to formalize output data for each record in universal set. In the study, the output factor (i.e., risk score) has been converted into five-level categorical variable ranging from "very high" to "very low" as given in Table 6.
Risk Score Risk Category
Less than 4400 VERY LOW
4400-4600 LOW
4600-5600 MEDIUM
5600-6600 HIGH
More than 6600 VERY HIGH
Table 6. The output factor used in the study .
We have used binary coding method for numerical representation of output factor in dataset. As we have five-level categorical variable to represent output of our method we have five binary coded fields in our dataset as shown in Table 7.
Risk Category
Output 1
Output 2
Output 3
Output 4
Output 5
1 1 0 0 0 0
2 0 1 0 0 0
3 0 0 1 0 0
4 0 0 0 1 0
5 0 0 0 0 1
Table 7. Binary coding of output factor in the study .
5. S TRUCTURE OF THE US ED ARTIFICIAL NEURAL NETWORK
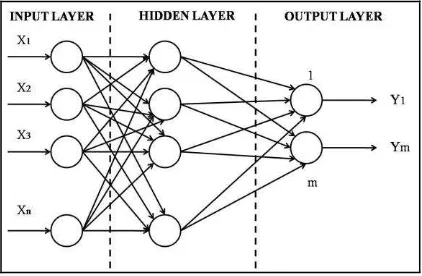
In the study we have used M ultilayer Perceptron (M LP) as a neural network structure. M LP is one of the most frequently used neural network architectures in both classification and prediction purposes and it belongs to the class of supervised neural networks. M LP consists of a network of nodes arranged in layers. The general structure of M LP consist of three or more units arranged in layers of processing nodes: an input layer that receives external inputs, one or more hidden layers and an output layer that produces the classification results (Figure 5). Each node in M LP can be modelled as an artificial neuron (Figure 6) (Yan, H. et. al, 2006).
Figure 5. Architecture of a M LP neural network.
Figure 6. A node of M LP: an artificial neuron.
In the M LP, each neuron j in the hidden layer computes the sum of input xi weighted by respective connection weight wij and calculates its output yjas a function of the sum.
ISPRS Annals of the Photogrammetry, Remote Sensing and Spatial Information Sciences,
),
where f is the activation function which transforms the weighted sum of all signals to a neuron as multiplier. Here, activation function (f) can be a simple threshold function or a sigmoidal, hyperbolic tangent, or radial basis function. The sum of squared differences between desired and actual values of output neuron e is defined as follows:
where ydj and yj are the desired and actual value of output neuron j respectively. Each weight wij is tuned to reduce the value e immediately. How wij is tuned depends on the training algorithm adopted (Ubeyli, E. D. and Guler, I., 2004).
6. TRAINING AND TES T RES ULTS OF MLP
In our training process we have used 30.000 randomly selected records from the universal set. We have developed a software to maintain works with neural network models using Java programming language in Netbeans platform. Our all data used for training and testing is stored in Oracle database.
In this study, M LP is designed in three layers including an input layer, two hidden layers and one output layer. In the input layer we have 16 neurons and in the first and second hidden layers we have used 10 and 8 neurons respectively. In the output layer we have 5 neurons representing each risk level. We have used backpropagation algorithm with adjusted training parameters (momentum and learning rate) as the training method and used sigmoid activation function in all layers of M LP.
All training parameters used are shown in Table 8.
Parameter Description M omentum 0.5
Learning rate Ranging from 0.1 to 0.5 Presenting
Tolerance: Progression of error less than 0.000001 during 200 iterations.
Table 8. Training parameters used for proposed M LP.
The training has been performed 10 times for varying M LP parameters and average error values has been obtained as given in Table 9.
In the test phase we have used 1000 randomly selected records from universal set which are not used in training phase to show the success rate of M LP accurately. The best results have been
obtained when the learning rate is set to 0.1 and momentum is set to 0.5. The success rate shows the percentage of correctly predicted records. In the study, best prediction result has been found as 93.8% (Table 9).
Table 9. The error value and percentage of success according to different M LP parameters.
7. 3D S IMULATION OF INTELLIGENT INDOOR INDIVIDUAL EVACUATION MODEL
The intelligent routing engine which works integrated with our proposed M LP model is the most important part of our intelligent indoor evacuation model and is responsible to produce real time instructions for the users to assist them accurately till they arrive destination. For testing the evacuation model we have used our 3D GIS based implementation presented in our previous study (Atila, U., et. al, 2012). The application is a Java based 3D-GIS environment which can visualize 3D building models in CityGM L format and perform network analysis on a transportation network of a building.
We have done the required coding to integrate our proposed M LP with routing engine for evacuation purpose. Our proposed simulation environment produces the input variables (eg. temperatures, fire growth rates, populations, visibilities etc.) needed by M LP model for each link in the transportation network within a scenario.
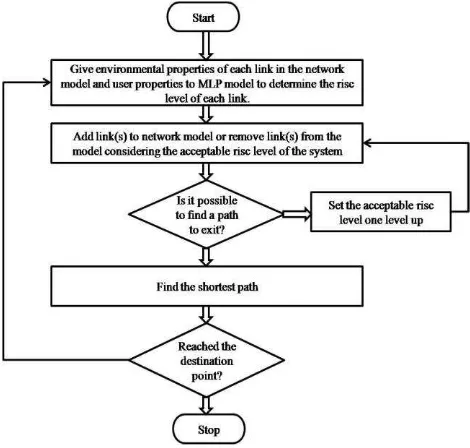
In the beginning the acceptable risk level of the system is set to be "LOW". It means that, with the start of the evacuation, only links having "VERY LOW" and "LOW" risk levels will be able to use to find a shortest path to the destination and the others will be avoided. The flow chart given below explains the intelligent evacuation process briefly (Figure 7).
ISPRS Annals of the Photogrammetry, Remote Sensing and Spatial Information Sciences,
Figure 7. Evacuation process.
7.1 Fire Evacuation S cenario
The scenario has been constructed in 3D model of Corporation Complex in Putrajaya, M alaysia. We are able to run our simulation within predefined scenarios stored in database. In the scenario, when and on which link an event will occur can be defined. In addition, user profile to be evacuated, time for the alarm, time for starting evacuation, start and target points can be defined in the scenario as well. Table 10 shows the meaning of the colors assigned on links during the simulation.
Color Description
YELLOW There is a burning fire, but not closed for use yet
GRAY Has smoke or carbon monoxide, but not closed for use yet
RED Avoided link
BLACK The shortest path offered by the system
Table 10. Color descriptions in the simulation.
So, let's see how our intelligent evacuation model reacts in case of fire accident. Assume that Ismail has been in the 8th floor of a 10 floor building when the fire accident has occurred in the ground floor and smoke expands to upper floors very quickly. Just after the fire alarm all the elevators have been positioned in the ground floor and not responding calls from floors (red lines in Figure 8). Shortly after, voice instructions have been heard asking people to never try to use elevators and evacuate from proper exits relevant to their floor number following evacuation lights which have been turned on indicating the direction of exits.
Figure 8. Evacuation scenario (Scene-1).
Suddenly, Ismail feels that his mobile device vibrates asking him whether he wants to get instructions to go out of the building. He realizes that his mobile device follows the path to the nearest stairs and tells him to go downstairs just as voice from speakers. According to his mobile device there has been “LOW” risk for him in the stairs but this is not as much to prevent him to use the stairs (Figure 9).
Figure 9. Evacuation scenario (Scene-2).
Ismail goes downstairs without hesitation till he arrives 3rd floor. Although voice instructions still wants him to go downstairs till ground floor, his mobile device finds an alternative shortest path because there has been a link on his way with “M EDIUM” risk level which is not acceptable by the routing system (Figure 10). So, the system has found an alternative path which does not include any link with the
“MEDIUM” or higher risk level. Ismail follows his mobile
device’s instructions and arrives the exit safely.
ISPRS Annals of the Photogrammetry, Remote Sensing and Spatial Information Sciences,
Figure 10. Evacuation scenario (Scene-3).
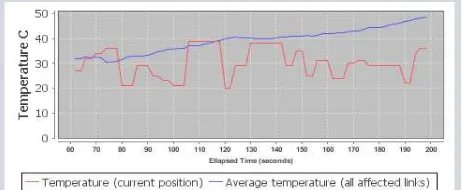
We have prepared four different charts (Figure 11-14) for better explaining the evacuation process and for comparing the situation of the links traversed by the user with the situation of all links affected by fire. These charts show the temperature, fire growth rate, carbon monoxide density and visibility values occurring during fire evacuation respectively. The status of the links traversed by the user is shown by a red line and the average value of each parameter occurring on all links affected by fire is shown by blue line.
As seen in all charts, our intelligent individual evacuation model routes the system user to the links having more appropriate situation than the average status values of all links affected by fire.
Figure 11. Temperature-time chart.
Figure 12. Fire growth rate-time chart.
Figure 13. Carbon monoxide density -time chart.
Figure 14. Visibility -time chart.
The evacuation process is completed in 198 seconds. As seen in Figure 11, the temperature values of the links that user has been guided during evacuation process is generally lower than the average temperature values of all links affected by fire. Figure 12 shows that the user has been guided to the links that has no blazing fire occurrence. Figure 13 shows that the user has never been guided through a link with carbon monoxide. Figure 14 shows that the links that user has been guided through has always more visibility than the average visibility of all links affected by fire.
8. CONCLUS IONS
This paper has suggested a novel method of evacuation from buildings in case of fire accident considering human and environment factors using a M LP (M ultilayer Perceptron) network which is one of the most preferred classification method of artificial neural networks. Our trained M LP network estimates risk levels of links in the path during evacuation with a prediction accuracy of 93.8%.
For better understanding the intelligent routing process, an evacuation simulation which works integrated with M LP network has been developed and presented in this paper. The simulation is based on a Java based 3D-GIS implementation which can visualize 3D building and network models from CityGM L format and perform analysis on a 3D network stored in Oracle Spatial’s Network Data Model.
Our proposed model is promising for organizing more flexible, dynamic and user centric mobile interactive evacuation models. With the advancements in mobile and wireless technologies we probably will see intelligent building evacuation strategies in the near future.
ISPRS Annals of the Photogrammetry, Remote Sensing and Spatial Information Sciences,
9. REFERENCES
Atila, U., Karas, I.R., Rahman,A.A., 2012. A 3D-GIS Implementation for Realizing 3D Network Analysis and Routing Simulation for Evacuation Purpose. Pr ogr ess and New Tr ends in 3D Geoinfor mation Sciences, Ser ies: Lectur e Notes in Geoinfor mation and Car togr aphy, Springer, New York, pp. 249-260.
Bukowski, P.E., 1996. Fir e Hazar d Assessment, NFPA Fire Protection Handbook, 18th ed., J. Linville, ed., NFPA Boston, M A.
Chitty, R., M itchell, J.F., 2003. Fire Safety Engineering A Reference Guide. Building Research Establishment, London, pp. 2-30, 44-54. with graphs. Numer ishe Matematik 1, pp. 269-271.
Fibonacci Series from web site titled “Math is Fun”,
http://www.mathsisfun.com/numbers/fibonacci-sequence.html (01.08.2013).
Geoff C., 1996. High-r ise Secur ity and Fir e Life Safety. British Library Publication, pp. 28-33.
John Jay College of Criminal Justice, (2001b). Introduction to Fire Science Section 1, Unit 4. Human Behavior and Fire , Flannery Associates.
John Jay College of Criminal Justice, (2001a). Introduction to Fire Science, Section 2, Unit 1, Fire Behaviour, Flannery Associates.
Karas, I.R., Batuk, F., Akay, A.E., Baz, I., 2006. Automatically extracting 3D models and network analysis for indoors. In: Abdul-Rahman, A., Zlatanova, S., Coor s, V. (Eds.) Innovation in 3D-Geo Infor mation System. Berlin, Springer, pp. 395-404.
King, V., 1999. Fully dynamic algorithms for maintaining all-pairs shortest paths and transitive closure in digraphs. In: Pr oc. 40th IEEE Symposium on Foundations of Computer Science (FOCS’99), pp. 81–99.
Kobes, M ., Helsloot, I., Vries, B., Post, J.G.,2010. Building safety and human behaviour in fire: A literature review. Fir e Safety Jour nal, 45 pp. 1-11.
Kolbe, T.H., 2008. Representing and exchanging 3D city models with CityGM L. In Lee, J., Zlatanova, S.: 3D Geo- Infor mation Science. Springer-Verlag, Berlin, pp. 15-31.
Kuligowski, E. D., 2005. A Review of Building Evacuation M odels. Technical Note 1471. National Institute of Standards and Technology.
Kwan, M .P., Lee, J., 2005. Emergency response after 9/11: the potential of real-time 3D GIS for quick emergency response in micro-spatial environments. Computer s, Envir onment and Ur ban Systems, 29, pp. 93-113.
Lee, J., 2001. 3D Data M odel for Representing Topological Relations of Urban Features. Pr oceedings of the 21st Annual ESRI Inter national User Confer ence, San Diego, CA, USA.
Lee, J., 2007. A three-dimensional navigable data model to support emergency response in microspatial built-environments. Annals of the Association of Amer ican Geogr apher s, 97(3), pp. 512-529.
Lee, J., Zlatanova, S., 2008. A 3D data model and topological analyses for emergency response in urban areas. In: Zlatanova, S, Li, J.: Geospatial Infor mation Technology for Emer gencyResponse. Taylor and Fr ancis, London, pp. 143-168.
M eijers, M ., Zlatanova, S., Pfeifer, N., 2005. 3D Geo- Information Indoors: Structuring for Evacuation. In: Pr oceedings of Next Gener ation 3D City Models, Bonn, Germany .
M organ-Voyce, A., 1959, Ladder-network analysis using Fibonacci numbers Circuit Theory, IRE Tr ansactions, 6(3), pp. 321-322.
M usliman, I.A. and Rahman, A.A., 2008. Implementing 3D Network Analysis in 3D GIS. Inter national Ar chives of ISPRS, 37(B), Comm. 4/4, Beijing, China.
National Fire Protection Association, National Fire Codes, NFPA 92B.
Pelechano, N., M alkawi, A. 2008. Evacuation simulation models: challenges in modelling high rise building evacuation with cellular automata approaches. Automation in Constr uction 17(4), pp. 377–462.
Ramalingam, G. and Reps, T., 1996. An incremental algorithm for a generalization of the shortest path problem. Jour nal of Algor ithms, 21, pp. 267–305.
Ubeyli, E.D., Guler, I., 2004. Detection of electrocardiographic changes in p artial epileptic patients using Lyapunov exponents with multilayer perceptron neural networks. Engineer ing Applications of Ar tificial Intelligence,17(6), pp. 567-576.
Vanclooster, A., De M aeyer, P., Fack, V., 2010. On the way of integrating evacuation approaches. In: 5th Inter national Confer ence on 3D Geoinfor mation (3D GeoInfo Confer ence 2010), 38(4/W15), pp. 169-172.
ISPRS Annals of the Photogrammetry, Remote Sensing and Spatial Information Sciences,
Yan, H., Jiang, Y., Zheng, J., Peng, C., Li, Q., 2006. A multilayer perceptron-based medical decision support system for heart disease diagnosis. Exper t Systems with Applications,
30(2), pp. 272-281.
10.ACKNOWLEDGEMENTS
This study was supported by TUBITAK- The Scientific and Technological Research Council of Turkey (Project No: 112Y050) research grant. We are indebted for its financial support.
ISPRS Annals of the Photogrammetry, Remote Sensing and Spatial Information Sciences,