A NEAR-GLOBAL BARE-EARTH DEM FROM SRTM
J. C. Gallanta, 1, A. M. Reada
aCSIRO Land and Water, Clunies Ross St, Canberra ACT 2600 Australia - (john.gallant, arthur.read)@csiro.au
Commission IV, WG IV/3
KEY WORDS: DEM, SRTM, Bare earth, Smoothing
ABSTRACT:
The near-global elevation product from NASA’s Shuttle Radar Topographic Mission (SRTM) has been widely used since its release in 2005 at 3 arcsecond resolution and the release of the 1 arcsecond version in late 2014 means that the full potential of the SRTM DEM can now be realised. However the routine use of SRTM for analytical purposes such as catchment hydrology, flood inundation, habitat mapping and soil mapping is still seriously impeded by the presence of artefacts in the data, primarily the offsets due to tree cover and the random noise. This paper describes the algorithms being developed to remove those offsets, based on the methods developed to produce the Australian national elevation model from SRTM data.
The offsets due to trees are estimated using the GlobeLand30 (National Geomatics Center of China) and Global Forest Change (University of Maryland) products derived from Landsat, along with the ALOS PALSAR radar image data (JAXA) and the global forest canopy height map (NASA). The offsets are estimated using several processes and combined to produce a single continuous tree offset layer that is subtracted from the SRTM data.
The DEM products will be made freely available on completion of the first draft product, and the assessment of that product is expected to drive further improvements to the methods.
1. INTRODUCTION
The near-global elevation product from NASA’s Shuttle Radar Topographic Mission (SRTM) has been widely used since its release in 2005 at 3 arcsecond resolution and the release of the 1 arcsecond version in late 2014 means that the full potential of the SRTM DEM can now be realised. However the routine use of SRTM for analytical purposes such as catchment hydrology, flood inundation, habitat mapping and soil mapping is still seriously impeded by the presence of artefacts in the data, primarily the offsets due to tree cover and the random noise.
In Australia, access to the finer 1 arcsecond product was arranged in 2008 and methods were developed (Gallant et al., 2012; Gallant et al., 2011) to produce bare-earth and hydrologically enforced versions of the 1 arcsecond SRTM that are now the standard national elevation model for Australia and are distributed free of charge via http://nedf.ga.gov.au. The release of the full 1 arcsecond SRTM data allows similar methods to be applied to produce a near-global bare-earth DEM suitable for a wide range of purposes. Gallant et al. (2012) noted that the most significant obstacle for processing the global SRTM data was the need for consistent global tree cover maps at a suitable resolution, which did not exist at the time. Since then, two such products have emerged (Hansen et al., 2013 and Chen et al., 2015) opening the way for the work reported here.
This paper describes the current state of development of algorithms for producing a bare-earth DEM from the global 1 arcsecond SRTM data. The focus here is on the algorithms for removal of tree offsets. The subsequent step of adaptive smoothing will use the methods described in Gallant (2011). Drainage enforcement is an additional step that is required to ensure that rivers are represented by the DEM even in low relief areas. Methods to achieve this globally are being developed, utilising globally available data layers that identify water bodies from remotely sensed data.
2. METHODS
2.1 Data sources
The removal of tree offsets depends on an accurate map of where the SRTM elevations are affected by trees. Multiple sources of vegetation cover mapping are used to obtain the best maps of tree extent:
GlobeLand30 land cover classification (glc30) based on Landsat and other data (Chen et al., 2015), in UTM projection at 30 m resolution.
In addition to the tree classification the global forest canopy height map (canopyheight) of Simard et al. (2011) is used as an independent estimate of tree height. This data is provided in geographic projection at 30 arcsecond resolution (roughly 1 km).
Other data sources that were considered but not used are the ALOS PALSAR forest/non-forest map, which was found to be less useful than the raw image intensity data, and the SRTM image intensity data, which does not appear to provide a consistent discrimination between forested and non-forested areas.
2.2 Overview of processing steps
The tree offset removal method has a number of stages each described below:
Producing a composite tree presence-absence map from multiple sources
Adjusting the tree map to best fit the SRTM offsets
Estimating the offsets near edges of tree patches, from treecover2000 and from the Simard-Pinto heights segments of about 1/10th of a degree square to facilitate quick experimentation with algorithms and thresholds.
2.3 Tree presence-absence mapping
In the previous Australian effort the tree mapping was based on two different classifications of Landsat data and a fractional cover map similar to treecover2000. Thresholds for the fractional cover were chosen manually and a manual assessment was used to choose which cover maps would be used in different areas. In the current global implementation, the multiple sources of tree cover mapping are combined by first converting them to a value between 0 and 1 then summing the values and applying a threshold.
2.3.1 Conversion to fractions: The treecover2000 and palsar values are converted to a fraction using a piecewise linear fractional value. This process is still being developed and the results presented here use manually selected thresholds. The products of these transformations for treecover2000 and palsar are treefrac and palsarfrac. The glc30 data is set to 1 for class 20 (forest) and 0 for all other classes.
2.3.2 Linear feature mapping: In the Australian method we found that Landsat vegetation mapping could not capture narrow linear rows of trees, usually along roadsides, that clearly affected the SRTM data. The PALSAR radar imagery does capture these features well, although at a lower amplitude than more extensive tree cover, so a filter is applied to accentuate linear features in both east-west and north-south directions. The east-west filter kernel is:
⎝
and the north-south filter kernel is the same matrix transposed. The responses from the e-w and n-s filters are summed and converted to a linear feature fraction, linfrac, using the same piecewise linear transformation as above, with one modification: the maximum value is allowed to reach 1.5, which is greater than the threshold used in the next step so that the linear feature fraction can operate alone if it is sufficiently strong.
2.3.3 Combined tree presence-absence map: The composite map is produced by adding the four components and applying a threshold:
= + + + 30 (2)
= 1 > 1.3
0 ℎ (3)
The effect of this combination is that more than one of the four sources must contribute to tree presence (except for linfrac as noted above).
2.3.4 Optimising edge locations: The tree presence-absence map must match the edges of the raised patches in the SRTM quite closely for the offset removal to work well, so the patch edges are adjusted pixel-by-pixel to yield the best fit between the tree map and the SRTM heights.
2.4 Estimating tree offsets
The size of the elevation offset due to trees is estimated using three processes:
Estimation at patch edges using the SRTM heights directly
Estimation within larger patches using the correlation between tree cover and SRTM height
Deriving offsets from the tree height map within extensive areas of cover
2.4.1 Offsets at patch edges: The optimised presence/absence map is smoothed slightly using a Gaussian filter with standard deviation of 1 grid cell to account for the gradual response of the SRTM to abrupt vegetation edges. The height offset at the edges is estimated by fitting the parameters of a local height model:
= + + + + ℎ (4)
where , , and are the local ground height and slopes, ℎ is the tree-induced offset and is the smoothed tree map. The parameters are estimated for each pixel near a patch edge using pixels within a 5-cell radius. Provided the model fits acceptably well, ℎ is accepted as the local estimate of tree offset.
2.4.2 Estimating offsets from tree cover: A similar process can be applied to estimate the offsets from the tree cover fraction using the model:
= + ℎ ∙ (5)
where treefrac is the same tree fraction used in the tree presence-absence mapping. This relationship is expected to be consistent over a larger area than the edge offsets so the fitting can be conducted over larger patches; current
2.4.3 Deriving offsets from the forest canopy height map: In areas of continuous tree cover where the offsets cannot be estimated from changes in SRTM elevations the canopyheight data is used. SRTM offsets are typically much less than canopy heights, and a fraction of 0.5 is used. This factor may be subject to calibration in the future.
There is a clear relationship between the canopy height map and the tree cover map: areas with higher fractional cover (at the ~1 km scale of the canopy height map) have higher canopy heights. We are still exploring whether it is feasible to develop local relationships between canopy height and tree cover so that variations in tree offsets at the SRTM resolution can be estimated from the tree cover map.
2.5 Producing a combined tree offset surface
A method to combine the three offsets based on estimates of their relative variance is being developed, but for the experiments shown here we are using just the edge offsets where they are available and canopyheight modulated by treefrac.
3. RESULTS AND DISCUSSION
The method has been applied in the following locations:
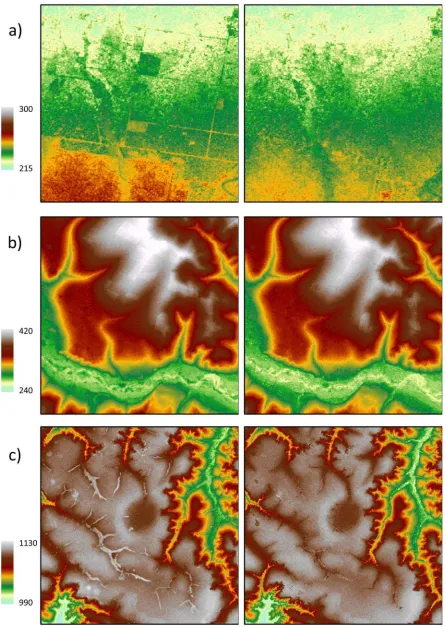
Eastern Australia (149.6°E, 30.4°S) : low relief with linear and blocky vegetation areas
Southern Brazil (52.9°W, 21.6°S): moderate relief with blocks of trees scattered across the landscape, and smaller tree patches in a floodplain
Southern Congo (24.3°E, 8.6°S): an incised undulating plateau with trees confined to drainage lines and steep escarpments
Testing and development of the methods are ongoing using an expanding set of test sites covering all continents.
The SRTM elevations before and after correction at the three locations are shown in Figure 1. In each case the majority of the artefacts due to vegetation canopy have been removed. There are also visible artefacts in each case due to the abrupt transition from the offset estimated at edges directly to the Simard-Pinto estimate. These artefacts will be reduced or eliminated with further development of the methods.
Some vegetation patches remain unaffected by the corrections, usually because the source maps (treecover2000, glc30 and palsar) do not show trees in those areas. In most cases this is due to time offsets between the SRTM and the other data and is most prevalent in areas affected by forest clearing or harvesting.
The combination of the three methods for estimating the tree-induced offset reliably removes abrupt height changes at the edges of tree patches, eliminating the obvious height discontinuities due to tree canopy, and removes spatially varying tree offsets in larger patches. This overcomes one of the key limitations of the original Australian method (Gallant et al., 2012) where heights were only estimated at patch edges and interpolated across the interior of patches, sometimes over very large distances.
4. CONCLUSIONS
The success of the experiments so far suggest that the production of a global bare-earth DEM from the 1 arcsecond SRTM data will be feasible. Once the methods to calibrate the thresholds used to relate the global tree canopy cover, Palsar radar intensity and canopy height data to tree-induced offsets are completed the algorithm will be applied to all SRTM tiles and the first draft product will be released for use and evaluation.
REFERENCES
Chen, J., Chen, J., Liao, A. and others, 2015. Global land cover mapping at 30 m resolution: A POK-based operational approach, ISPRS Journal of Photogrammetry and Remote Sensing, 103, 7-27.
Gallant, J.C., Dowling, T.I., Read, A.M., Wilson, N., Tickle, P. and Inskeep, C., 2011. 1 second SRTM Derived Digital Elevation Models User Guide. Geoscience Australia www.ga.gov.au/topographic-mapping/digital-elevation-data.html
Gallant, J.C., Read, A.M., Dowling, T.I., 2012. Removal of tree offsets from SRTM and other digital surface models. In: XXII Congress of the International Society for Photogrammetry and Remote Sensing, Melbourne, Australia.
Hansen, M. C., P. V. Potapov, R. Moore, M. Hancher, S. A. Turubanova, A. Tyukavina, D. Thau, S. V. Stehman, S. J.
Goetz, T. R. Loveland, A. Kommareddy, A. Egorov, L. Chini, C. O. Justice, and J. R. G. Townshend. 2013. High-resolution global maps of 21st-century forest cover change. Science 342 (15 November): 850–53. Data available on-line from: http://earthenginepartners.appspot.com/science-2013-global-forest.