Developing GIS-based Demand-Responsive Transit system in Tehran city
Hamed Faroqi a, 1, Abolghasem Sadeghi-Niaraki a
a Dept. of Geodesey & Geomatics, Excellency Centre of GIS, K. N. Toosi University of Technology- ([email protected],
KEY WORDS: Demand-responsive transport, GIS, User-based system, Sustainable transportation
ABSTRACT:
Create, maintain and development of public transport network in metropolitan are important problems in the field of urban transport management. In public transport, maximize the efficient use of public fleet capacity has been considered. Concepts and technologies of GIS have provided suitable way for management and optimization of the public transports systems. In demand-responsive public transportation system, firstly fellow traveller groups have been established for applicants based on spatial concepts and tools of GIS,
second for each group according to its’ members and their paths, a public vehicle has been allocated to them then based on dynamic
routing, the fellow passenger group has been gathered from their origins and has been moved to their destinations through optimal route. The suggested system has been implemented based on network data and commuting trips statistics of 1 to 6 districts in Tehran city. Evaluation performed on the results show the 34% increase using of Taxi capacity, 13% increase using of Van capacity and 10% increase using of Bus capacity in comparison between current public transport system and suggested public transportation system has been improved.
1 Corresponding author
1. INTRODUCTION
Transportation systems generally involve issues related to land use, demographic information, economic and environmental data. So a vast range of data and information should be considered together. Most information in transportation system is location reference data, i.e., the spatial dimensions. GIS is an appropriate tool for data integration, because the spatial dimensions can be communicated between different systems. The most important role of GIS is inserting spatial dimensions in transportation models. GIS-T focuses on analysis and planning in the application of GIS technologies for transportation issues. Urban transportation and traffic management systems are being developed using GIS and IT tools. Features such as traffic monitoring, traffic lights control, and the creation of new ITS areas have become possible using these technologies, which is an important step in the field of urban traffic management.
One of the effective factors for performance of urban transportation is traffic. One important feature of the traffic is
its flow’s direction. Traffic direction usually has a constant
trend during weekdays of flowing from residential areas to commercial areas, offices, and schools in the morning rush hours and the reverse in the evening rush hours. This can have an important share in pattern detection of traffic movement.
Regarding predictable direction of traffic’s flow, some innovative traffic management’s systems are proposed, such as Ride-Sharing and DRT.
Citizens of metropolitans usually are dissatisfied with public transportation systems due to inefficiency in the scheduling, traveling through area with low travel demand, and following a fixed route for public vehicles (any kinds of vehicles that are used by general public for commuting, i.e., bus, taxi, and etc). One method of increasing the efficiency of public transportation is demand responsive transit (DRT), in which public vehicles do
not follow a fixed path or a fixed schedule but travel based on travel demand in a present and dynamic way according to various factors. The DRT method, including public vehicles, is based on existing demands in different directions providing service. Mobile Internet allows users to register their travel demand in the system immediately and enables the central system, after data collection, to assign a vehicle to each group of passengers based on existing methods. The proposed route is determined based on different parameters. The main idea of this method was to assist people with disabilities in the 1970s from house to house in Great Britain. Its major problems were real-time routing impossibility and last minute travel process disability.
In Tehran city, there is a developed public transportation network including metro, bus, bus rapid transit, and taxi modals. However, regarding to increasing population and
commuters’ demands, the public transportation system does not
satisfy the citizens. So, there is a necessity for developing the current public transportation system using demand-based solutions such as ride-sharing and DRT. Also, according to the land use distribution pattern at Tehran city, which means mostly residential areas at uptown and business areas at downtown, implementing DRT system would be an efficient solution to the
Tehran’s transits current problems.
In this study, a Demand-Responsive Transit system using GIS concepts and tools is designed and developed to 6 districts of Tehran city. Buffering and Neighbouring as GIS tools are used in order to establish the fellow-traveller groups. Statistics of commuting trips is used to simulate travel demands based on the land use of each area. Taxi, van, and bus are used as available fleet for designed DRT. In order to evaluate the proposed system for Tehran city, the used capacity of public vehicles in DRT is compared with average used capacity of public vehicles in current transportation network of Tehran. Results and evaluation shows the increase of capacity usage of
The International Archives of the Photogrammetry, Remote Sensing and Spatial Information Sciences, Volume XL-1/W5, 2015 International Conference on Sensors & Models in Remote Sensing & Photogrammetry, 23–25 Nov 2015, Kish Island, Iran
This contribution has been peer-reviewed.
public vehicles, and, also, the reduction of traffic flows at the studied areas.
2. LITERATURE REVIEW
Transportation systems generally involve issues related to land use, demographic information, economic and environmental data. So a vast range of data and information should be considered together. Most information in transportation system is location reference data, i.e., the spatial dimensions (Thill 2000). GIS is an appropriate tool for data integration, because the spatial dimensions can be communicated between different systems. The most important role of GIS is inserting spatial dimensions in transportation models (McCormack and Nyerges 1998). GIS-T focuses on analysis and planning in the application of GIS technologies for transportation issues (Miller and Shaw 2001). Urban transportation and traffic management systems are being developed using GIS and IT tools. Features such as traffic monitoring, traffic lights control, and the creation of new ITS areas have become possible using these technologies, which is an important step in the field of urban traffic management (Jae-bong and Byung-ki 2008).
With regard to the idea that Taxi usage is not new in meeting the demand of passengers traveling, in recent years a special interest has been created in the development of public transportation systems based on trip existing demands (Xiugang and Quadrifoglio 2009). The DRT method, including public vehicles, is based on existing demands in different directions providing service. Mobile Internet allows users to register their travel demand in the system immediately and enables the central system, after data collection, to assign a vehicle to each group of passengers based on existing methods. The proposed route is determined based on different parameters (Derek and Watkins 2003). The main idea of this method was to assist people with disabilities in the 1970s from house to house in Great Britain. Its major problems were real-time routing impossibility and last minute travel process disability (White 2002). In the early 1990s, the DRT system began public operation in America by making a phone call or filling out a form in person. Over time the development of IT tools has improved with Internet-based and mobile systems that have somewhat solved the aforementioned problems (Li et al. 2007). The development of GIS tools such as optimized online routing is another possible factor in providing better service to applicants that has increased citizens’ satisfaction in Europe and America.
3. METHODOLOGY
The main goals of developing DRT system are increasing satisfying level of citizens and scheduling according to their demands. The proposed GIS DRT system initialize with the trip requests by its users, public vehicle parking, and available vehicles. Figure 1 shows the main concept of GIS-based DRT.
Figure 1. GIS-based DRT system
The proposed system works on spatial common of trip requests by users that have the same origin and destination buffer. Also, the requested trips should be in specific time range to be considered together. In other words and regarding figure 1, a public vehicle (taxi, van, bus) from a specific parking move to pick up passengers who request trips with common origin, destination and time range. The main steps of designing the proposed system is shown at figure 2.
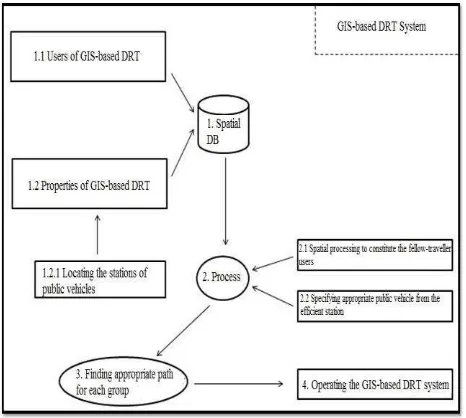
Figure 2. Methodology
The first element of the proposed system is spatial database that
includes information from both users’ trip demands and the
static parameters of GIS-based DRT system. Information related
to the proposed system consists of the users’ identification data and their trips’ requests. Each trip that is requested by each user
is determined by the coordination of origin and destination points besides its proposed time. So, a trip is a spatio-temporal vector that consists of (Xorigin, Yorigin, Xdestination, Ydestination, Time).
The second part of spatial database is related to data of the proposed system. It consists of location of available parking besides their public vehicles. The location of parking is determined based on locating methods considering land-use and statistics of daily trip requests. After gathering the essential information, turn is to main process of the system that consists of spatial processing to constitute fellow-traveller users and specifying appropriate public vehicle from the nearest parking.
As the first part of the process, the fellow-traveller groups are established. Each group consists of passengers that have the requested trips with common buffer of 500 meters for origin and destination; also, the departure requested time should be in 5 minutes of each other. Regarding member counts of each fellow-traveller group, an appropriate vehicle that be used maximize capacity from the nearest parking is allocated to move the passengers of each fellow-traveller group.
The third step of the proposed system is path finding for each group. For each group, there are several origin and destination
The International Archives of the Photogrammetry, Remote Sensing and Spatial Information Sciences, Volume XL-1/W5, 2015 International Conference on Sensors & Models in Remote Sensing & Photogrammetry, 23–25 Nov 2015, Kish Island, Iran
This contribution has been peer-reviewed.
points that should be considered for path finding. After operating and movement of each group, the public vehicle does not go back to its first parking and it goes to the nearest parking in the destination area.
4. IMPLEMENTATION & RESULTS
As it is described in section 3, the first part of the proposed
system is spatial database that consists of data about users’
demands and features of the system. So, we used the regions 1 to 6 of Tehran city as case study using commuting statistics for
simulating the data of trips’ demands. Table 1 shows the
Table 1. Initialize counts of agents in scenarios
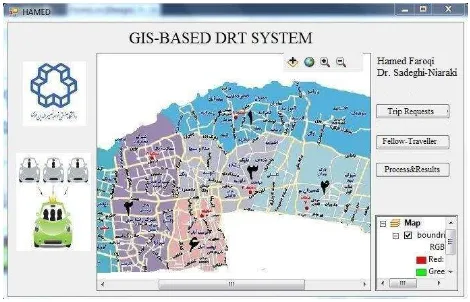
Moreover, the map of case study and the schema of the application that is coded by C# language in .NET framework 4.5 using ArcObjects 10.1 is shown at figure 3.
Figure 3. GIS-based DRT system application
Therefore, 14 parking stations are located; besides 2000 trip requests based on above-mentioned explanation are simulated. Table 2 shows the results of implementing the proposed system for the simulated commuting data and map of Tehran city.
Vehicle Counts of
Comparing the achieved results from the implementing proposed system with the current status of using capacity of
public vehicles at Tehran’s public transport network, shows the
positive affect of the proposed system. Capacity usage of taxi is about 34%, for Van is about 13%, and for the bus is 10%.
5. CONCLUSION
In this study, a Demand-Responsive Transit system using GIS concepts and tools is designed and developed to 6 districts of Tehran city. Buffering and Neighbouring as GIS tools are used in order to establish the fellow-traveller groups. Statistics of commuting trips is used to simulate travel demands based on the land use of each area. Taxi, van, and bus are used as available fleet for designed DRT. In order to evaluate the proposed system for Tehran city, the used capacity of public vehicles in DRT is compared with average used capacity of public vehicles in current transportation network of Tehran. Results and evaluation shows the increase of capacity usage of public vehicles, and, also, the reduction of traffic flows at the studied areas.
Evaluation performed on the results show the 34% increase using of Taxi capacity, 13% increase using of Van capacity and 10% increase using of Bus capacity in comparison between current public transport system and suggested public transportation system has been improved.
REFERENCES
Edwards, Derek, and Kari Watkins. 2013. “Comparing Fixed
-Route and Demand-Responsive Feeder TransitSystems in
Real-World Settings”. Transportation Research Record 3: 128- 135.
doi: 10.3141/2352-15.
Jae-Bong Yoo, and Byung-Ki Hong. 2008. “Intelligent Traffic
Control System Based on Ubiquitous Technology” The 6th
International Conference on Informatics and Systems Egypt.
Li, Xiugang, and Luca Quadrifoglio. 2011. “2-Vehicle Optimal
Zone Design for Feeder Transit Services”. Public Transport,
3(1), 89-104. doi: 10.1007/s12469-011-0040-2
Li, Yuwei , Nicole Foletta, Ken Elkabany, Fan Yang, Anthony
Wee, and Michael Cassidy. 2007. “Reservation, Scheduling,
and Navigation System for a Checkpoint DRT Service”. California PATH Program, Institute of Transportation Studies, University of California at Berkeley.
McCormack, Edward, and Timothy Nyerges. 1998. "What transportation modeling needs from a GIS: A conceptual framework", Transportation Planning and technology 21 (1-2): 5-23. doi: 10.1080/03081069708717599
Miller, H.J. and Shaw, S.L. 2001. "Geographic Information Systems for Transportation: Principles and Applications", Oxford University Press.
TCTTS. 2010. Tehran transportation and traffic, Tehran Comprehensive Transportation & Traffic Studies Co.17-20.
Thill, J. C. (Ed.). 2000. Geographic information systems in transportation research. Oxford, UK: Pergamon.
White Peter. 2002. “Public Transport: Its planning, management and operation”. Routledge.
The International Archives of the Photogrammetry, Remote Sensing and Spatial Information Sciences, Volume XL-1/W5, 2015 International Conference on Sensors & Models in Remote Sensing & Photogrammetry, 23–25 Nov 2015, Kish Island, Iran
This contribution has been peer-reviewed.