MULTISENSOR EXPERIMENTS OVER VINEYARD: NEW CHALLENGES
FOR THE GNSS-R TECHNIQUE
N. Sánchez a, *, A. Alonso-Arroyo b
, J. Martínez-Fernández a, A. Camps b, A. González-Zamora a, M. Pablos b, C. M. Herrero-Jiménez a, A. Gumuzzio a
a Universidad de Salamanca/CIALE, Duero 12, 37185 Villamayor, Spain - (nilda, jmf, aglezzamora, cmhj,
angela.gumuzzio)@usal.es
b Universitat Politècnica de Catalunya – BarcelonaTech and IEEC/UPC, Jordi Girona 1-3, 08034 Barcelona, Spain -
(alberto.alonso.arroyo, camps, miriam.pablos)@tsc.upc.edu
KEY WORDS: GNSS-R, Landsat, airborne, soil moisture, multispectral, thermal, vineyard
ABSTRACT:
An airborne campaign was performed during August, 2014 in an agricultural area in the Duero basin (Spain) in order to appraise the synergy between very different sources of Earth Observation imagery, and very different instruments for soil moisture retrieval. During the flight, an intensive field campaign comprising soil, plant and spectral measurements was carried out. An innovative sensor based on the Global Navigation Satellite Systems Reflectometry (GNSS-R) was on board the manned vehicle, the Light Airborne Reflectometer for GNSS-R Observations (LARGO) engineered by the Universitat Politècnica de Catalunya. While the synergy between thermal, optical and passive microwave spectra observations is well known for vegetation parameters and soil moisture retrievals, the experiment aimed to evaluate the synergy of GNSS-R reflectivity with a time-collocated Landsat 8 imagery for soil moisture retrieval under semiarid climatic conditions. LARGO estimates, field measurements, and optical, NIR, SWIR and thermal bands from Landsat 8 were compared. Results showed that the joint use of GNSS-R reflectivity with vegetation and water indices together with thermal maps from Landsat 8 thoroughly improved the soil moisture estimation.
* Corresponding author
1. INTRODUCTION
The potential of the Global Navigation Satellite Systems Reflectometry (GNSS-R) to monitor vegetation and soil variables has been addressed in recent experiments, all based on the attenuation and scattering that vegetation cover produces into the GNSS signal before it impinges on the ground and after it is reflected to the receiver. Recent studies have shown that GNSS-R signal has high sensitivity to the terrain dielectric constant under ground-based and airborne conditions (Egido et al., 2012; Kavak et al., 1998; Larson et al., 2010; Rodriguez-Alvarez et al., 2011). However, due to the novelty of this technique, the performance of airborne reflectometers for vegetation/soil applications remains unexplored, being challenging for planning new dedicated GNSS-R space-borne missions. A new insight on the synergy between GNSS-R reflectivity and available optical, infrared and thermal data is presented. In this line, a new approach merging the reflectivity map retrieved from the Light Airborne Reflectometer for GNSS Observations (LARGO) instrument (Alonso-Arroyo et al., 2014), and thermal and optical maps from Landsat 8 is presented. The synergy between low-resolution microwave and high-resolution optical from remote sensing data is likely to help to achieve a multi-resolution soil moisture retrieval approach (Merlin et al., 2005; Piles et al., 2014). The current research following this line is mainly devoted to downscaling or merging data from microwave radiometers or scatterometers at L band and broad spatial resolution (e.g., data from the Soil Moisture and Ocean Salinity mission, SMOS) with optical/infrared imagery from multispectral sensors (e.g. the Moderate Resolution Imaging Spectroradiometer, MODIS). Many disaggregation methods using visible and near infrared (VNIR) data as inputs have been applied to improve the
retrieval of soil moisture, but little research has been done combining the short-wave infrared (SWIR)-based indices (Sánchez-Ruiz et al., 2014) and the red, green and blue (RGB)-based (Sánchez et al., 2014) into the L-band space. The aim of this work is to show the convergence of optical and thermal data with the GNSS-R reflectivity to improve the conventional soil moisture retrieval from GNSS-R sources. Moreover, the optical and thermal datasets at high resolution (30 m) provided a spatial framework to adjust the resolution of the retrieved soil moisture. A total of two RGB-based indices and five NIR and SWIR-based indices were tested as a proxy of the vegetation and soil status, together with the land temperature, all of them from Landsat 8. Besides, the LARGO observations were converted into reflectivity maps preserving the Landsat 8 spatial resolution.
2. AIRBORNE GNSS-R OBSERVATIONS AND FIELD CAMPAIGN
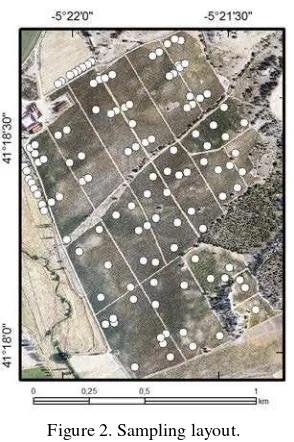
The airborne campaign was carried out during the first week of August 2014 to test the feasibility of the LARGO reflectivity for estimating soil moisture at high spatial resolution. The experiment took place in an agricultural area near the Guareña River, tributary of the Duero River in the centre of the Iberian Peninsula (5.36ºW; 41.30ºN). The main land use was vineyard (100 ha), but some areas of pasture, fallow, irrigated crops and forest were also present (Figure 1).
were collected (Figure 2). As it is usual under Mediterranean conditions in summer, the in situ observed soil moisture was very low, ranging from up to 3% in the vineyard and up to 14% in the wetter areas, the pasture field near the river.
Figure 1. Location of the study area and land use map.
Figure 2. Sampling layout.
The LARGO instrument used in this field campaign is an improved version of a previous LARGO used before in (Alonso-Arroyo et al., 2014), as it had a calibration switching matrix added. The LARGO instrument is a dual-channel instrument that estimates in real-time the coherent reflectivity from transmitted RHCP (Right Hand Circular Polarization) GNSS signals and received LHCP (Left Hand Circular Polarization) reflected GNSS signals. This reflectivity is estimated by dividing the waveform peaks (after noise floor subtraction) of the reflected and direct signals, which are calculated independently. It includes a GPS receiver to geo-locate the platform, to compute the position of the specular reflection points, and to aid the correlators to apply correlations only against the satellites under observation and not all satellites. The computation of the specular reflection point/area to generate the reflectivity is done by a geometrical approach. For each of the reflectivity measurements, the position of the corresponding satellite on the sky is observed by means of its azimuth and elevation. As GNSS satellites are more than 20.000 km far away from the Earth, it is possible to apply the paraxial approximation, condition under which the direct GNSS signal and the reflected one arrive to the Earth as a plane electromagnetic wave with the same incidence/elevation angle. So, by knowing the height of the platform (GPS data) and the satellite position it is straightforward to geo-locate the reflection points. The GNSS-R data resolution depends on the platform
height, and it is assumed for land observations, that the main reflected power comes from the first Fresnel zone (Masters et al., 2004) under specular reflection. In flat surface conditions, the incidence angle of the GNSS-R data, which is an important parameter for the reflectivity estimation, is the complementary angle of the GNSS satellite elevation angle.
3. DATA AND TREATMENT
3.1 LARGO dataset
A preliminary reflectivity map has been obtained (Figure 3) where several reflectivity regions can be identified. On the upperleft part, there is a region where reflectivity ranges from -10 to -12 dB. Nevertheless, on most part of the field reflectivity ranges from -14 to -18 dB and there are some specific regions where reflectivity falls below -20 dB. This occurs due to the dry conditions during the experiment. When the field campaign was done the soil moisture lower than 5% for nearly the whole field site despite one region where soil moisture ranged between 10-15%.
Figure 3.Preliminary reflectivity map from LARGO.
3.2 Landsat 8 dataset
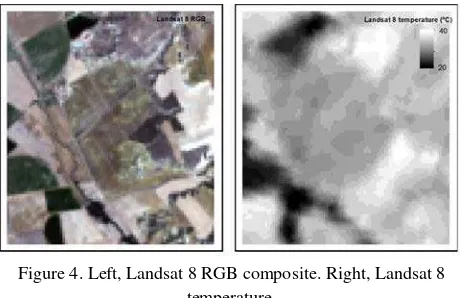
In this approach, a Landsat 8 scene (202-031 path-row) of 12 August, 2014 was selected for testing its opportunity to be included with LARGO. Landsat 8 carries two instruments: The Operational Land Imager (OLI) sensor including 8 multispectral bands at 30 m, and the Thermal Infrared Sensor (TIRS) providing two thermal bands at 100 m, resampled to the same 30 m of the multispectral bands. TIRS acquires data in two spectral channels covering 10.60-11.19 µm and 11.50- 12.51µm (bands 10 and 11). Besides, bands blue (450 nm-510 nm), green (530 nm-590 nm), red (640 nm-670 nm), NIR (850 nm-880 nm), SWIR 1 (1570 nm-1650 nm), and SWIR 2 (2100 nm-2290 nm) from OLI were selected.
converting from spectral radiance to brightness temperature and further LST (Figure 4, right).
Figure 4. Left, Landsat 8 RGB composite. Right, Landsat 8 temperature.
In a similar approach to this work, Sánchez-Ruiz et al. (2014) showed the feasibility of SWIR indices to disaggregate passive L-band observations owing the absorption effects in this band. Thus, taking advantage of the SWIR bands of Landsat 8, the so-called Normalized Difference Water Indices (Gao, 1996) were calculated in the SWIR space:
NDWI1-NIR=(ρNIR-ρSWIR1)/(ρNIR+ρSWIR1) (1) NDWI2-NIR=(ρNIR-ρSWIR2)/(ρNIR+ρSWIR2) (2)
where ρNIR, ρSWIR1and ρSWIR2 refers to the reflectivity of bands NIR, SWIR 1 and SWIR 2 of Landsat 8 respectively. A high value of NDWI 1 and NDWI 2 is a consequence of a higher reflectance in the NIR band, than in the SWIR-1 and SWIR-2 bands, regions of water absorption. Thus, this indicates sufficient quantities of water in the canopy for photosynthetic activity, and thus green and healthy vegetation. The normalized ratios respect to the red band were also calculated (eqs. 3 and 4).
NDWI1-red=(ρred-ρSWIR1)/(ρred+ρSWIR1) (3) NDWI2-red=(ρred-ρSWIR2)/(ρred+ρSWIR2) (4)
Whereas the NDWI-NIR indices are related to the vegetation water content, these NDWI-red indices are related to the soil water content, since the absorption of water content of the soil in the red band is negligible, whereas the SWIR band exhibited absorption. Thus, it is expected that the wetter the soil, the higher the absorption in bands SWIR and a smaller reflectance. Accordingly, a positive value of NDWI-red indicates wet soil and, conversely, negatives values denote dry soils.
NDWI indices based in the SWIR region may be considered water indices, depicting either the vegetation or soil water status. Indices based in the NIR spectra relate to the vegetation health and vigour, combined with the RGB region.
Indices in the RGB region were also tested, as they have been widely used to monitor vegetation status. Ratio of the reflectance of green and red bands was tested, which is sensitive to the ratio between chlorophyll and anthocyanin (Kanemasu, 1974). Its normalized version is known as the Green-Red Vegetation Index (GRVI) (Tucker, 1979):
GRVI=(ρgreen-ρred)/(ρgreen+ρred) (5) (1)(1
where ρgreenand ρred are the reflectance of visible green and red, respectively. The response of GRVI to various ground covers may be simple to interpret because for densely vegetated covers the reflectance of the vegetation cover in the green band is higher than in the red one, reaching high values.
Finally, the portion of green reflectance of the whole RGB space is computed as the Greenness index (eq. 6). Low index indicates barely vegetated covers. Also the NDVI was obtained and tested from the red and NIR bands (eq. 7)
Greenness=ρgreen/(ρgreen+ρred+ρblue) (6) NDVI=(ρNIR-ρred)/(ρNIR+ρred) (7)
3.3 Statistical analysis
3.4.1. Correlations: The values from the imagery based on the locations of the ground measurements were extracted and compared to the in situ soil moisture values at these particular locations. The preliminary analysis of the relationship gave an idea of the best indices correlated with soil moisture and surface temperature, as well as with LARGO.
3.4.2. Multiple regression: The relationship between soil moisture, NDVI and LST was expressed through a regression formula. In this multiple regression, LARGO reflectivity was also included, following the approach of Piles et al. (2011; 2014) who included the brightness temperature from the L-Band radiometer of SMOS. Hence, the synergies of Landsat-derived LST and indices, LARGO reflectivity and in situ soil moisture are expressed through a linear linking model as follows:
Y = a0 + a1X1 + a2 X2 + a3 X3 (8)
where the dependent variable Y represents soil moisture, and the independent variables X1, X2, and X3 are the LST, the LARGO reflectivity and the corresponding index, respectively. a0, a1, a2, and a3 are the coefficients of the regression. A system of linear equations with an equation per location of in situ
measurement was set up, by extracting their value of each variable from each image. Thus, a system of linear equations was set up for the pixels of the in situ sample. The system was solved to obtain the regression coefficients. Metrics of the regression (multiple correlation) were used to evaluate the performance of the linking model and how well the set of variables can predict soil moisture.
4. RESULTS AND DISCUSSION
4.1 Correlation between datasets
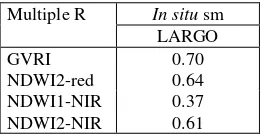
The results of the relationships between variables in terms of the Pearson correlation coefficient (Table 1) showed a clear pattern between several indices and soil moisture. GVRI, NDWI2-red and NDWI2-NIR showed a high correlation with soil moisture. Hence, the SWIR 2 band resulted better for describing soil moisture contents than the SWIR 1.
result of correlation between LARGO and soil moisture was found (R=0.37), suggesting a certain potential of the LARGO reflectivity to explain the former. The hypothesis was that the fusion of each index with the LARGO reflectivity and the temperature improved the soil moisture estimation with respect to the one taking each variable separately.
R In situ
Table 1. Correlation coefficients (Pearson) between variables. *not significant correlations. In bold, best correlations found.
4.2 Multiple regression
The indices that seemed to better characterize both soil moisture and temperature were GVRI, NDWI2-red, NDWI1-NIR and NDWI2-NIR. Thus, these indices were included in each multiple regression, together with thermal and reflectivity data, and were adjusted to the soil moisture observations (Table 2). A good fit was found for all of them, with a coefficient of correlation R>0.60 in all cases except for NDWI1-NIR, which seemed inadequate for the soil moisture estimation.
Multiple R In situ sm
Table 2. Statistical results of the linking model for the two LARGO datasets and the chosen indices. *not significant
correlations.
The dry conditions of the field campaign difficult the soil moisture retrieval using this technology. In this line, Valencia et al. (2010) find very low correlation between reflectivity and soil moisture under very dry conditions. However, the results of the present approach can be considered very satisfactory, even though future campaigns under other environmental conditions should be tested. Moreover, the methodology, which is a current strategy of downscaling soil moisture products, has the advantage to perform at any spatial resolution, from several meters (Sánchez et al., 2014) to kilometres (Piles et al., 2011). This versatility allowed to explore the optimal spatial resolution to transform the at-point scale GNSS-R observations into reflectivity maps and further soil moisture maps.
5. CONCLUSIONS
The objective of this work was to test the capability of an airborne source of GNSS-R data for estimating and characterizing both vegetation cover and soil moisture status. Owing the expected development of new GNSS-R-based missions, the potential interactions between soil moisture estimates and observations at high resolution from airborne or
satellite sensors allow for synergistic approaches that can be later transferred to sensors on-board satellite platforms. Regarding the vegetation, and considering the particular climatic and vegetation conditions of the experiment, the reflectivity from the airborne LARGO at Landsat resolution did not show sensitivity to the main vegetation covers in the area. However, a certain relationship to soil moisture was detected. This relationship was strongly reinforced if the reflectivity was merged with the surface temperature and some vegetation/water indices, all of them from the Landsat 8 bands. Indeed, encouraging correlations were found (R>0.60) when applying a multiple regression model that linked the soil moisture to the temperature, the index (GVRI, NDWI2-red or NDWI2-NIR) and the reflectivity altogether. These correlations were much higher than taking each variable separately. These results suggested that some flexibility to retrieve soil moisture at any spatial resolution can be expected from the combination of conventional sensors with the upcoming GNSS-R sources. The results demonstrate the potential of using conventional vegetation/water indices and thermal bands from current satellite missions in combination with GNSS-R observations.
ACKNOWLEDGEMENTS
This study was supported by the European Community Seventh Framework Programme, FP7-Space-2013-1 (Project E-GEM ID 607126) and the Spanish MINECO (Projects AYA2011-29183-C02-01 and AYA2012-39356-C05).
REFERENCES
Alonso-Arroyo, A., Camps, A., Monerris, A., Rudiger, C., Walker, J.P., Forte, G., Pascual, D., Park, H., Onrubia, R., 2014. The light airborne reflectometer for GNSS-R observations (LARGO) instrument: initial results from airborne and rover field campaigns, IEEE International Geoscience and Remote Sensing Symposium, IGARSS 2014 IEEE International, Québec, Canada, pp. 4054-4057.
Barsi, J.A., Schott, J.R., Hook, S.J., Raqueno, N.G., Markham, B.L., Radocinski, R.G., 2014. Landsat-8 Thermal Infrared Sensor (TIRS) vicarious radiometric calibration. Remote Sensing 6, pp. 11607-11626.
Egido, A., Caparrini, M., Ruffini, G., Paloscia, S., Santi, E., Guerriero, L., Pierdicca, N., Floury, N., 2012. Global Navigation Satellite Systems Reflectometry as a Remote Sensing Tool for Agriculture. Remote Sensing, 4, pp. 2356-2372.
Gao, B., 1996. NDWI-A normalized difference water index for remote sensing of vegetation liquid water from space. Remote Sensing of Environment, 58, pp. 257-266.
Kanemasu, E.T., 1974. Seasonal canopy reflectance patterns of wheat, sorghum, and soybean. Remote Sensing of Environment, 3, pp. 43-47.
Kavak, A., Vogel, W.J., Xu, G., 1998. Using GPS to measure ground complex permittivity. Electronics Letters, 34, pp. 254-255.
of Selected Topics in Applied Earth Observations and Remote Sensing, 3, pp. 91-99.
Masters, D., Axelrad, P., Katzberg, S., 2004. Initial results of land-reflected GPS bistatic radar measurements in SMEX02.
Remote Sensing of Environment, 92, pp. 507-520.
Merlin, O., Chehbouni, A.G., Kerr, Y., Njoku, E.G., Entekhabi, D., 2005. A combined modeling and multispectral/multiresolution remote sensing approach for disaggregation of surface soil moisture: application to SMOS configuration. IEEE Transactions on Geoscience and Remote Sensing, 43, pp. 2036-2050.
Piles, M., Camps, A., Vall.llossera, M., Corbella, I., Panciera, R., Ruediger, C., Kerr, Y., Walker, J., 2011. Downscaling SMOS-derived soil moisture using MODIS Visible/Infrared data. IEEE Transactions on Geoscience and Remote Sensing, 49, pp. 3156-3166.
Piles, M., Sánchez, N., Vall-llossera, M., Camps, A., Martínez-Fernández, J., Martínez, J., González-Gambau, V., 2014. A dowscaling approach for SMOS land observations: evaluation of high resolution soil moisture maps over the Iberian Peninsula. IEEE Journal of Selected Topics in Applied Earth Observations and Remote Sensing, 7, pp. 3845-3857.
Rodriguez-Alvarez, N., Vall-llossera, M., Camps, A., Bosch-Lluis, X., Monerris, A., Ramos-Perez, I., Valencia, E., Marchan-Hernandez, J.F., Martinez-Fernandez, J., Baroncini-Turricchia, G., Pérez-Gutiérrez, C., Sánchez, N., 2011. Land geophysical parameters retrieval using the interference pattern GNSS-R technique. IEEE Transactions on Geoscience and Remote Sensing, 49, pp. 71-84.
Sánchez-Ruiz, S., Piles, M., Sánchez, N., Martínez-Fernández, J., Vall-llossera, M., Camps, A., 2014. Combining SMOS with visible and near/shortwave/thermal infrared satellite data for high resolution soil moisture estimates. Journal of Hydrology, 516, pp. 273-283.
Sánchez, N., Piles, M., Martínez-Fernández, J., Vall-llossera, M., Pipia, L., Camps, A., Aguasca, A., Fernández-Aragüés, F., Herrero-Jiménez, C.M., 2014. Hyperspectral optical, thermal and microwave L-band observations for soil moisture retrieval at very high spatial resolution. Photogrammetric Engineering & Remote Sensing, 80, pp. 745–755.
Tucker, C.J., 1979. Red and photographic infrared linear combinations for monitoring vegetation. Remote Sensing of Environment, 8, pp. 127-150.