BIOMASS ESTIMATION TO SUPPORT PASTURE MANAGEMENT IN NIGER
A. Schucknecht a, *, M. Meroni a, F. Kayitakire a, F. Rembold a, A. Boureima b
a Institute for Environment and Sustainability, European Commission, Joint Research Centre, Ispra, Italy - (anne.schucknecht, michele.meroni, francois.kayitakire, felix.rembold)@jrc.ec.europa.eu
b General Directorate of Production and Animal Industries, Ministry of Livestock, Niamey, Niger - [email protected]
KEY WORDS: Phenology, SPOT-VEGETATION, FAPAR, Sahel, Livestock, Food security
ABSTRACT:
Livestock plays a central economic role in Niger, but it is highly vulnerable due to the high inter-annual variability of rain and hence pasture production. This study aims to develop an approach for mapping pasture biomass production to support activities of the Niger Ministry of Livestock for effective pasture management. Our approach utilises the observed spatiotemporal variability of biomass production to build a predictive model based on ground and remote sensing data for the period 1998–2012. Measured biomass (63 sites) at the end of the growing season was used for the model parameterisation. The seasonal cumulative Fraction of Absorbed Photosynthetically Active Radiation (CFAPAR), calculated from 10-day image composites of SPOT-VEGETATION FAPAR, was computed as a phenology-tuned proxy of biomass production. A linear regression model was tested aggregating field data at different levels (global, department, agro-ecological zone, and intersection of agro-ecological and department units) and subjected to a cross validation (cv) by leaving one full year out. An increased complexity (i.e. spatial detail) of the model increased the estimation performances indicating the potential relevance of additional and spatially heterogeneous agro-ecological characteristics for the relationship between herbaceous biomass at the end of the season and CFAPAR. The model using the department aggregation yielded the best trade-off between model complexity and predictive power (R2 = 0.55, R2
cv = 0.48). The proposed approach can be used to timely produce maps of estimated biomass at the end of the growing season before ground point measurements are made available.
* Corresponding author
1. INTRODUCTION
Livestock represents an important economic sector in Niger, contributing 11% to the GDP in 2013 (INS-Niger, 2014) and involving 89% of agricultural households, of which 11% depend exclusively on livestock production (Republic of Niger, 2007). Pastoral production systems are mainly located in the Sahelian part of the country which is very vulnerable due to the high inter-annual rainfall variability (e.g., Nicholson, 2013 and references therein; Tarhule et al, 2014) and hence pasture production. Besides the temporal variability, the region is also characterised by a high spatial rainfall variability, increasing the need for a better management of the transhumance movements.
One important element to enhance efficient and sustainable pasture management as well as food security in the pastoral zone is the availability of a biomass production map at the end of the growing season. This map, together with the estimated livestock number by administrative region, can be used to calculate a forage balance identifying areas potentially exposed to forage deficit or surplus, leading to potential livestock mortality or fire risk, respectively.
Different remote sensing (RS) based approaches to estimate aboveground biomass in semi-arid areas have been developed during the last decades using optical and radar data as well as modelling and combined multi-sensor approaches (for a review see Eisfelder et al., 2012). The majority of studies utilized low- and medium resolution optical or radar data and an empirical relationship between field biomass measurements and a RS indicator (Eisfelder et al, 2012). The first studies of herbaceous biomass estimation in Niger date back to the late 1980’s and
utilized linear regressions between maximum standing biomass and NDVI-based metrics (maximum and time-integrated NDVI) derived from NOAA AVHRR imagery (Maidagi et al., 1987; Wylie et al., 1988, 1991, 1995). A similar method is currently applied by the Ministry of Livestock in Niger (MoL) using NDVI data from SPOT-VEGETATION (VGT), and since 2014 from METOP-AVHRR. In such an approach, a linear regression model between a NDVI-based metrics and the ground measurements of the season just ended is tuned and used to produce a map of pasture biomass. In a recent study, Nutini et al. (2014) applied a radiation use efficiency model using cumulated dry matter productivity (DMP) derived from SPOT-VGT (Smets et al., 2010) over a fix period of time and corrected with the evaporative fraction (EF, derived from MODIS thermal measurements) to estimate rangeland biomass in Niger.
2. STUDY AREA, DATA AND METHODS
2.1 Study area
Niger is a landlocked country in West Africa, characterised by a hot arid desert climate in most of its parts and a hot arid steppe climate in the south (according to the Köppen-Geiger climate classification; Kottek et al., 2006). Mean annual temperature is around 30°C throughout the country, with lowest mean monthly temperatures occurring in winter (e.g., January: 17–27°C for different places within Niger) and highest ones occurring in summer (e.g., June: 32–38°C) for the last climate normal 1981– 2010 (Kalnay et al. 1996; NOAA, 2014). Mean annual precipitation sums (Fig. 1) mainly follow a north-south gradient with mean annual precipitation <100 mm in the north and 600– 700 mm in the outermost south (based on ten-daily cumulative rainfall estimates from TAMSAT data from the TARCAT v2.0 dataset for the period 1983–2012; Maidment et al, 2014; Tarnavsky et al., 2014). Most of the precipitation occurs during the rainy season (Jun–Sep) and is related to the West African monsoon (Nicholson, 2013).
Figure 1. Biomass sample sites and mean annual precipitation 1983–2012 calculated from ten-daily TAMSAT data (Maidment
et al, 2014; Tarnavsky et al., 2014)
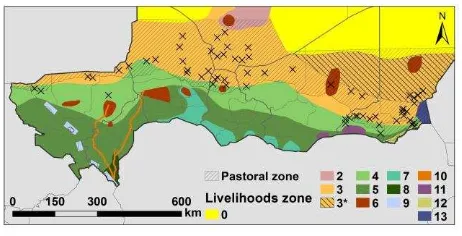
In this study we focus on the pastoral zone (approximate outline in Fig. 2 provided by the MoL), which is roughly represented by the livelihoods zone 3 “transhumant and nomad pastoralism” (FEWS NET, 2011) (Fig. 2). The pasture sample sites used in this study are mainly located between the 100 mm and 300 mm isohyets (Fig. 1) and represent the Sahelian acacia savannah ecoregion within the biome of tropical and subtropical grasslands, savannahs and shrublands (Olsen et al., 2001).
Figure 2. Livelihoods zones (FEWS NET, 2011), pastoral zone (MoL) and sample sites. Classes of interest for this study: 3 =
transhumant & nomad pastoralism (* with camels), 4 = agro-pastoral belt. Note: sites in the agro-agro-pastoral belt considered in this study, as they were classified as fully pastoral by the MoL
2.2 Data
2.2.1 Biomass data: The MoL provided the dataset of measured pasture aboveground biomass (Bm) at the end of the growing season covering 103 sites, spanning the period 1988– 2013 and containing in total 1062 records of dry matter production [kg ha-1]. The actual date of sampling is variable but generally occurs between mid-September and end of October. The fresh and dry portions of the leaf tissues are considered to represent the total aboveground biomass production for the concluded season. Each sampling site corresponds to a transect designed to represent an area of 3 km x 3 km. Herbaceous biomass values were obtained by applying a double-sampling approach combining visual estimates and weighted biomass. For a more detailed description of the sampling approach see e.g., Maidagi et al. (1987) and Wylie et al. (1995). After discarding sampling sites located in agricultural areas and those having less than four measurements in the target period, the Bm dataset was statistically analysed and screened for outliers. Finally, 63 sites were retained for the parametrisation of the model (in total 647 records).
2.2.2 RS data: This study utilized a time series of 10-day maximum value Fraction of Absorbed Photosynthetically Active Radiation (FAPAR) composites of the JRC-MARS archive (Joint Research Centre of the European Commission, Monitoring Agricultural Resources Unit) from April 1998 to December 2012. In this product, FAPAR is retrieved from calibrated, cloud-screened and atmospherically corrected (Rahman et al., 1994) SPOT-VGT imagery at a 1/112° (about 1 km) spatial resolution using the CYCLight algorithm (Weiss et al., 2010).
2.3 Methods
2.3.1 RS proxy for biomass production: Seasonal cumulative FAPAR (CFAPAR) was used as a phenology-tuned proxy for biomass production. CFAPAR is defined as the integral of FAPAR during the growing season subtracted by the area under the baseline (Fig. 3), as proposed by Meroni et al. (2014a). The time interval for integration is dynamically adjusted for every site and every year based on the start and end of the season (SOS, EOS). The required phenology parameters (SOS, EOS; maximum value of FAPAR, maxv) were calculated using the model-fit approach of Meroni et al. (2014b). In general, the value of CFAPAR depends on the shape of the FAPAR seasonal trajectory, the integration limits and the baseline value.
2.3.2 Linear regression model: We built a linear regression model between all available Bm of the selected 63 sites for the period 1998–2012 and the corresponding CFAPAR values. In addition to the calibration of the model using the whole set of available measurements (referred to as “global”), different aggregation schemes were tested for calibrating the model. All model specifications were subjected to a cross validation (cv) by leaving one full year out to evaluate their robustness and predictive power.
The calibration at the department level (referred to as
“department”) represents a first attempt to take into account local effects in the regression. For instance, such unobserved local effects may refer to different background reflectance affecting FAPAR estimates or different species composition modifying the relationship between biomass and CFAPAR. Limiting the spatial domain at which the model is calibrated is expected to reduce the influence of the spatial variance and reduce the estimation error in the temporal domain.
However, the administrative department is an arbitrary unit with respect to spatial affinity in a biophysical sense. For a better parameterization of the relationship between Bm and CFAPAR, we tested an agro-ecological stratification derived from an ISODATA unsupervised classification of the FAPAR imagery. Mean FAPAR images of every dekad (i.e., 10 days) in the year (n=36) calculated for the period 1999–2012 were used as input for the classification. All non-vegetated areas, defined as pixels with an overall variability of the entire FAPAR time series (as measured by the 95th-5th percentile difference) less than the FAPAR uncertainty (assumed to be 0.1 as in Meroni et al, 2014b), were masked out. The resulting ISODATA classification yielded eight classes from which six were covered by sample sites (class 1 to 6). The remaining two classes were primarily located in the uttermost south of Niger and do not represent the typical pastoral zone. Based on the classification results, we built a regression model calibrated at the agro-ecological class level (referred to as “agroeco”).
In order to further refine the model complexity we also considered a model parametrization performed at a finer unit resolution resulting from the intersection of departments and agro-ecological classes (referred to as “agroecodep”).
In summary, a set of different aggregation schemes was tested, ranging from the more detailed of the agroecodep (28 calibration units), to the department (11 units), to the agroeco (6 units) and finally to the less detailed one (global, one single unit). The selection of the best performing of these can only be empirical in cross validation and will depend on the trade-off between increased accuracy related to increased model parametrization and decreased robustness and predictive power due to reduced sample size when increasing the number of calibration units.
2.3.3 Map of estimated biomass: The estimated biomass (Be) at the end of the growing season for a certain year was calculated via the following equation:
Be = a * CFAPAR + b (1)
where Be = estimated biomass
a, b = gain and offset of the regression model CFAPAR = cumulated FAPAR during the growing season
For the global model, the same gain and offset (derived from the regression model) were applied for all pixels. For the department, agroeco and agroecodep pooling, class specific gains and offsets were applied for each pixel within a certain department, agroeco or agroecodep class.
Departments with no or a negligible share at the pastoral zone were masked out in the estimated biomass maps.
3. RESULTS AND DISCUSSION
Pasture biomass shows a high spatial and temporal variability among the sample sites during the period 1998–2012. Mean measured biomass of individual sites varies from 350 kg ha-1 to 1770 kg ha-1 (mean of all sites: 740 kg ha-1). The coefficient of variation (CV) of biomass ranges from 34% to 122% for individual sites, indicating a high inter-annual variability.
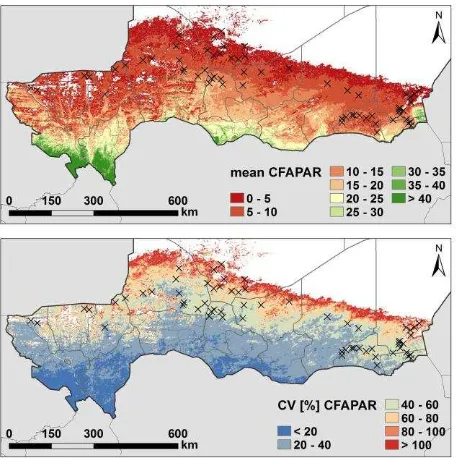
The spatial pattern of mean CFAPAR and CV of CFAPAR (Fig. 4) predominantly reveals a north-south gradient with low mean CFAPAR and high CV values in the north (at the border to the non-vegetated area of the Sahara) and high mean CFAPAR and low CV values in the south. This gradient mainly reflects the annual precipitation gradient (Fig. 1).
Figure 4. Mean CFAPAR (top) and CV of CFAPAR (bottom) for the period 1998–2012. White areas reflect non-vegetated
areas (for a definition see 2.3.2)
3.1 Regression model
Figure 5. Location of selected sites (names of respective departments indicated) and R2 of the site specific regression
between Bm and CFAPAR
The spatial distribution of agro-ecological classes derived from the ISODATA classification are presented in Fig. 6. The emerging spatial pattern expresses a north to south gradient of well-defined bands of class 1, 2 and 3 at the southern border of the Sahara. South of this zone, the spatial pattern is more complex, especially in the south-west of Niger characterized by a quite small-scale heterogeneity pattern compared to other parts of the country. This class heterogeneity can be attributed to different land uses (presence of agriculture for instance) and variability of morphological features (i.e., rivers, depressions) resulting in different growth conditions for plants.
Figure 6. ISODATA classification result. Unclassified refer to non-vegetated area (see 2.3.2)
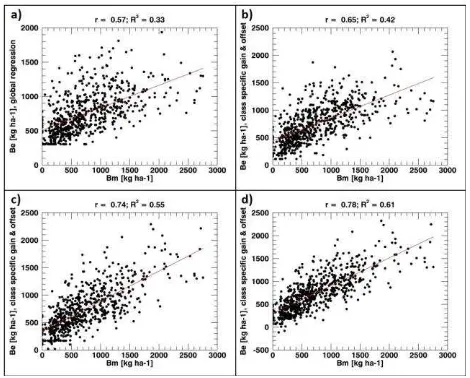
The different aggregation levels of the linear regression model show an increase in R2 with increasing complexity of the model (Table 1, Fig. 7). While the R2 of the global level (two coefficients to be tuned) is the lowest with 0.33, the R2 of the agroecodep level (56 coefficients) is the highest with 0.61. The other two aggregation levels lay in between whereby the department level can explain a higher percentage of measured biomass variance than the agroeco level.
This ranking does not change if the R2
cv is considered. However, the R2 increase from the department to the agroecodep level appears to be due to over-fitting when considering the negligible increase of the R2
cv. Furthermore, the trade-off between increased model parameterization (from 22 to 56 coefficients to be tuned) and increased performance (1% in R2
cv) suggests to discard the operational use of the agroecodep level aggregation and to opt for the department level.
Aggregation level R2 R2
cv # coefficients
Global 0.33 0.31 2
Agroeco 0.42 0.38 2 * # classes = 12 Department 0.55 0.48 2 * # departments = 22 Agroecodep 0.61 0.49 2 * # classes = 56
Table 1. R2 and cross-validated R2 for different aggregation levels and number of coefficients to be tuned
An increase of the model spatial detail improves – at least to a certain extent – the performance of the model. Therefore, we acknowledge that some spatial heterogeneity that we are not able to model explicitly does exist. This could be due to spatially variable grazing pressure, species composition and soil spectral properties that may influence the relationship between measured herbaceous biomass at the end of the season and CFAPAR.
The better performance of the department model compared to the agroeco model may indicate that the spatial proximity, ensured by department aggregation and that might be related to similar grazing pressure, soil properties, etc., is more important for the empirical calibration of the relationship compared to an ecological zoning based on average biophysical variables derived from RS data.
Figure 7. Scatterplot of Bm and Be for different aggregation levels of the regression model. a) global, b) agroeco, c)
department, d) agroecodep
3.2 Estimated biomass map
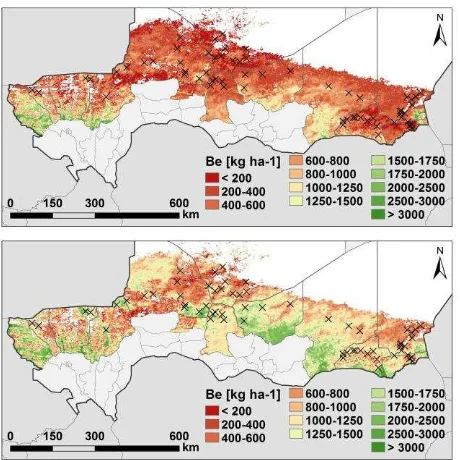
Figure 8. Estimated biomass in 2004 (top) and 2012 (bottom) based on linear regression model with department aggregation
4. CONCLUSIONS
In this study we developed a predictive phenology-tuned model for the estimation of pasture biomass in Niger. The cumulative value of FAPAR during the growing season, CFAPAR, was derived from 10-day SPOT-VGT FAPAR data using a model-fit phenology retrieval method and was used as a proxy for biomass production. The linear model relating CFAPAR to pasture biomass production was parametrized with ground data of measured herbaceous biomass at the end of the growing season. Calibration of model coefficients was performed at different aggregation levels.
An increased complexity of the model increased the estimation performance indicating the potential relevance of additional and spatially heterogeneous agro-ecological parameters for the relationship between herbaceous biomass at the end of the season and CFAPAR. Concerning the trade-off between increased accuracy related to increased model parametrization and decreased predictive power, the department level performed best among the tested aggregation levels.
The presented approach can be used to timely produce maps of estimated biomass at the end of the growing season before ground point measurements are made available. Such maps could be useful both for planning more in-depth field missions (e.g., to areas showing exceptionally high or low production) and taking timely decisions on fire prevention and aid allocation.
Our results highlight the importance of local unobserved effects (which might relate to grazing, optical soil properties, etc.) on the model performance. Therefore, future work should assess the significance of such potential influencing parameters and include the most important ones in the model. In the case of grazing, there is a need for repeated biomass measurements during the season to gather information about the grazing intensity and timing to evaluate the effect on the relationship between CFAPAR and pasture biomass production.
ACKNOWLEDGEMENTS
We would like to thank our colleague T. Nkunzimana for his support regarding the communication and exchange with the MoL of Niger.
REFERENCES
Eisfelder, C., Kuenzer, C., Dech, S., 2012. Derivation of biomass information for semi-arid areas using remote-sensing data. International Journal of Remote Sensing, 33(9), pp. 2937– 2984.
FEWS NET – Famine Early Warning Systems Network, 2011.
Livelihoods zoning “plus” activity in Niger. Special report by
FEWS NET, http://www.fews.net/west-africa/niger/livelihood-zone-map/august-2011 (23 Feb. 2015).
INS-Niger – Institut National de la Statistique, Republique du Niger, 2014. Annuaire statistique 2009–2013, Niamey, Niger, http://www.stat-niger.org/statistique/file/Annuaires_Statistiques /Annuaire%20Statistique%202009-2013.pdf (29 Jan. 2015).
Kalnay, E., Kanamitsu, M., Kistler, R., Collins, W., Deaven, D., Gandin, L., Iredell, M., Saha, S., White, G., Woollen, J., Zhu, Y., Leetmaa, A., Reynolds, R., Chelliah, M., Ebisuzaki, W., Higgins, W., Janowiak, J., Mo, K.C., Ropelewski, C., Wang, J., Jenne, R., Joseph, D., 1996. The NCEP/NCAR 40-year reanalysis project. Bullettin of the American Meteorological Society, 77(3), pp. 437–471.
Kottek, M., Grieser, J., Beck, C., Rudolf, B., Rubel, F., 2006. World map of the Köppen-Geiger climate classification updated. Meteorologische Zeitschrift, 15(3), pp. 259-263.
Maidagi, B., Denda, I., Wylie B., Harrington, J., 1987. Pasture production in the central and eastern pastoral zones of Niger. Technical report, Integrated Livestock Production Project, Government of Niger/Tufts University/USAID, http://pdf.usaid.gov/pdf_docs/PNABG559.pdf (02/03/2015).
Maidment, R., Grimes, D., Allan, R.P., Tarnavsky, E., Stringer, M., Hewison, T., Roebeling R., Black, E., 2014. The 30 year TAMSAT African Rainfall Climatology And Time series (TARCAT) data set. Journal of Geophysical Research: Atmospheres, 119(18), pp. 10,619-10,644.
Meroni, M., Rembold, F., Verstraete, M.M., Gommes, R., Schucknecht, A., Beye, G., 2014a. Investigating the relationship between the inter-annual variability of satellite-derived vegetation phenology and a proxy of biomass production in the Sahel. Remote Sensing, 6(6), pp. 5868-5884.
Meroni, M., Verstraete, M.M., Rembold, F., Urbano, F., Kayitakire, F., 2014b. A phenology-based method to derive biomass production anomaly for food security monitoring in the Horn of Africa. International Journal of Remote Sensing, 35(7), pp. 2471-2492.
Nicholson, S.E., 2013. The West African Sahel: A review of recent studies on the rainfall regime and its interannual variability. ISRN Meteorology, vol. 2013, Article ID 453521, 32 p.
Reanalysis 2014. Images provided by the NOAA/ESRL Physical Sciences Division, Boulder Colorado, USA, http://www.esrl.noaa.gov/psd/ (23 Feb. 2015).
Nutini, F., Boschetti, M., Candiani, G., Bocchi, S., Brivio, P.A., 2014. Evaporative Fraction as an indicator of moisture condition and water stress status in semi-arid rangeland ecosystems. Remote Sensing, 6(7), pp. 6300–6323.
Olson, D.M., Dinerstein, E., Wikramanayake, E.D., Burgess, N.D., Powell, G.V.N., Underwood, E.C., D'Amico, J.A., Itoua, I., Strand, H.E., Morrison, J.C., Loucks, C.J., Allnutt, T.F., Ricketts, T.H., Kura, Y., Lamoreux, J.F., Wettengel, W.W., Hedao, P., Kassem, K.R., 2001. Terrestrial ecoregions of the world: a new map of life on Earth. Bioscience, 51(11), pp. 933-938.
Rahman, H., Dedieu, G., 1994. SMAC: A simplified method for the atmospheric correction of satellite measurements in the spectrum. International Journal of Remote Sensing, 15, pp. 123-143.
Republique du Niger, 2007. Recensement general de
l’agriculture et du cheptel (RGAC 2005/2007) – Vol. II Resultats definitifs (volet cheptel), Republique du Niger, Ministere du Developpement Agricole, Ministere des
Ressources Animales, Niamey, Niger,
http://harvestchoice.org/sites/default/files/downloads/publicatio ns/Niger_2005-07_Vol2.pdf (17 Feb. 2015).
Smets, B., Eerens, H., Jacobs, T., Royer, A., 2010. BioPar product user manual Dry Matter Productivity (DMP), Version 0
from SPOT/VEGETATION data,
http://land.copernicus.eu/global/sites/default/files/products/GIO
-GL1_PUM_DMP_I1.00.pdf (05/03/2015).
Tarhule, A., Zume, J.T., Grijsen, J., Talbi-Jordan, A., Guero, A., Dessouassi, R.Y., Doffou, H., Kone, S., Coulibaly, B., Harshadeep, N.R., 2014. Exploring temporal hydroclimatic variability in the Niger Basin (1901–2006) using observed and gridded data. International Journal of Climatology, 35(4), pp. 520–539.
Tarnavsky, E., Grimes, D., Maidment, R., Black, E., Allan, R., Stringer, M., Chadwick, R., Kayitakire, F., 2014. Extension of the TAMSAT satellite-based rainfall monitoring over Africa and from 1983 to present. Journal of Applied Meteorology and Climatology, 53(12), pp. 2805-2822.
Weiss, M., Baret, F., Eerens, H., Swinnen, E., 2010. FAPAR over Europe for the past 29 years: A temporally consistent product derived from AVHRR and VEGETATION sensor. In: Proceedings of the Third RAQRS Workshop, Valencia, Spain, pp. 428-433.
Wylie, B., Harrington Jr., J., Pieper, R., Maman, A., Denda, I., 1988. 1987 Pasture assessment early warning system – research on satellite-based pasture assessment implementation techniques. Technical report, Integrated Livestock Production Project, Government of Niger/Tufts University/USAID, http://pdf.usaid.gov/pdf_docs/PNABB570.pdf (04/03/2015)
Wylie, B.K., Harrington, J.A., Prince, S.D., Denda, I., 1991. Satellite and ground-based pasture production assessment in Niger: 1986–1988. International Journal of Remote Sensing, 12(6), pp. 1281–1300.