CLOUD DETECTION BASED ON DECISION TREE
OVER TIBETAN PLATEAU WITH MODIS DATA
Lina Xu a,b, *,Shenghui Fang a , Ruiqing Niu b ,Jiong Li b
a School of Remote Sensing and Information Engineering , Wuhan University, Wuhan 430079,China, [email protected] b
China University of Geosciences, Wuhan 430074, China
Commission VIII, WG VIII/10
KEY WORDS: cloud detection, MODIS, Tibetan Plateau, snow cover, decision tree
ABSTRACT:
Snow cover area is a very critical parameter for hydrologic cycle of the Earth. Furthermore, it will be a key factor for the effect of the climate change. An unbelievable situation in mapping snow cover is the existence of clouds. Clouds can easily be found in any image from satellite, because clouds are bright and white in the visible wavelengths. But it is not the case when there is snow or ice in the background. It is similar spectral appearance of snow and clouds. Many cloud decision methods are built on decision trees. The decision trees were designed based on empirical studies and simulations. In this paper a classification trees were used to build the decision tree. And then with a great deal repeating scenes coming from the same area the cloud pixel can be replaced by “its” real surface types, such as snow pixel or vegetation or water. The effect of the cloud can be distinguished in the short wave infrared. The results show that most cloud coverage being removed. A validation was carried out for all subsequent steps. It led to the removal of all remaining cloud cover. The results show that the decision tree method performed satisfied.
* [email protected]; phone +86-27-67883251; fax +86-27-67883251 1. INTRODUCTION
In high altitude regions one of the important water sources are snow. So snow cover is very important in high mountainous areas where snow pack can often remain through the summer months and snow melt provides runoff and water supply for the downstream population. Many areas of the world have large gaps between observation locations or have no observation stations at all. Satellites have enabled researchers to obtain snow information on a global scale and monitor its effects on global climate (Rango, 1996). The Tibetan Plateau is a unique
geomorphic unit and is called “the third pole” of the Earth by its
highest altitude. So it is the most sensitive area in the world to hydrological cycle and climatic change. Mapping the snow cover area of the Tibetan Plateau is very important for the regional climatic change and Hydrological cycle.
Considering that the Earth‟s surface is normally covered by a great amount of cloud at any time (Partridge and Platt 1976), for reliable results from the retrieval of surface characteristics using remotely sensed data absolutely cloud-free pixels are required. But it is unrealistic. We have to consider about how to detect clouds and to remove them.
Clouds have a very similar reflectance as snow. So it is very difficult to distinguish clouds from snow. There are many challenges in mapping snow cover because of the existence of cloud, but three items would be the most inconvenient truth (1) the snow cover are marked by the high reflectance of the cloud; (2) the snow cover are disturbed by the radiance of the cloud; (3) the clouds are misestimate to be snow.
The Moderate Resolution Imaging Spectroradiometer (MODIS) is a 36-band spectroradiometer measuring visible and infrared radiation and obtaining data that are being used to derive
products ranging from vegetation, land surface cover, and ocean chlorophyll fluorescence to cloud and aerosol properties, fire occurrence, snow cover on the land, and sea ice cover on the oceans. The first MODIS instrument was launched on board the Terra satellite in December 1999, and the second was launched on Aqua in May 2002. MODIS provides snow cover information at 500m spatial and daily temporal resolutions.
The MODIS snow product is part of the MODIS snow and sea ice global mapping project conducted by NASA‟s Cryospheric Sciences Branch at the Goddard Space Flight Center. NASA creates daily snow maps indicating snow covered land, land without snow cover, cloud cover, seawater, lake water, and lake ice (Ault, 2006). There are often multiple views of snow cover in each day under clear skies.
In winter MODIS snow cover products had high accuracy, but decreasing accuracy for the rest of the seasons, especially in winter-spring or fall-winter season. The main factor is the existence of the cloud in the snow mapping. So for the snow mapping the biggest challenge is to detect cloud and move it.
In this paper, a decision tree was built to recognize the clouds from background for the MODIS data over Tibetan Plateau. And then cloud pixels were replaced by snow or vegetation or other pixels with a great deal repeating scenes coming from the same area. The goal of this study was to remove the cloud covered pixels from the snow cover data completely and to produce continuous maps of snow coverage over the Tibetan Plateau.
International Archives of the Photogrammetry, Remote Sensing and Spatial Information Sciences, Volume XXXIX-B8, 2012 XXII ISPRS Congress, 25 August – 01 September 2012, Melbourne, Australia
2. MATHOD
Clouds are generally characterized by higher reflectance and lower temperature than the underlying earth surface. So visible and infrared threshold approaches can be used for detection cloud cover. However, there is some surface when this characterization of clouds is inappropriate, most notably over snow and ice.
Clouds have three radiative properties in the visible and infrared spectral range:
1) Clouds are white in the visible and near infrared; 2) Clouds are bright in the visible and near infrared; 3) Clouds are cold in the thermal infrared.
Water and ice clouds show some distinct extinction features at
1.6µm and 3µm.
But some surface like snow, ice has spectral properties that are similar to the clouds properties. Fig.1 shows the repectivity of snow and clouds.
Snow on the ground reflects the sun strongly at one of the MODIS wavelength bands (0.6µm) but very little at another
band (1.6µm). Clouds reflect the sun well at both wavelengths.
Figure 1. Spectral properties of snow and cloud
But clouds seldom show all the properties at the same time. Thin clouds show a portion of the underlying surface spectral properties and low clouds are warmer than the background. Additionally some surface types, like snow, ice and deserts have spectral properties that are similar to clouds. Therefore simple threshold algorithms often don‟t work. Cloud detection algorithms use many different cascaded thresholds. (Saunders, 1988; King, 1992; Ackermann, 1998)
2.1 Clouds detection
Spectral test for cloud detection are based on the fact that clouds are highly reflective in the visible, near, and mid-IR bands and are cold in the thermal bands (Hulley, 2008). These characteristics are used to build thresholds to detect most types of clouds. The Landsat-7 Cloud cover algorithm is based on Lansat-4 and Landsat-5 and MODIS cloud mask. This algorithm uses eight different filters in four bands to distinguish clouds and eliminate problematic land surfaces such as snow and other highly reflective surface.
The MODIS cloud mask is a science data product that will be produced regularly as a Earth Observing System(EOS) standard product. Its main purpose is to identify scenes where land, ocean and atmosphere products should be retrieved based on the amount of obstruction of the surface due to clouds and thick aerosol. (Kathleen, 2005)
MODIS cloud mask algorithm uses a series of sequential tests on the passive reflected solar and infrared observations.
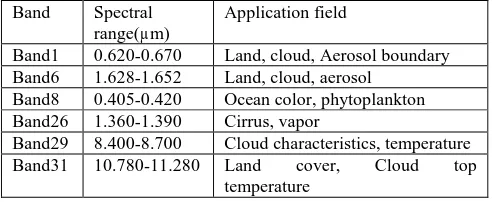
Band Spectral range(µm)
Application field
Band1 0.620-0.670 Land, cloud, Aerosol boundary Band6 1.628-1.652 Land, cloud, aerosol
Band8 0.405-0.420 Ocean color, phytoplankton Band26 1.360-1.390 Cirrus, vapor
Band29 8.400-8.700 Cloud characteristics, temperature Band31 10.780-11.280 Land cover, Cloud top
temperature
Table1.the spectral range and application field of the MODIS bands for the cloud detection
Cloud detection employs the normalized difference cloud index (NDCI) defined as the difference of reflectances observed in two bands divided by the sum of the two reflectances.
Here have two type of NDCI. One is defined as the difference of reflectances observed in a visible band (0.66μm) and a near infrared band (0.936μm). The other is defined as the difference between 0.66μm and 1.64μm.
Cloud is high repectivity in visible band (0.66μm), and it is very appropriate for the discriminate the edge of land and cloud at this band. For the near infrared band (0.936μm) the Spectral characteristic of cloud has relations with the vapors from the atmosphere. It is the vapors absorption valley. So the NDCI is defined as below.
936 . 0 66
. 0 Band
936 . 0 66
. 0 Band NDCI
band
band
(1)
When the NDCI is positive the surface is cloud; when the NDCI is near to zero the surface is soil; when the NDCI is negative the surface may be vegetation.
For the 1.64μm band, the repectivity of snow is less than the cloud.
According to the experience a pixel is mapped as bare soil when NDCI<0; A pixel is mapped as water when NDCI is between 0 and 0.1; NDCI of cloud pixel is from 0.1 to 0.5; NDCI value of snow is great than 0.5.So it is possible to set a suitable threshold to detect cloud and other land cover.
2.2 Cloud removal methodology
Cloud removal is different from cloud detection. The results from cloud detection are cloud mask. But cloud removals are further more. The cloud mask pixel will be replace by its „real pixel‟, such as soil, vegetation, water, snow or other land cover types with a great deal repeating scenes coming from the same area.
International Archives of the Photogrammetry, Remote Sensing and Spatial Information Sciences, Volume XXXIX-B8, 2012 XXII ISPRS Congress, 25 August – 01 September 2012, Melbourne, Australia
Generally speaking, there are 3days, 8 days, 10days, 15days, and one month, three months‟ time interval for the series of composition. Variable time interval means different composition effects. Long is the time interval well is cloud removal. But every coin has two sides. During the long time interval the real pixel maybe change especially in the snowy weather. It is wise to set an appropriate time interval. With the the time series images the cloud pixel would be replaced by the clear pixel. E.g.
are cloud mask from different images. When its value equals 1 it means cloud; when its value equals 0 it means no cloud.
3. STUDY AREA AND DATA 3.1 Study area
Our study area is located in the southwest of Tibetan Plateau. The geographic location of this area ranges in longitude from 80o0‟45.63”E to 85 o0‟8.01”E and latitude from 30 o48.9”N to 32o4.54”N.
Tibet is contiguous to Xinjiang Uygur autonomous Region and Qinghai Province by the Kunlun and the Tanggula Mountains on the north, looks at Sichuan Province across the Jinsha River on the east, is connected with Yunnan Province on the southeast, borders Burmese, India, Bhutan, Sikkim, Nepal and Kashmir.
It has a distance of 2400 km. in length, 200-300 km in width. Its average altitude is over 6000 m, the highest range in the world---Mt. Qomolangma, stands in the middle of the Himalaya range. In its surrounding area of more than 5000sq km, there are four
of the world‟s 8000-meter peaks and thirty-eight of the 7000-meter peaks.
Figure 2 shows the location of study area in the SRTM DEM map. The resolution of SRTM DEM data is about 90m. All the data cover the whole Plateau is 32 longitudes and 15 latitudes. The range of coordinate is from E73 to E104; and from N26 to N40. The total data is 480 scenes. In order to compare with MODIS data conveniently, SRTM DEM data is reprojected to 500m and mosaic together.
Figure2. The topographic map of the Tibetan Plateau from SRTM DEM data (Lina X. 2009)
3.2 Data
MODIS is an imaging spectroradiometer that includes a set of individual detector elements to provide imagery of the Earth‟s surface and clouds in 36 discrete, narrow spectral bands from approximately 0.4 to 14.0μm. Its main land surface objectives
are to study global vegetation and land cover, global land-surface change, vegetation properties, land-surface albedo, land-surface temperature, and snow and ice cover on a daily or near daily basis. MODIS can provide much higher spatial resolution than the NOAA AVHRR instruments. The spatial resolution varies with spectral band and ranges from 250 m to 1 km at nadir.
The data used in this study are MODIS surface reflectivity data productions that include 7 bands with 500m resolution. For the research nearly a series of scenes were downloaded at least one month at the same area.
4. CLOUD DETECTION DREE 4.1 Cloud and snow detection
Many cloud decision methods are built on decision trees. The decision trees were designed based on empirical studies and simulations.
Here, we built a decision tree based on NDCI and image composition. NDCI is defined as the difference between 0.66μm and 1.64μm. Here for the MODIS data, visible band means the MODIS band 1 (0.66μm) and the short wave infrared band means the MODIS band 6 (1.640μm).
Firstly,computing NDCI values based on equal (2). With the
threshold snow pixel without cloud would be confirmed based on the fact that the repectivity of snow is less than the cloud.
Secondly, bare soil and vegetation would be set when the NDCI International Archives of the Photogrammetry, Remote Sensing and Spatial Information Sciences, Volume XXXIX-B8, 2012
XXII ISPRS Congress, 25 August – 01 September 2012, Melbourne, Australia
is less than 0; water would be confirmed based on the MODIS band2. The repectivity is lower than 0.1.
Thirdly, cloud mask can be obtained.
At last, 10-day composites were selected to obtain the real pixel of background.
Figure3. The decision tree of cloud detection
With a great deal repeating scenes coming from the same area
the cloud pixel can be replaced by “its” real surface types, such as snow pixel or vegetation or water.
5. RESULTS AND DISCUSSION
With the launch of NASA‟s MODIS instrument, much research working has been paid on developing all kinds of land surface applications that include the development of snow mapping algorithm for the MODIS data. But clouds have a very similar reflectance as snow. So it is very difficult to distinguish clouds from snow. In this study, a decision tree method was applied to reduce the cloud covered pixels from the MODIS snow cover data.Figure4 shows the cloud mask based on the decision tree. Every scenes of the same area were computed to get the cloud mask.
Figure4. Cloud mask based on the decision tree
Because the daily data will be available, it is easy to composite. Figure 5 shows the results. Snow and other surface can be mapped accurately.
However, it is extremely rare to obtain more data to validate the method. And if there is a storm during the time interval the
results would be unbelievable. More research should be done on cloud detection and removal.
Figure5. The results of 10-day composite snow mapping
6. ACKNOWLEDGE
The authors would like to thank the Earth Observing System Data center for the MODIS data This research was funded by the National High-Tech Research and Development Plan of China under Grant (Project No. 2009AA122004), the special Fund for Scientific Research (Grant No.02092411) and State Basic Research Development Program of China (Grant No. 2008CB425703).
7. REFERENCES
Ackerman, Strabala, et.al., 2002. Discriminating clear sky from cloud with MODIS algorithm Theoretical basis document.
Hulley, G., 2008. A new methodology for cloud detection and classification with ASTER data. Geophysical research letters, 35(1),L16812, pp.1-6.
Kathlee, S., 2005. MODIS cloud mask user‟s guide. University of Wisconsin--Madison
King, M.D., Y.J.Kaufman, W.P.Menzel, et. al., 1992. Remote sensing of cloud, aerosol, and water vapour properties from the moderate resolution imaging spectrometer.IEEE Transactions on Geoscience and remote sensing, 30, pp.1-27.
Partridge, G. W. and Platt, C. M. R., 1976. Radiative processes in meterorology and climatology. Elsevier Scientific Publishing Company, Amsterdam.
Rango, A., 1996. Spaceborne remote sensing for snow hydrology applications. Hydrological Sciences Journal, 41(4), pp.477-494.
Xu, L., Niu, R., et al. Snow cover mapping over the Tibetan plateau with MODIS and ASTER data. Second International Conference on Earth Observation for Global Changes, Proceedings of SPIE - The International Society for Optical Engineering, v 7471.
Images
NDCI
Cloud or snow
Yes No
> 0.1
vegetation,soil,water
No Yes
> 0.7
snow cloud
snow water soil Vegetation
International Archives of the Photogrammetry, Remote Sensing and Spatial Information Sciences, Volume XXXIX-B8, 2012 XXII ISPRS Congress, 25 August – 01 September 2012, Melbourne, Australia