MIGRATE: A FOSS WEB MAPPING APPLICATION FOR EDUCATING AND RAISING
AWARENESS ABOUT MIGRATION FLOWS IN EUROPE
M. A. Brovelli a, M. Minghini a, C.E. Kilsedar a, M. Zurbarán b, M. Aiello c, M. Gianinetto c, *
a Dept. of Civil and Environmental Engineering, Politecnico di Milano, Piazza Leonardo da Vinci 32, 20133 Milano Italy -
(maria.brovelli, marco.minghini, candaneylul.kilsedar)@polimi.it
b Dept. of Systems Engineering, Universidad del Norte, Km 5 Via Pto. Colombia, Barranquilla Colombia -
c Dept. Of Architecture, Built Environment and Construction engineering, Politecnico di Milano, Via Ponzio 31, 20133 Milano Italy
- (martina.aiello, marco.gianinetto)@polimi.it
Commission IV, WG IV/4
KEY WORDS: Web mapping, Open Source, Open Data, FOSS, Crowd-generated data, Human migration
ABSTRACT:
Recent years have seen a noticeable growth in migration flows from Africa and Middle East to Southern Europe, thus generating a remarkable increase of attention on media and public opinion, sometimes resulting in stereotypes and prejudices. Funded by the European Commission - Joint Research Centre through the MYGEOSS program, MIGRation pATtterns in Europe (MIGRATE) aims at educating the citizens about migration fluxes in Europe using a gamification approach based on a trivia game. MIGRATE is completely developed with Free and Open Source Software. On the server-side Django is used to define the models that handle all the required data and tables are created in a PostgreSQL database. Questions and answers are sent in JSON format to the client, while the geospatial layers in GeoJSON format are rendered on the map interface using OpenLayers 3. Bootstrap, HTML5 and CSS3 are used for responsive design, while the jQuery library is used to ease the JavaScript programming. All the data sources used within MIGRATE are available as full and open access with no restrictions for reuse, except for the obligation to mention the source of the input data. Exploited data sources include OpenStreetMap for geospatial information, and UNHCR, IOM, Eurostat and The Migrant’s Files project for non-geospatial information. Overall, data shows how the users’ perceptions change while playing and that players’ awareness of migration-related problems increases with the number of games played. The source code of MIGRATE and the collected data are available respectively under the EU Public License (EUPL) and the CC-BY 4.0 license.
1. INTRODUCTION 1.1 Migration flows in Europe
Migrations have been part of the history of the humankind since the first groups of men ventured out of Africa approximately 60,000 years ago. Looking for a better place to live in is what past and present migrants have in common.
Historically, people were forced to move from a region to another for political instability, conflicts, human rights violation or just to improve their living standards or job opportunities. However, after the Arab Spring (2010), the flow of economic migrants from Africa and Middle East to Southern Europe (mainly Italy and Greece), together with asylum seekers and refugees escaping from civil wars, has seen an extraordinary growth. According to the United Nations High Commissioner for Refugees (UNHCR, 2017), we are currently facing the largest refugee and displacement crisis ever recorded, with about 34,000 people forcibly displaced every day.
With reference to the European Union, about 20,000 illegal migrants coming from Africa, Asia and Middle East crossed the European border in the first two months of 2017 (data updated to March 12th, 2017). Migrants usually undertake very dangerous journeys, by land or sea, which often end up in tragedies, with a huge number of deaths and missing people. In 2016, more than 5,000 people died crossing the Mediterranean Sea (Missing Migrants Project, 2017).
* Corresponding author
Consequently, over the last few years this subject has hit the headlines and gained a remarkable attention and concern in the public opinion. Besides, the general attitude of people living in the hosting countries are not always rational, as they are often driven by fear, misconceptions, and this can result in stereotypes and prejudices.
1.2 The rationale of MIGRATE
In this context, the European Commission – Joint Research Centre (JRC) funded the project MIGRation pATtterns in Europe (MIGRATE) through the third call of MYGEOSS (European Commission, 2016).
remarkable motivational power, game elements should be able to make other, non-game products and services more enjoyable and engaging as well (Deterding et al., 2011; Dicheva et al., 2015). In today’s digital epoch, gamified applications have been developed across different domains such as productivity, finance, health, education, sustainability, marketing as well as news and media (Groh, 2012). Besides, gamification is facing an increasing interest in academic contexts (Huotari et al., 2012).
Strictly concerning education, the majority of the authors share the opinion that gamification has the potential to improve education/learning contexts considered the learning outcomes of gamification as mostly positive in terms of increased motivation and engagement in the learning tasks as well as enjoyment over them. Moreover, by using applications, whether they are gamified or not, citizens become active generators of contents. Consequently, as the web progressively permeates people’s everyday life, users turn to be a source of increasingly reliable information.
Overall, MIGRATE is addressed to a very heterogeneous public, with different education, age, and professional background. The second goal of MIGRATE is to provide a first overview of people’s knowledge and, above all, their perception about migration. This information could help the public authorities to develop a more effective communication strategy of migration-related problems.
2. METHODS 2.1 FOSS-based architecture
MIGRATE is developed as a trivia game where citizens get some new knowledge while playing and, contextually, they generate data useful for statistical analysis. The source code of MIGRATE is released under the open licence EUPL (EU Public License) and is available at https://github.com/kilsedar/migrate.
MIGRATE is fully developed using Free and Open Source Software (FOSS) and the architecture is detailed in Figure 1. On the server-side Django is used to define the models that handle all the required data and tables are created in a PostgreSQL database. Questions and answers are sent in JSON format to the client, while the geospatial layers in GeoJSON format are rendered on the map interface using OpenLayers 3. Bootstrap, HTML5 and CSS3 are used for responsive design, while the jQuery library is used to ease the JavaScript programming. Playing the game requires a free registration. Users are asked to create an anonymous account by providing a nickname and a password. Moreover, gender, age group, country of origin and educational level are asked for statistical analysis. The users’ privacy is always guaranteed: no sensitive or critical information such as name, surname, e-mail or address are collected.
Figure 1. Architecture of the MIGRATE application.
Each game session lasts a maximum of three minutes and is made of six questions belonging to true/false, multiple choice, map-based (the user selects a country on a map) and text-map-based (the user enters a value) categories. To make the game more challenging and keep players engaged, each type of question has a different complexity and the players have only 30 seconds to provide their answer. Thus, the users’ first impression is collected.
In each game questions are grouped in three main themes, characterized by a fixed number of questions of a specific type:
i) One true/false and one map-based questions focus on the general aspects of migration phenomena;
ii) One multiple-choice and one map-based questions focus on the migration phenomenon in the Mediterranean area;
iii) One multiple choice and one text-based questions focus on the user’s macro-region of origin.
More in detail, the following seven macro-regions are defined:
1. Italy; 2. Greece; 3. Spain;
4. Bulgaria, Hungary and the Balkans; 5. Turkey and Middle East;
6. Europe; 7. Africa.
Each question is randomly selected among a set of 20 different questions; for the questions focused on the user’s macro-region of origin, 20 possible questions were created for each of the seven macro-regions. Consequently, a total of 360 questions were prepared and overall 206 different combinations of the six questions are available for each user. This strategy decreases the chance that a user is asked the same questions when playing the game multiple times.
Figure 2 shows an example of a map-based question. When a question is displayed, the map is automatically zoomed and centred on the countries or the geographic area the question refers to. Once a question is answered, an animation shows whether the answer is correct or wrong, a brief explanation and a link to the data source for that specifis answer. Thus, the topic addressed within each question is geographically contextualised, the user’s interest is raised and the player is motivated in further learning. The score of each game is computed as the average of correct answers weighted according to the complexity of each question and the time taken to answer. The overall score updates after each game played to encourage the users playing again. Finally, the players’ scores are posted into a public ranking to keep them motivated in using again the application and, thus, increase their knowledge about migration patterns in Europe.
2.2 Data
2.3.1 Data sources: MIGRATE relies on both geographic and non-geographic data sources. To fully comply with MYGEOSS guidelines, all the data used are available as full and open access with no restrictions for reuse, except for the obligation to mention the source of the input data.
Figure 2. Example of a map-based question. If the player provides a wrong answer, MIGRATE outlines in red the error
and highlights in green the correct answer, providing a short explanation and a link to the data source.
Specifically:
1. Statistics on migration for each country are collected and updated by UNHCR (http://www.unhcr.org); 2. Data about migration flows are provided by the
International Organization for Migration (IOM, https://www.iom.int);
3. Data about casualties come from the Migrants’ Files project (http://www.themigrantsfiles.com), developed by a consortium of European journalists who have built a detailed database on migrants’ deaths in their attempt to reach or stay in Europe from 2000 to 2016; 4. As migration flows strongly affects population
statistics and growing rates of the hosting countries, MIGRATE makes also use of data retrieved by Eurostat, the statistical office of the European Union (http://ec.europa.eu/eurostat).
Table 3 summarizes the data sources used within MIGRATE and their corresponding licenses.
Data source License
OpenStreetMap (OSM) ODbL
United Nations High Commissioner for Refugees (UNHCR)
CC BY-IGO CC BY CC BY-SA ODC-ODbL
ODC-BY PDDL
CC0
International Organization for Migration (IOM)
CC BY-IGO CC BY CC BY-SA ODC-ODbL
ODC-BY PDDL
CC0
The Migrants’ Files ODbL
Eurostat Open customized
copyright/license
Table 3. Data sources used within MIGRATE and their licenses.
2.3.2 Collected data: The anonymous information collected by MIGRATE are stored in a database and are available for download in JSON format under the CC-BY 4.0 license from http://geomobile.como.polimi.it/migrate/download.
3. RESULTS AND DISCUSSION 3.1 Main statistics
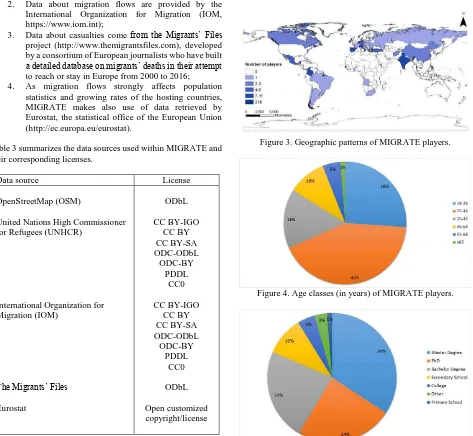
On December 5, 2016 the first MIGRATE challenge lasting for one month and offering prizes to the best players was launched (http://geomobile.como.polimi.it/migrate/challenge). Thanks mainly to this challenge, at the time of writing (April 2017), 318 people from 44 countries have played MIGRATE. Figure 3 shows the geographical distribution of the users. Top countries include Italy, Colombia, India and Spain.
MIGRATE was mainly played by people in the 18-24 years age group (26%) and in the 25-34 years age group (42%). The first class may be related to students, while the second class to early-career workers (see Figure 4). In addition, four fifths of the players had a University education ranging from bachelor’s degree (23%), to master’s degree (34%) and PhD (24%), as summarised in Figure 5.
Figure 3. Geographic patterns of MIGRATE players.
Figure 4. Age classes (in years) of MIGRATE players.
Figure 6. Average user score gained in the first ten games played.
Figure 6 shows the average score (of all players) obtained in the first ten games of MIGRATE. Results clearly highlight how the score increased with the number of games, thus confirming that the overall users’ knowledge about migration-related problems grew while playing.
3.2 Players’ perception
Various aspects of people’s perception about migration flows in the Europe can be inferred by analysing their answers.
The number of correct answers provided by users at the very first game allows to retrieve their original knowledge. Results show that all the people share a general inexact awareness about these topics, as the amount of wrong answers is almost 40% higher than the amount of correct answers. This ratio decreases for Italy, Greece and Spain, which are the European countries that have been most intensively interested by migrants landing in the last few years (see Figure 7).
The analysis of the answers given to text-based questions, which require users to write a number, provided useful information about the extent to which people usually overestimate or underestimate the phenomenon. For this analysis, the players were divided in two groups:
1. Italy;
2. Europe (except Italy) + Turkey.
Results show a significant disparity between the percentages of correct and wrong text-based answers in the first ten games. For Italian players, the number of wrong text-based answers is four times (400%) the number of correct answers, while for players coming from the rest of Europe and Turkey the ratio exceeds ten times (1000%), denoting a higher awareness and knowledge of Italians with respect to other players.
With reference to the wrong answers, Figure 8 shows that the majority of text-based answers were largely overestimated or underestimated. This means that all players, regardless of their country of origin, have hugely misinterpreted the proportion of the phenomena. Besides, users’ distortion of the real magnitude seems also influenced by fear and misconception, as results show a higher number of overestimations than underestimations.
4. CONCLUSIONS
The analysis of results of the MIGRATE games played by users, which are largely the results of the first MIGRATE challenge, provided a useful insight into the knowledge and perception on migration flows in Europe.
Figure 7. Percentage of correct answers given by users in the very first game played, grouped according to the players’
country of origin.
Figure 8. Text-based answers. Extent of overestimations and underestimations expressed as a percentage of the wrong
answers. The rate of overestimation and underestimation exceeds 50% for the majority of the answers, denoting a common misinterpretation of the real magnitude of migration
flows.
Overall, findings show that users’ original knowledge was substantially inexact and that some differences emerges according to their country of origin. Knowledge and awareness of people coming from countries more intensively interested by landings seem characterized by a higher accuracy.
Besides, data analysis proved that after playing MIGRATE several times, users have increased their awareness of migration-related problems compared to their original consciousness. Nevertheless, results show that users share the tendency to highly overestimate or underestimate migration flows magnitude, reflecting the remarkable influence of media in their everyday life. Findings also reveal that the gamification approach used within MIGRATE can contribute to fill the lack of knowledge about migration-related themes which is rather widespread among the population. Finally, the development of MIGRATE has shown the maturity and suitability of FOSS in designing a complex application tailored to the project needs.
ACKNOWLEDGEMENTS
This application was developed within the MYGEOSS project, which has received funding from the European Union’s Horizon 2020 research and innovation programme.
REFERENCES
Deterding, S., Dixon, D., Khaled, R. and Nacke, L., 2011. From game design elements to gamefulness: defining “gamification”. In: 15th International Academic MindTrek Conference: envisioning future media environments, Tampere, Finland, pp. 9-15.
Deterding, S., Björk, S. L., Nacke, L. E., Dixon, D., & Lawley, E. (2013, April). Designing gamification: creating gameful and playful experiences. In: CHI'13 Extended Abstracts on Human Factors in Computing Systems, pp. 3263-3266.
Dicheva, D., Dichev C., Agre, G. and Angelova, G., 2015. Gamification in Education: A Systematic Mapping Study. Educational Technology & Society, 18 (3), pp. 75–88.
Groh, F. (2012). Gamification: State of the art definition and utilization, Institute of Media Informatics Ulm University, 39.
Hamari, J., Koivisto, J. and Sarsa, H., 2014. Does gamification work? – A literature review of empirical studies on gamification. In: 47th Hawaii International Conference on System Sciences, Waikoloa, Hawaii, USA, pp. 3025-3034.
Huotari, K. and Hamari, J., 2012. Defining Gamification – A Service Marketing Perspective. In: 16th International Academic MindTrek Conference, Tampere, Finland, pp. 17-22.
UNHCR, http://www.unhcr.org/
Missing Migrants Project, 2017,
https://missingmigrants.iom.int/latest-global-figures
European Commission, 2016. MYGEOSS - Applications for
your environment,