Alaska North Slope crude oil price and the
behavior of diesel prices in California
Bahram Adrangi
a,U, Arjun Chatrath
a, Kambiz Raffiee
b,
Ronald D. Ripple
caSchool of Business Administration, Uni
¨ersity of Portland, 5000 N. Willamette Bl¨d., Portland, OR 97203, USA
bDepartment of Economics, College of Business Administration, Reno, NV 89557, USA
c
Faculty of Business, School of Finance and Business Economics, Edith Cowan Uni¨ersity, 100 Joondalup Dri¨e, Joondalup, Western Australia 6027, Australia
Abstract
In this paper we analyze the price dynamics of Alaska North Slope crude oil and L.A. diesel fuel prices. We employ VAR methodology and bivariate GARCH model to show that there is a strong evidence of a uni-directional causal relationship between the two prices. The L.A. diesel market is found to bear the majority of the burden of convergence when there is a price spread. This finding may be seen as being consistent with the general consensus that price discovery emanates from the larger, more liquid market where trading volume is concentrated. The contestability of the West Coast crude oil market tends to cause it to react relatively competitively, while the lack of contestability for the West Coast diesel market tends to limit its competitiveness, causing price adjustment to be slow but to follow the price signals of crude oil. Our findings also suggest that the derived demand theory of input pricing may not hold in this case. The Alaska North Slope crude oil price is the driving force in changes of L.A. diesel price. Q 2001 Elsevier Science B.V. All rights
reserved.
JEL classification:Q40
Keywords:Price of Alaska North Slope crude oil; Diesel fuel prices in California
U
Corresponding author. Tel.:q1-503-943-7224; fax:q1-503-943-8041.
Ž .
E-mail address:[email protected] B. Adrangi
0140-9883r01r$ - see front matterQ2001 Elsevier Science B.V. All rights reserved.
Ž .
1. Introduction
The process of price discovery, the process by which market prices incorporate information, has been the subject of many papers in the past. Garbade and Silber Ž1979 , Harris et al. 1995 , Roell 1992 , and Hasbrouck 1995 , among others, are. Ž . Ž . Ž . examples of studies that investigate the informational advantages of markets for single assets or indices. Others examine information flow across markets for similar but not identical assets or indices.
Ž .
For instance, Conrad and Kaul 1991 examine the information flow between
Ž . Ž .
large stocks and small stocks, and Hamao et al. 1990 and Karolyi and Stulz 1996 examine the spillovers between US and foreign markets. The consensus has generally been that information disseminates from the more liquid markets where trading volume is concentrated.1
We investigate the price discovery process between the prices of Alaska North
Ž . Ž .
Slope crude oil ANS and diesel fuel in Los Angeles LAD . Documenting pricing leadership between these commodities could aid trading strategies or imply market inefficiencies. However, the issues relating to the linkages between prices of these two commodities are pertinent beyond these usual motives.
The role of ANS crude oil on the U.S. West Coast is significant. On average roughly half of all crude-oil feedstocks for the region’s refineries flow from the North Slope to support that sourced from California fields and imports. These crude oils feed the refineries that produce the LA diesel, which is also a good indicator of the middle-distillate range of refined products produced and consumed in the region.
The California refinery sector constitutes a system somewhat unto itself. Given environmental regulations more stringent than elsewhere on the West Coast, or the rest of the US, the dynamics of the relationships between crude oil feedstock prices and products prices within the region are of importance to understand the pricing activities observed within the region.
Historically, the West Coast market has been seen as isolated from the rest of the North American continent as a result of the barrier formed by the Rocky Mountains. While crude oil and products flowed between California and the East-of-the-Rockies markets, the volumes were relatively small and typically un-able to respond with rapidity to perceived arbitrage opportunities. Because of the
Ž .
difficulty read cost of interconnecting California and the East-of-the-Rockies markets for petroleum flows, ANS was sent via ship through the Panama Canal, initially, and then via ship and a new pipeline across Panama, so it could reach the U.S. Gulf Coast and the East Coast refineries because exports were legally prohibited.
The removal of the export ban on ANS has done little to change the relationship between ANS and other crude oils marketed in the global market.2 This may be
1 Ž . Ž .
viewed as support for the argument that ANS pricing had indeed been integrated
Ž .
into the world market in advance of the removal of the ban see Ripple, 1995a,b . Hence, while we examine the pricing dynamics for ANS from within the region, we are aware that these are closely related to the prices of global crude oils that contest this market.
Economic theory offers the concept of derived demand to explain the relation-ship between the prices of products for final consumption and those for intermedi-ate goods employed in the production process for their manufacture. According to derived demand, the price of the intermediate good should be determined by its contribution to the market value of the manufactured good in final consumption, reflected in its market price. Stated differently, we would expect the direction of dynamic pricing information to flow from the product price back upstream to the intermediate good price. Therefore, if a causal relationship can be identified, we would expect it to flow from the price of diesel to the crude oil price, if derived demand inferences are to hold.
Depending upon the strength of the causality and the lead time found in the relationship between the prices, knowledge of the relationship dynamics may provide participants in the industry with useful information regarding the direction and timing of pricing changes for ANS. If, on the other hand, the dynamics do not support the hypothesis of derived demand, we may conclude that differences in market power at various stages of the industry, e.g. production versus refining versus marketing, break down the expected direction of price information flow, and may even reverse it. If the direction of information flow is reversed, i.e. causality is
Ž .
found to flow from crude oil to products intermediate good to final good , this information may still be of interest to market participants. Then changes in the observed price of ANS may be an indication of the likely change for diesel and others products.
The market structure changes along the continuum of this industry, and the interpretation may be dependent upon the assumptions. For example, there is essentially a single seller of ANS on the West Coast, BP. If the West Coast is viewed as isolated from international competition, the sale of ANS may be interpreted as monopolistic. If, on the other hand, the West Coast is viewed as being fully exposed to international competition, as we do, the sale of ANS may be
Ž
viewed as oligopolistic, tending toward competitive any crude oil may enter this .
market .
The refining sector in California is populated by several major and independent refiners, and there are other refiners on the West Coast. As such, this sector tends to be oligopsonisticroligopolistic. Downstream, the wholesale buyers tend to be a bit more competitive than refining and retailers perhaps more competitive. How-ever, there is essentially no contestability of the diesel market from outside California and no market for the diesel beyond its borders.
2
Over 20 years ago, the export of ANS from the US to international markets was banned in order to promote self-sufficiency in the US. As part of the enabling legislation that approved the building of the Trans-Alaska Pipeline System, exports of the ANS crude oil were banned. The ban was lifted in 1996.
Ž . Ž .
The quasi-oligopolyroligopsony interaction in the input market and a fairly competitive output market in California lends further interest to the relationship between the prices of these two linked energy commodities. The lack of constancy of market structure along the industry continuum will tend to interrupt the dynamic flow of information that may otherwise be expected. Causality and information spillover findings in the California market may be compared with the national market data. Traders, refineries, and policy makers may be able to extract crucial information from the results of this paper.
Another set of motives for examining the nature of the linkages between the ANS and LAD are derived from market microstructure theories that relate the price discovery process to market liquidity or price volatility. Several financial models are predicated on the notion that trades are informative so that
informa-Ž . tion disseminates from more liquid markets. For example, Verrecchia 1981 and
Ž .
Kim and Verrecchia 1991 , among others, investigate the link between public information announcements and volume.
The following analysis employs time series analytical tools to evaluate the relationship, if one exists, between the price of ANS and the price of diesel in Los Angeles. We employ daily closing prices of Alaska crude oil, ANS and the L.A. diesel price. The two prices are shown to be cointegrated, indicating that the two prices do not wonder off too far apart and price differences between the two are mean reverting. The LAD mainly bears the burden of convergence if there is a price convergence between the two, suggesting a uni-directional causality. The Granger causality tests verify that movements in crude oil prices cause fluctuations in the price of diesel fuel in L.A. Furthermore, we find that information flow is also uni-directional and the information shock volatility spillover occurs from the crude oil into the L.A. diesel market.
The organization of the rest of this paper is as follows. Section 2 presents the data and empirical models. The paper findings are discussed in Section 3. The last section presents a summary and conclusions.
2. Data and methodology
The daily prices of diesel fuel in Los Angeles and crude oil of Alaskan North Slope constitute our data set. This data set is unique in the sense that daily regionally disaggregated data have just recently become available. Returns are
U Ž . U Ž .
given by 100 log PtrPty1 , or 100 Dlog Pt , where Ptis the price at the end of the day. Prior research on information flows between markets has typically focused on lead-lag relationships between asset returns. Such an approach may provide only a limited or biased inferences of information flows between markets. Informationally linked markets may share some common stochastic trends, react asymmetrically to information, andror exhibit time varying volatility. Failure to incorporate such effects can invalidate the statistical inferences relating to the relationships. Fur-thermore, it becomes important to recognize that information effects and volatility
Ž .
This study employs a general approach to investigate the flow of information between Alaska crude oil and L.A. diesel. The approach takes into account the time varying volatility in these commodities while allowing for inter-market volatil-ity spillover, and asymmetrical effects of the variation in the spread between ANS and LAD.
where variables Cand D represent the prices of ANS and LAD, respectively, and
DlnCt and DlnDt are the returns on the crude oil and diesel prices, respectively, ŽlnCylnD.ty1 is the lagged difference in the log prices of the crude and diesel which accounts for the convergence pressures in the two price series, and«C,t and
«D,t are the random disturbance terms. The above error-correction specification is widely used to investigate the lead-lag relationship in financial markets. For instance, the estimation of significant coefficients on lagged changes in C and D equation would typically be interpreted as the existence of information flows from
Ž < <
the crude oil to the diesel markets. The l coefficients 0F l F1,with strict .
inequality for at least one coefficient indicate the burden of convergence between the two commodities. If lC-0 and lDs0, when the price spread widens the crude price falls in the process of convergence. Similarly, if lD)0 andlCs0, the diesel price converges to the crude price. As discussed later, the two prices are
Ž . Ž . cointegrated so that an error correction term is warranted in Eqs. 1 and 2 .
There are strong reasons to suspect that the variance of the error terms in the above VAR equations are time varying. Theory suggests that informed trading will
Ž .
induce persisting changes in the volatility of these commodities Kyle, 1985 , and there is a great deal of evidence that many financial price series exhibit time varying volatility. Specific to debt securities, several researchers have argued that
w Ž .
interest rate risk premia are time variant for instance, Shiller 1979 and Singleton Ž1980 . Weiss 1984 and Engle et al. 1990, 1987 find significant ARCH effects or.x Ž . Ž . serial correlation in variances in short term rates over several decades. In the present study, variance persistence or clustering may arise from market features unique to energy markets such as market limits, etc.
There is also reason to suspect that these variance effects are correlated across Ž .
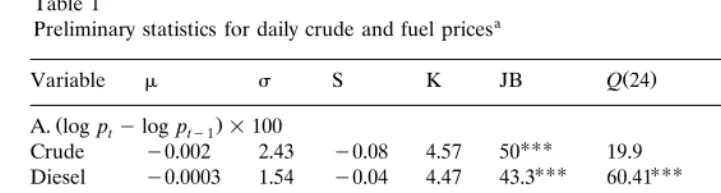
Table 1
a
Preliminary statistics for daily crude and fuel prices
2
Crude y0.002 2.43 y0.08 4.57 50 19.9 81.29 12.76
UUU UUU
Diesel y0.0003 1.54 y0.04 4.47 43.3 60.41 26.92 10.05
Ž .
B. Standardized return residuals}univariate GARCH 1,1 model
UUU
Crude 0.03 1.00 0.11 3.17 28.6 13.7 28.26 3.72
UUU UUU
Diesel y0.0003 1.00 y0.02 3.20 29 36.65 21.42 5.44
aNotes
:m,s, S, and K, are the mean, standard deviation, skewness, and kurtosis, respectively. JB is
Ž . Ž 2
the Jarque]Bera statistic for normality test. ARCH 5 is the Lagrange multiplier test x with p
. Ž .
degrees of freedom for ARCH errors Engle, 1982 . Higher order ARCH errors also provided significant statistics in panel A and insignificant statistics in panel B. Significant atU
10%,UU
persistence may be common across different and related series, so that linear Ž .
combinations of the variables show lesser persistence. Ross 1989 argues that volatility may be regarded as a measure of information flow. Thus, if information arrives first in the crude oil market, one should see a volatility spillover from that market to the diesel market. Therefore, to study the price dynamics in the crude oil and diesel markets, an appropriate extension to the above VAR model will be employed to simultaneously allow for time varying volatility and volatility spillovers between the commodities.
The statistics in Table 1 justify some of the above suspicions relating to the Ž . 2Ž .
variance of returns in the two series analyzed. The Ljung]Box Q24 and Q 24 statistics indicate significant levels of serial correlation in the returns and the square of the returns. These statistics indicate linear and nonlinear dependencies
Ž .
in daily prices. Test statistics for ARCH errors Engle, 1982 further suggest serial correlation in the errors. On the other hand, there is less evidence of serial dependencies in the standardized residuals from fitting the returns to a GARCH Ž1,1 model. The. 3 Ž . 2Ž .
Q24 statistics are substantially smaller and the Q 24 statistics are smaller or insignificant. Such evidence indicates that the most basic GARCH model effectively captures the non-linearities in the data. Moreover, the standard-ized residuals exhibit relatively smaller kurtosis, further evidence of the GARCH
Ž .
model providing a superior fit to the data Hsieh, 1989 .
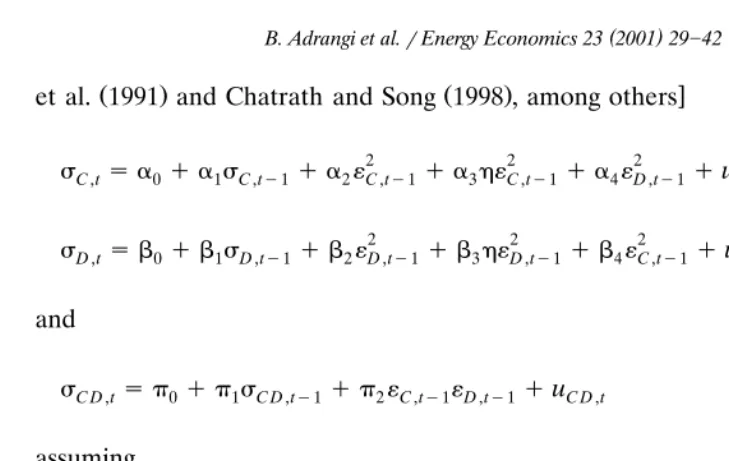
The relationship between the LAD and ANS while simultaneously controlling for the likely variance and covariance persistence is studied via the bivariate
w Ž .
GARCH model similar models have been employed by Hamao et al. 1990 , Chan
3 Ž . Ž .
We choose Bollerslev’s GARCH 1,1 model Bollerslev, 1986 over higher order ARCH or GARCH
Ž .
models due to the strong support found for this model in recent work. Moreover, the GARCH 1,1
Ž .
Ž . Ž . x
et al. 1991 and Chatrath and Song 1998 , among others
2 2 2 Ž .
sC,tsa0qa s1 C,ty1qa «2 C,ty1qa h«3 C,ty1qa «4 D,ty1quC,t 3
2 2 2 Ž .
sD,tsb0qb s1 D,ty1qb «2 D,ty1qb h«3 D,ty1qb «4 C,ty1quD,t 4
and
Ž .
sC D,tsp0qp s1 C D,ty1qp «2 C,ty1«D,ty1quC D,t 5
assuming
<Vty1yStudent’st
«
ˆ
C,tž /
0 sC,t sC D,t ,Qs s
ž
/
ž /
«ˆ
D,t 0 C D,t D,tŽ .
where sC,t andsD,t are the variance functions of and respectively conditional on Ž .
information set V available up to time ty1;his a dummy variable that captures the asymmetric effects of positive and negative news; sC D,t represents the condi-tional covariance given by an autoregressive linear function of the cross product in the past squared errors;ui t are the randomly distributed regression errors;Qis the inverse of the degrees of freedom in the Student’s t distribution, and the condi-tional correlation,
y1r2
Ž .
rC D,tssC D,t sC,tsD,t
is allowed to vary over time.
Ž . Ž .
The parameters a1 and b1 in Eqs. 3 and 4 are the measures of volatility persistence in the LAD and ANS markets, respectively, with a large value indicat-ing that the conditional variance remains elevated for extended periods of time following return shocks. The parameters a4 and b4 are intended to capture the volatility spillovers between markets. For instance, a4s0 and b4)0 would be consistent with the hypothesis that the volatility spills over from the ANS market to the LAD, and not vice versa.
3. Empirical results
Table 2 reports results from stationarity and cointegration tests. The augmented
Ž . Ž
Dickey]Fuller Dickey and Fuller, 1979 and Phillips]Perron test statistics Phillips .
Table 2
a
Ljung]Box and unit root test statistics
Contract With trend Without trend
Crude y10.34 y22.9 y2.28 y2.28 y10.33 y22.8 y2.22 y2.22
UUU UUU UUU UUU
Diesel y7.55 y19.7 y2.44 y2.53 y7.55 y19.7 y2.29 y2.37
Long-term equilibrium: Johansen]Juselius maximum likelihood procedure based on maximal eigenvalue and trace of the stochastic matrix
Ho Ha lma x ltrace
Notes: ADF and PP stand for the augmented Dickey]Fuller and Phillips]Perron test statistics of
Ž .
unit roots. The critical values of both statistics are provided by MacKinnon 1990 . Variables included in the cointegrating vector are log of prices of LA Diesel and Alaska crude.r stands for the number of
Ž . U
cointegrating vectors. Critical values are taken from Osterwald-Lenum 1992 . Significant at 10%,
UU
5% andUUU
1% levels, respectively.
b
No deterministic trend in data, intercept but no trend in cointegrating vector.
c
Linear deterministic trend in data, intercept and trend in cointegrating vector, and no trend in VAR.
d
Quadratic deterministic trend in data, intercept and trend in cointegrating vector, linear trend in VAR.
level series. Thus, as with most other financial instruments, there is evidence of one unit root in these prices. Furthermore, the test statistics reject the null that the
Ž .
spread difference in log of prices is non-stationary, providing evidence that the two series are cointegrated.
Ž
The Johansen trace and maximum-eigenvalue tests statistics Johansen and .
Juselius, 1990 presented in Table 2 provide an alternate test for cointegration of the LAD and ANS prices. The null hypothesis of zero cointegrating vectors
Ž .
between the two prices rs0 is rejected at the 0.01 level. We can conclude that there is one cointegrating vector between the two price series as the trace and eigenvalue statistics fail to reject the null of F1 cointegrating vectors.
Given prior evidence that the Johansen tests are sensitive to the inclusion of
Ž .
drift terms in its near-VAR specification for instance, Diebold et al., 1994 , it is worth noting that the Johansen tests provided similar results across models with and without controls for trend.
Ž . Ž .
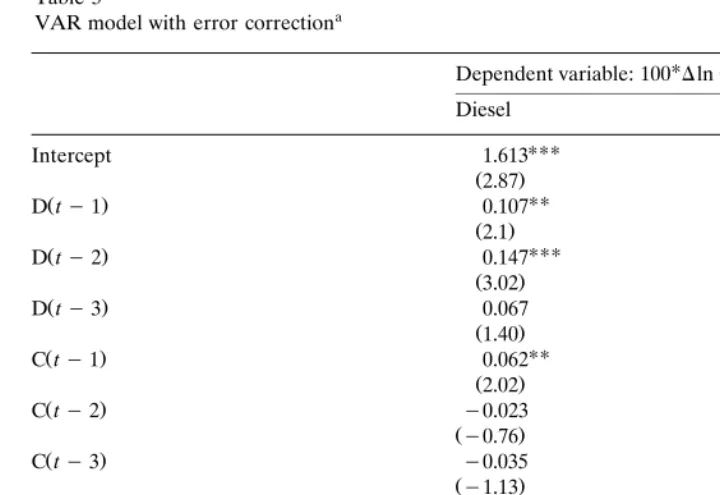
Table 3
Notes: VAR dimension is determined by minimizing the Akaike information criterion. Significant at
UUU
1%,UU
5% andU
10% levels, respectively. The F-values are reported for the Granger causality test.
As there is strong evidence of a long-run relationship between the two series, an error correction term is appended to the VAR system. The specification produces
Ž .
independently distributed residuals as indicated by theQ12 statistics. The results from this estimation are shortly compared to those from the joint estimation of the mean and variance equations.
The coefficients and F-values reported in Table 3 suggest a strong causality from ANS to LAD returns. The significant positive coefficient of the lagged spread in the LAD equation, coupled with the insignificant coefficient in the ANS equation, suggests that the LAD price bears the majority of the burden of convergence in the two prices, verifying the uni-directional causality between the two prices.
Table 4 reports the findings of the impulse response analysis. It is clear from this table that the LAD is sensitive to shocks to ANS for 2 days, as indicated by significant impulse responses. However, the Alaska crude oil prices do not manifest such a sensitivity toward L.A. Diesel price shocks. The findings of impulse response analysis corroborate the causality direction established in Table 3 and further suggest that information spillover may be occurring from the crude oil market to the L.A. diesel market. Fig. 1 presents the graphs of impulse responses.
Ž . Ž .
Table 4
a
Impulse response analysis
Period Response S.D.
Response of L.A. diesel price to 1 S.D. shock to Alaska crude prices
Response of Alaska crude oil prices to 1 S.D. shock to L.A. diesel price
: Variables are daily returns of Alaska Crude and L.A. Diesel, respectively. VAR orders p in
Ž . Ž .
each market is determined by minimizing the multivariate version of the AIC: AIC p sln detÝu q
Ž 2 . Ž .
2M =prT, where Ýu is the residuals covariance matrix of VAR p systems,T and p are the number of observations and the lag order and in the VAR. The final value of pis 3. Ordering of the variables in estimated VAR models is Alaska Crude and L.A. Diesel returns. Standard deviations of
Ž
impulse responses are estimated by ns100 Monte Carlo simulations. Impulse responses impact
. U
multipliers beyond five periods were negligible or zero. Significant at 5% level.
Ž . Ž . should be noted, however, that the non-linear estimations of mean Eqs. 1 and 2 continued to support the evidence of uni-directional causality between the two returns, and the evidence that the LAD bears the burden of convergence between the two price series.
The coefficients for the lagged variances in the variance equations suggest considerable volatility persistence for both prices. There is strong evidence of volatility spillover from the ANS market to the LAD market. The coefficient on the inter-market lagged shocks is significant at the 0.05 level in the LAD equation. However, volatility spillover in the opposite direction does not occur. The compar-ison of the relative size of the intermarket lagged shocks shows that the volatility spillover is uni-directional, corroborating causality test and impulse response
Ž .
analysis results. According to Ross 1989 , such evidence would be consistent with information arriving in the crude oil market first. There is also evidence of persistence in the covariance of the two returns as indicated by the significant coefficient on sC D ty1. Finally, the diagnostics support the specification of the
2Ž .
model. The Q 12 statistics for autocorrelation in the squared standardized residuals are insignificant and the sign bias t-statistics suggest that the
standard-Ž .
Fig. 1. Response of Alaska crude and L.A. diesel to 1 S.D. innovations.
4. Summary and conclusion
Table 5
a
Bivariate GARCH model with volatility spillovers
Variance equation Diesel Alaska Crude
Ho: intermarket lagged shocks are equal x 1 s3.54 Conditional covariance equation
Sign biast-statistic y0.11 y1.41
System log likelihood y994.46
a
Notes: Returns and conditional variance equations are estimated in a system assuming variance
2Ž .
correlations are constant. Q 12 is the Ljung]Box statistics of the autocorrelation in the square of
Ž .
standardized residuals «i tr6si t. The sign bias test shows whether positive and negative innovations
Ž .
affect future volatility differently from the model prediction see Engle and Ng, 1993 . Significant at
UUU
1%,UU
5% andU
10% levels, respectively.
majority of the burden of convergence when there is a price spread. In other words, the diesel price appears to follow the pricing signals given by the crude oil price, however, the rate of adjustment is rather slow. This finding may be seen as being consistent with the general consensus that price discovery emanates from the larger, more liquid market where trading volume is concentrated. The contestabil-ity of the West Coast crude oil market tends to cause it to react relatively competitively, while the lack of contestability for the West Coast diesel market tends to limit its competitiveness, causing price adjustment to be slow but to follow the price signals of crude oil.
and thus price determination, from the intermediate to the final good. This information may be of interest to policy makers and market participants. Policy makers need to be aware of the direction of flow of pricing determination and the influence of global markets on domesticrregional markets. Market participants, such as refiners, need to be aware of the nature of the pricing dynamics to better optimize their systems.
References
Baillie, R.T., Bollerslev, T., 1990. A multivariate generalized ARCH approach to modelling risk premia in forward foreign exchange rate market. J. Int. Money Finance 9, 309]324.
Blume, L., Easley, D., O’Hara, M., 1994. Market statistics and technical analysis: the role of volume. J. Finance 49, 153]181.
Bollerslev, T., 1986. Generalized autoregressive conditional heteroskedasticity. J. Econometrics 31, 307]327.
Conrad, J., Kaul, G., 1991. Asymmetric predictability of conditional variance. Rev. Financial Stud. 4, 597]622.
Conrad, J., Hameed, A., Niden, C., 1994. Volume and autocovariances in short-horizon individual security returns. J. Finance 49, 1305]1329.
Dickey, D.A., Fuller, W.A., 1979. Distribution of the estimators for autoregressive time series with a unit root. J. Am. Stat. Assoc. 74, 427]431.
Diebold, F.X., Gardeazabal, J., Yilmaz, K., 1994. On cointegration and exchange rate dynamics. J. Finance 49, 727]735.
Engle, R.F., 1982. Autoregressive conditional heteroskedasticity and estimates of the variance of U.K. inflation. Econometrica 50, 987]1008.
Engle, R.F., Ng, V.K., 1993. Measuring and testing the impact of news on volatility. J. Finance 48, 1749]1778.
Engle, R.F., Lilien, D.M., Robins, R.P., 1987. Estimating time varying risk premia in the term structure: the ARCH-M model 55, 391]407.
Engle, R.F., Ng, V.K., Rothschild, M., 1990. Asset pricing with a factor ARCH co-variance structure: empirical estimates or treasury bills. J. Econometrics 45, 213]238.
Garbade, K.D., Silber, W.L., 1979. Dominant and satellite markets: a study of dually-traded securities. Rev. Econ. Stat. 61, 455]460.
Hamao, Y., Masulis, R.W., Ng, V., 1990. Correlations in price changes and volatility across international stock markets. Rev. Financial Stud. 3, 281]308.
Harris, F.H., McInish, T.H., Shoesmith, G.L., Wood, R.A., 1995. Cointegration, error correction, and price discovery on informationally linked security markets. J. Financial Quantitative Anal. 30, 563]579.
Hasbrouck, J., 1995. One security, many markets: determining the contribution to price discovery. J. Finance 50, 1175]1199.
Hsieh, D.A., 1989. Testing for nonlinear dependence in exchange rate changes. J. Business 62, 339]368. Johansen, S., Juselius, K., 1990. Maximum likelihood estimation and inference on cointegration}with
applications to the demand for money. Oxford Bull. Econ. Stat. 52, 169]210.
Karolyi, G.A., Stulz, R.M., 1996. Why do markets move together? An investigation of US]Japan stock return comovements. J. Finance 51, 951]986.
Kim, O., Verrecchia, R.E., 1991. Market reactions to anticipated announcements. J. Financial Econ. 30, 273]310.
Kyle, A.S., 1985. Continuous auctions and insider trading. Econometrica 53, 1315]1336.
Phillips, P.C.B., Perron, P., 1986. Testing for Unit Roots in Time Series Regression, Discussion Paper. Yale University, Cowles Foundation, New Haven, CT.
Ripple, R.D., 1995a. Alaska North Slope crude oil: when will the US west coast market reflect global market conditions? Energy Advisory, No. 153, East]West Center.
Ripple, R.D., 1995b. The value of Alaska North Slope crude oil in Asia: will there be a premium over US market values? Energy Advisory, No. 159, East]West Center.
Ripple, R.D., Wilamoski, P., 1995. Is the world oil market ‘one great pool?’: Revisited, OPEC Review, Winter, pp. 283]292.
Roell, A., 1992. Comparing the performance of stock exchange trading systems. In: Fingleton, J.,
Ž .
Schoenmaker, D. Eds. , The Internationalization of Capital Markets and the Regulatory Response. Graham and Trotman, London.
Ross, S., 1989. Information and volatility: the no-arbitrage approach to timing and resolution of irrelevancy. J. Finance 44, 1]17.
Shiller, R., 1979. The volatility of long-term interest rates and expectations models of term structure. J. Polit. Econ. 87, 1190]1219.
Singleton, K.J., 1980. Expectations models of the term structure and implied variance bounds. J. Polit. Econ. 88, 1159]1176.
Tang, C., Ripple, R.D., 1996. Potential value of Alaska North Slope crude oil to China: a refinery modelling analysis. OPEC Rev. June, 165]179.
Weiss, A., 1984. ARMA models with ARCH errors. J. Time Ser. Anal. 5, 129]143.