Finance And Other Services Sectors In Peninsular Malaysia, Sabah
and Sarawak :
Testing for Stochastic Convergence
Muzafar Shah Habibullah
1*,
M. T. Hirnissa
2, and A.H. Baharom
31,2Faculty of Economics and Management, Universiti Putra Malaysia, 43400 UPM Serdang, Selangor, Malaysia. 3Taylors Business School, Taylors University, 47500 Subang Jaya, Selangor, Malaysia.
*Corresponding author: [email protected]
Abstract - In the last four decades, the financial services sector has becoming more important for the Malaysian economy. Despite gaining importance for enhancing economic growth, the contribution of the finance sector to the total services real Gross Domestic Product (GDP) has been ranked second in Peninsular Malaysia, third in Sabah and fourth in Sarawak. The purpose of the present paper is to determine whether the contribution of the financial services sector in the three regions in Malaysia, namely Peninsular Malaysia, Sabah and Sarawak show any distinct pattern. In the jargon of economic development literature, we seek to determine whether there is “convergence” or similarity in the patterns of the performance of the financial services sector among the three regions. Generally, our results suggest divergence of the finance sector and other sub-sector of the services among the three regions.
Keywords : Financial services sector; Economic growth; Convergence; Malaysia
Introduction
Economists and policy makers have recognized that finance has been widely accepted as important prerequisite for sustaining long-run economic growth (see Lewis, 1955; Nurkse, 1962). In the 1980s, recognizing the importance of finance to enhance growth, many developing countries has embarked on financial liberalization programs to acquire greater financial depth to contribute to growth by improving the productivity of investment. Faster growth, more investment and greater financial depth all come partly from higher saving (World Bank, 1989).
The importance of the saving and investment process in economic development arises because capital goods depreciate over time, a significant flow of saving must be generated and transferred into productive investment just to maintain a nation‟s capital stock and preserve existing living standard. For living standard to rise, a healthy flow of saving and investment must be sustained. As a general proposition, the greater the proportion of current output saved and invested, the more rapid the rate of economic growth. In a modern society, the process of investment is separated from the savings process due to specialization and division of labor in the economy. Thus, the function of the financial institutions is to provide the conduit where funds are channeled from savers to the investors. By reducing the asymmetry of information for borrowers and lenders, the allocation of funds to the most productive sectors can be made, thereby increasing economic efficiency and social welfare. This suggests the link between the financial sector and economic development. A key prediction of neoclassical growth models is that the income levels of poor countries will tend to catch up with or converge towards the income levels of rich countries as long as they have similar characteristics – for instance saving rates. A key prediction of neoclassical growth models is that the income levels of poor countries will tend to catch up with or converge towards the income levels of rich countries as long as they have similar characteristics – for instance saving rates. The neoclassical growth model, also known as the Solow–Swan growth model or exogenous growth model, is a class of economic models of long-run economic growth set within the framework of neoclassical economics. Neoclassical growth models attempt to explain long run economic growth by looking at productivity, capital accumulation; population growth and technological progress (see Solow (1956) and Swan (1956).
The role of financial sector as the engine of growth or supply-leading in enhancing growth goes far back to the work of Schumpeter (1934). Schumpeter argues that financial sector leads economic growth by acting as a provider of fund for productive investments and therefore could lead to accelerating economic growth. The theoretical work in linking the role of the financial sector and economic growth are provided in the later years, among others by Pagano (1993), Greenwood and Jovanovic (1990), Levine (1991), Bencivenga and Smith (1991) and Saint-Paul (1992).
RESEARCH PAPER
Pagano (1993) provides a simple endogenous growth model called the AK model to look at the impact of financial development on economic growth. In his model, banks increase the productivity of capital, thereby promoting growth. Thus savings channeled through financial institutions are allocated more efficiently, and the higher productivity of capital results in higher growth. On the other hand, Greenwood and Jovanovic (1990), Levine (1991), Bencivenaga and Smith (1991) and Saint-Paul (1992) indicate that efficient financial market improve the quality of investments and promotes economic growth.
Bencivenga and Smith (1991) contend that banks as liquidity provider permit risk-averse households to hold interest-bearing deposits and the funds obtain are then channel to productive investment. By eliminating self-financed capital investment by firm, banks also prevent the unnecessary liquidation of such investment by firms who find that they need liquidity. In other words, financial intermediaries permit an economy to reduce the fraction of its savings held in the form of unproductive liquid assets, and to prevent misallocations of invested capital due to liquidity needs. This suggests that financial intermediaries may naturally tend to alter the composition of savings in a way that is favorable to capital accumulation, and if the composition of savings affects real growth rates, financial intermediaries will tend to promote growth.
Levine (1991) demonstrates that stock markets help individuals‟ manage liquidity and productivity risk and as a result, stock markets accelerate growth. According to Levine, in the absence of financial markets, firm-specific productivity shocks may discourage risk-averse investors from investing in firms. However, the stock markets allow individuals to invest in a large number of firms and diversify against idiosyncratic firm shocks. This raises the fraction of resources allocated to firms, expedites human capital accumulation and promotes economic growth. In other words, Levine concur that growth only occurs if society invests and maintains a sufficient amount of capital in firms that augment human capital and technology in the process of production. The more resources allocated to firms, the more rapid will be economic growth.
Saint-Paul (1992) relates the relationship between the financial sector and economic growth by emphasizing the complementary role between financial markets and technology. According to Saint-Paul, if financial markets are underdeveloped, then individual will choose poorly productive, but flexible technologies. Given these technologies, producers do not experience much risk, and hence there is little incentive to develop financial markets. On the other hand, if financial markets are developed, technology will be more specialized and risky, thereby resulted a positive impact on productivity. Financial markets, therefore, contribute to growth by facilitating a greater division of labor. Thus, an economy that possesses highly developed financial markets that allow the spreading of risk through financial diversification among the economic agent will be able to achieve a higher level of development than an economy in which the financial markets are not very developed.
The purpose of the present paper is to determine whether the contribution of the financial services sector in the three regions in Malaysia, namely Peninsular Malaysia, Sabah and Sarawak show any distinct pattern. In the jargon of economic development literature, we seek to determine whether there is “convergence” or similarity in the patterns of the performance of the financial services sector among the three regions. Convergence examines the effect of initial conditions on long-run economic outcomes. If the effect of the initial condition eventually dies out, with initially economic sectors in the poor regions having higher growth rates than that experienced by the economic sectors in the richer regions, then one cannot reject the so-called “absolute convergence” hypothesis. If one fails to find evidence of absolute convergence, it is possible to test for the existence of so-called “conditional” convergence, which reflects the possibility that while initial conditions die out, each region moves to its own (long-run) steady state rather than a universal steady state. If conditional convergence were present, poor regions would grow faster than rich ones but only after controlling for other variables that influence the steady state differences.
The paper is organized as follows. In the next section we discuss the contribution of the services sector to the Malaysian economy. In section 3, we present the literature review and section 4 contains the methodology. In section 5, we discuss the empirical results and the last section contains our conclusions.
Contributions Of The Services Sector: Some Stylized Facts
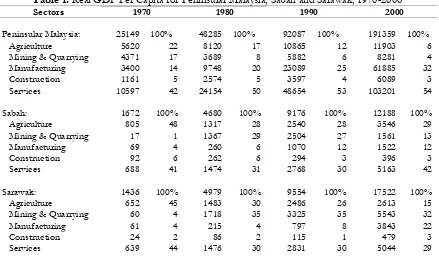
Table 1 and Table 2 show some interesting observations on the performance of the various sectors in the three regions in Malaysia for the period 1970 – 2000. In Table 1, for the forty years period, services sector contributed about 42 percent of the total real GDP in Peninsular Malaysia. This was followed by the agriculture sector, mining and quarrying manufacturing and the construction sectors. In 2000, the services sector‟s share to total realGDP has risen by 29 percent, contributing 54 percent to the economic growth of the Peninsular Malaysia. The manufacturing sector comes second with 32 percent of total real GDP, while agriculture, mining and quarrying and construction contributed less than 10 percent to the region‟s economy.
On the other hand, the agriculture sector dominates the main economic activity in the state of Sabah by contributing about 48 percent of the total share of real GDP in 1970. The services sector contribute about 41 percent of the total real GDP, while other sectors such as mining and quarrying, manufacturing and the construction sectors
contribute less than 10 percent of total real GDP. However, in the year 2000, the services sectors seem to be the engine of growth for the state of Sabah, contributing 42 percent of the total real GDP. The agriculture sector contribute about 29 percent, followed by mining and quarrying 13 percent, manufacturing 12 percent and the construction sector 3 percent of the total real GDP.
Table 1.
Real GDP Per Capita for Peninsular Malaysia, Sabah and Sarawak, 1970-2000
Sectors 1970 1980 1990 2000
Peninsular Malaysia: 25149 100% 48285 100% 92087 100% 191359 100%
Agriculture 5620 22 8120 17 10865 12 11903 6
Mining & Quarrying 4371 17 3689 8 5882 6 8281 4
Manufacturing 3400 14 9748 20 23089 25 61885 32
Construction 1161 5 2574 5 3597 4 6089 3
Services 10597 42 24154 50 48654 53 103201 54
Sabah: 1672 100% 4680 100% 9176 100% 12188 100%
Agriculture 805 48 1317 28 2540 28 3546 29
Mining & Quarrying 17 1 1367 29 2504 27 1561 13
Manufacturing 69 4 260 6 1070 12 1522 12
Construction 92 6 262 6 294 3 396 3
Services 688 41 1474 31 2768 30 5163 42
Sarawak: 1436 100% 4979 100% 9554 100% 17522 100%
Agriculture 652 45 1483 30 2486 26 2613 15
Mining & Quarrying 60 4 1718 35 3325 35 5543 32
Manufacturing 61 4 215 4 797 8 3843 22
Construction 24 2 86 2 115 1 479 3
Services 639 44 1476 30 2831 30 5044 29
Notes : Authors‟ calculation.
Sources : Various issues of Statistical Yearbook Malaysia, Statistical Yearbook Sabah and Statistical Yearbook Sarawak.
In the state of Sarawak, agriculture sector marginally leads the main economic activity in the year 1970 with 45 percent contribution to real GDP, followed by the services sector 44 percent, while manufacturing 61 percent, mining and quarrying 60 percent and the construction sector 24 percent. But in year 2000, the main economic activity has been dominated by mining and quarrying, followed by the services sector, manufacturing, agriculture, and the construction sectors.
Table 2 shows the contribution of the various services sub-sector to the total services sector‟s real GDP for the three regions. The services sub-sectors considered include electricity, finance, government, transportation, wholesale and „other services‟ sectors. Interesting to observe that in 1970, finance sector is not the main economic activity in the three regions in Malaysia. The finance sector ranked fifth in terms of its contribution to the total services sector, ranging to 4-5 percent to real GDP of the services sector. The main contributor to the services sector for the three regions is the wholesale sector. In the year 2000, the finance sector ranked second in Peninsular Malaysia, ranked third in Sabah and ranked fourth in Sarawak. Table 2 clearly suggests that the financial sector has becoming more important in the Peninsular Malaysia compared to Sabah and Sarawak.
Table 2. Real
GDP Per Capita for the Services Industry, 1970-2000
Sectors 1970 1980 1990 2000
Peninsular Malaysia: 10597 100% 24154 100% 48654 100% 103201 100%
Electricity 357 3 944 4 2248 5 7573 7
Finance 435 4 2923 12 10885 22 25312 25
Government 1705 16 4015 17 7558 16 12054 12
Other services 3460 33 4876 20 7868 16 14992 15
Transportation 1029 10 3181 13 6777 14 15211 15
Wholesale 3612 34 8214 34 13317 27 28059 27
Sabah: 688 100% 1474 100% 2768 100% 5163 100%
Electricity 22 3 76 5 183 7 302 6
Finance 34 5 98 7 307 11 822 16
Government 140 20 329 22 609 22 1139 22
Other services 167 24 267 18 360 13 554 11
Transportation 48 7 192 13 403 15 666 13
Wholesale 276 40 512 35 905 33 1680 33
Sarawak: 639 100% 1476 100% 2831 100% 5044 100%
Electricity 27 4 76 5 183 6 403 8
Finance 30 5 93 6 296 10 621 12
Government 133 21 359 24 674 24 1138 23
Other services 175 27 303 21 369 13 524 10
Transportation 48 8 191 13 513 18 981 19
Wholesale 226 35 454 31 797 28 1377 27
Notes : Authors‟ calculation.
Sources : Various issues of Statistical Yearbook Malaysia, Statistical Yearbook Sabah and Statistical Yearbook Sarawak
Literature Review
Barro (1991) and Barro and Sala-i-Martin (1991, 1992) have demonstrated the testing for convergence of whether poor regions tend to grow faster than rich ones. Employing a neoclassical growth model put forward by Solow (1956), Barro estimates the following equation
t i i T i T i
y
T
e
a
y
y
T
0 0 0,,
)
(
log
1
log
1
(1)where
y
i is income per capita of theith
region;y
i0 denotes initial income; T is time; λ is the speed of convergence,and
is a disturbance term. If
T
e
T1
< 0, then Equation (1) implies that poor regions tend to grow faster than rich ones. Transforming Equation (1) to a more general version of Barro‟s equation yield the following equation
i t i
i
y
g
log
,
(2)where the dependent variable,
g
n is the growth rate of income in region i between t andt
T
and is measured asT
y
y
i,t Tlog
i,tlog
and the independent variable,
log
y
i,t, is the natural log of income at timet
. If the sign on
is negative, and if one can reject the hypothesis that
0
, then it can be said that the data exhibit absolute beta convergence and one can conclude that the economic sector of each region is converging to the same long-run, steady state.On the other hand, the Barro equation used for conditional convergence is
i i t
i
i
y
X
g
log
,
(3)where
X
is a vector of additional explanatory variables, which are held constant to obtain an estimate of
. Conditional convergence abandons the assumption that all regions have homogeneous economic and social environments and thus the same steady state, and it implies states will grow faster the further they are from theirunique steady-state value. The additional explanatory variables simultaneously influence the transitional growth rate and are determinants of the steady-state position. Conditional convergence implies a negative correlation between growth and initial level of income, after controlling for factors impacting steady state positions. In other words, holding the newexplanatory variables constant, regions with lower income must grow at a faster rate than regions with higher income in order to achieve conditional convergence. Thus the sign of
is still the key indicator of convergence.Tests of convergence within regions in a country have been receiving increasing attention. Numerous cross country studies have found a negative relation between initial per capita income and an average growth in per capita income that is the analysis support absolute convergence. With absolute convergence, growth rates in income per capita converge to a constant and identical level across countries, states and regions. On the other hand, with conditional convergence, each country or region is converging toward its own respective steady state. Studies support convergence among countries, among other include Baumol (1986), Barro and Sala-i-Martin (1991, 1992, 1995), DeLong (1988), Dowrick and Nguyen (1989), Grier and Tullock (1989), and Mankiw et al. (1992).
However, the traditional testing for convergence has been questioned by Quah (1993), Evans (1998) and Bernard and Durlauf (1995). They suggest using time-series methods (the so-called stochastic convergence) to evaluate convergence since the cross-sectional approach is subject to bias. In a time-series approach, stochastic convergence asks whether permanent movement in another countries‟ income, that is, it examines, whether common stochastic elements matter, and how persistent the differences among countries cannot contain unit roots. In other words, income per capita among countries is stationary. Empirical studies on testing stochastic convergence, among others include Bernard (1991), Bernard and Durlauf (1995), Campbell and Mankiw (1989), Cogley (1990), Greasly and Oxley (1997), St. Aubyn (1999), Cellini and Scorcu (2000) and Carlino and Mills (1993).
Methodology and Data
Methodology
In a time-series approach, stochastic convergence asks whether permanent movements in one country‟s per capita income are associated with permanent movements in another countries‟ income, that is, it examines, whether common stochastic elements matter, and how persistent the differences among countries are. Thus, stochastic convergence implies that income differences among countries cannot contain unit roots. In other words, income per capita among countries is stationary. Empirical studies on testing stochastic convergence, among others include Bernard (1991), Bernard and Durlauf (1995), Campbell and Mankiw (1989), Cogley (1990), Greasly and Oxley (1997), St. Aubyn (1999), Cellini and Scorcu (2000) and Carlino and Mills (1993).
Following Evans and Karras (1996), stochastic convergence occurs if relative log per capita GDP, yit, follows a
stationary process, where yit logYit logyt, and Yit is the log of real per capita GDP for country i and is I(1), and
iN it
t Y
y 1 . Stochastic convergence is tested by using the conventional univariate augmented Dickey-Fuller (ADF) (1981) regression of the following form
p
j ij it j it
it i i
it y y t T
y
1
1 , 1,...,
(4)
for i1,...,N series, and j1,...,p ADF lags. The null hypothesis is that yit follows a non-stationary process and the
series do not converge stochastically. In this study, besides using the standard ADF unit root test, we endeavour to subject the test for economic convergence by using Phillips-Perron (PP) test.
Phillips-Perron (PP) test proposed by Phillips and Perron (1988) used nonparametric statistical methods to take care of the serial correlation in the error term without adding lagged difference terms. The PP test estimates the non-augmented DF test equation (i.e.
1 '
1 xt t
t y t
y
) and modifies the t-ratio of the
coefficient. So, the serial correlation will not affect the asymptotic distribution of the test statistic. The PP tests have a great power to reject a false null hypothesis of a unit root than the Dickey-Fuller tests while in the presence of structural breaks. The PP test the null hypothesis of unit root will be set asH
0:
1
, against the one-sided alternative hypothesisH
1:
1
.Sources of Data
The data in this study are annual time series data which cover the period from 1968 to 2003. In this study apart from the finance sector, we endeavour to analyze the other sub-sectors of the services industry, namely electricity, government, transportation, wholesale and „other services‟ sectors. Real gross domestic product for the Sabah and Sarawak states and their respective services sub-sectors are collected from the various issues of the Statistical Yearbook published by their respective Department of Statistics (various issues). The data for the Peninsular Malaysia was derived by subtracting total Malaysia‟a data (nominal GDP) from Sabah (nominal GDP) and Sarawak (nominal GDP). All income data used in the analysis are in real GDP per capita and are then transformed into natural logarithm for analysis.
The Empirical Results
Table 3 show the results of the test for the order of integration for the output series of the services sub-sectors for the three regions, namely Peninsular Malaysia, Sabah and Sarawak. For the series in level, the unit root test was conducted by including the intercept and trend. The lag truncation was selected using Schwarz's Bayesian Criterion (SBC). The results shown by both the ADF and PP tests clearly suggest that the null hypothesis of unit root cannot be rejected at the 5 percent significant level.
Table 3.
Results of Unit Root Tests for Output Series in Level
Sub-sectors Peninsular Malaysia Sabah Sarawak
ADF PP ADF PP ADF PP
t- lag t- lag t- lag t- lag t- lag t- lag
Finance -3.73* 9 -1.00 3 -2.33 0 -2.41 12 -2.52 1 -1.92 1 Electricity -2.49 0 -2.61 2 -2.90 1 -2.43 3 -2.44 0 -2.27 6 Government -1.82 0 -1.82 6 -1.72 0 -1.83 2 -3.04 7 -2.63 1 Transportation -2.66 9 -1.81 1 -2.54 0 -2.45 4 -3.30 0 -3.22 2 Wholesale -2.34 1 -2.24 2 -1.57 0 -1.48 6 -3.19 2 -2.04 3 Other services -1.83 0 -1.61 5 -1.34 3 -1.14 2 -0.76 0 -0.53 5 Notes: * denotes statistically significant at the 5% level. Unit root tests for levels are with intercept and trend (t-)
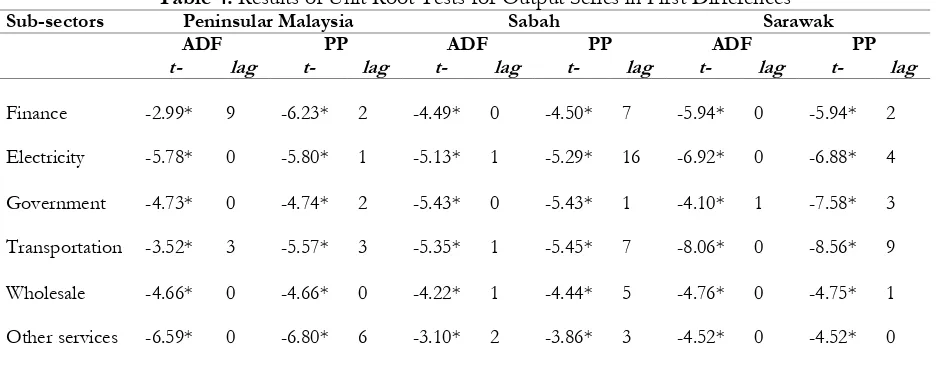
On the other hand, Table 4 show the results of the unit root tests on the first-differences of the output series. Overwhelmingly, the results indicate that all the series in first-differences are stationary and the null hypothesis of a unit root can be rejected at the 5 percent level. In other words, the results suggest that all output series of the services sub-sectors are difference stationary or I(1) series.
Table 4.
Results of Unit Root Tests for Output Series in First Differences
Sub-sectors Peninsular Malaysia Sabah Sarawak
ADF PP ADF PP ADF PP
t- lag t- lag t- lag t- lag t- lag t- lag
Finance -2.99* 9 -6.23* 2 -4.49* 0 -4.50* 7 -5.94* 0 -5.94* 2 Electricity -5.78* 0 -5.80* 1 -5.13* 1 -5.29* 16 -6.92* 0 -6.88* 4 Government -4.73* 0 -4.74* 2 -5.43* 0 -5.43* 1 -4.10* 1 -7.58* 3 Transportation -3.52* 3 -5.57* 3 -5.35* 1 -5.45* 7 -8.06* 0 -8.56* 9 Wholesale -4.66* 0 -4.66* 0 -4.22* 1 -4.44* 5 -4.76* 0 -4.75* 1 Other services -6.59* 0 -6.80* 6 -3.10* 2 -3.86* 3 -4.52* 0 -4.52* 0 Notes: * denotes statistically significant at the 5% level. Unit root tests for first-differences with intercept only (t-)
In Table 5, we have estimated Equation (4) by including the time trend as an augment in the ADF testing procedure. Thus, the stochastic convergence hypothesis is tested by employing the following augmented Dickey-Fuller (ADF) regression of the form
pj
it j it ij it
i i i
it
t
y
y
t
T
y
1
1
,
1
,...,
(5)for i1,...,N series, and j1,...,p ADF lags. In a time series framework, a distinction is made between long-run convergence and convergence as catching-up. The statistical tests are interpreted as follows. First, if
y
it contains a unit root (i.e. 1), real GDP per capita for regions i and Ni it
t Y
y 1 diverge over time. Second, if
y
it is stationary (i.e. no stochastic trend, or 1) and (a) i 0andi0(i.e the absence of a deterministic trend) indicates absoluteconvergence between regions i and N i it
t Y
y 1 (the same interpretation goes for the PP tests). In this case, poor
regions are growing faster than the rich regions given the initial condition so that the gap between two regions becomes zero; (b) i 0and0 indicates a conditional convergence whereby the gap between the two regions diminishes in the course of time and finally becomes a constant; (c) i 0and0 indicates catching-up between regions i and
iN it
t Y
y 1 .
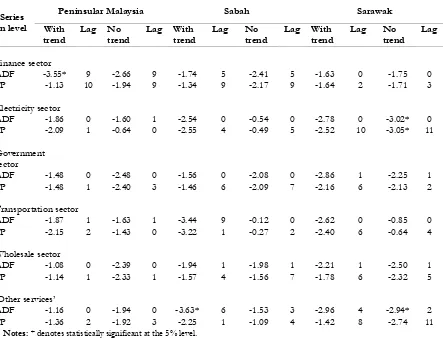
Table 5.
Result of Unit Root Test for Output Differential
Series in level
Peninsular Malaysia Sabah Sarawak With
trend
Lag No trend
Lag With trend
Lag No trend
Lag With trend
Lag No trend
Lag
Finance sector
ADF -3.55* 9 -2.66 9 -1.74 5 -2.41 5 -1.63 0 -1.75 0
PP -1.13 10 -1.94 9 -1.34 9 -2.17 9 -1.64 2 -1.71 3
Electricity sector
ADF -1.86 0 -1.60 1 -2.54 0 -0.54 0 -2.78 0 -3.02* 0 PP -2.09 1 -0.64 0 -2.55 4 -0.49 5 -2.52 10 -3.05* 11 Government
sector
ADF -1.48 0 -2.48 0 -1.56 0 -2.08 0 -2.86 1 -2.25 1
PP -1.48 1 -2.40 3 -1.46 6 -2.09 7 -2.16 6 -2.13 2
Transportation sector
ADF -1.87 1 -1.63 1 -3.44 9 -0.12 0 -2.62 0 -0.85 0
PP -2.15 2 -1.43 0 -3.22 1 -0.27 2 -2.40 6 -0.64 4
Wholesale sector
ADF -1.08 0 -2.39 0 -1.94 1 -1.98 1 -2.21 1 -2.50 1
PP -1.14 1 -2.33 1 -1.57 4 -1.56 7 -1.78 6 -2.32 5
„Other services‟
ADF -1.16 0 -1.94 0 -3.63* 6 -1.53 3 -2.96 4 -2.94* 2
PP -1.36 2 -1.92 3 -2.25 1 -1.09 4 -1.42 8 -2.74 11
Notes: * denotes statistically significant at the 5% level.
According to Oxley and Greasley (1995) catching-up differs from conditional convergence in that the latter relates to some particular period T equated with long-run steady-state equilibrium. In this case the existence of a time trend in the non-stationary yitlogYit logyt would imply a narrowing of the (per capita income) gap or simply that
the regions though catching-up had not yet converged. Conversely, the absence of a time trend in the stationary series implies that catching-up has been completed.
Results in Table 5 clearly demonstrate the strong indication that the output of the financial services sector and other sub-sectors in the services industry are not converging among the three regions in Malaysia. The hypotheses of conditional convergence and the catching-up are rejected in the majority of the analyses. From Table 5, conditional convergence is detected in the electricity sector (using both ADF and PP) and „other services‟ sector (using ADF) for the state of Sarawak. The catching-up hypothesis is detected in the financial services sector (using ADF) in the Peninsular Malaysia, as well as in the „other services‟ sector (using ADF) in the state of Sabah.
The question is: why there is divergence of services output among the three regions? There is no strong indication of catching-up among the regions in Malaysia. To this end, Skonhoft (1995) pointed that the main premise for the process of convergence is the existence of differences in the level of technology embodied in a country‟s capital stock compared to the level of technology embodied in the leading country‟s capital stock. Catching-up therefore implies that the capital stock in a country following behind becomes relatively more recent than in the leading country as time goes by. Further Lim and McAleer (2004) elaborate that technological catching-up is associated with innovation (e.g. Research and Development, R & D) and capital investment (importing advanced technology). Besides innovation and investment, the level of education (social capability) also plays a crucial role in determining the technical competence of the labour force. The literature on catching-up therefore suggests that due to diffusion and imitation, relatively backward countries should grow at a faster rate. Through diffusion and imitation it is supposed that a „follower‟ country experiencing a technological gap can increase its rate of economic growth by catching-up with the technology of the „leader‟.
Conclusion
The objective of the present study is to test empirically the question of regional economic convergence in per capita GDP of the services sub-sectors between Peninsular Malaysia, Sabah and Sarawak. Particularly, we investigate whether the growth of the services sector has been showing similar pattern among the three regions in Malaysia various studies on spill over effect have indicated that the development in the neighbouring richer regions have positive and/or negative effect on regional growth. Since Peninsular Malaysia, Sabah and Sarawak belong to Malaysia, the richer and more development Peninsular Malaysia should have a positive bearing on the progress and development of the states of Sabah and Sarawak.
Based on the stochastic convergence definition suggested by Bernard and Durlauf (1995) and using both Augmented Dickey-Fuller and Phillips-Perron tests our findings strongly indicate divergence between the three regions in Malaysia. This suggests that the importance of the services sector, particularly the financial services sector has no positive bearing on the other two regions in Malaysia. In general, the lack of convergence is still seen by many mainstream economists and policy advisers as the result of a lack of commitment on the part of national governments or the states government to move sufficiently quickly in liberalizing their economies and accelerated action plans to enhance greater growth in the regions. On the other hand, the key to catch-up lies in closing the technology gap between the poor and rich regions. Although this can be accelerated by imports of capital goods and by FDI the effectiveness of such channels depends crucially on “adsorptive capacity” and “social capabilities”, which are understood broadly to include a wide range of political and economic institutions as well as political and macroeconomic stability (Abramovitz, 1986).
References
Abramovitz, M. (1986), “Catching up, forging ahead, and falling behind”, Journal of Economic History, Vol. 46, No. 2, pp. 385-406.
Barro, R. (1991), “Economic growth in a cross section of countries”, Quarterly Journal of Economics, Vol. 106, No. 2, pp. 407-443.
Barro, R., and Sala-i-Martin, X. (1991), “Convergence across states and regions”, Brookings Papers of Economic Activity, No. 1, pp. 107-182.
Barro, R., and Sala-i-Martin, X. (1992), “Convergence”, Journal of Political Economy, Vol. 100, pp. 223-251. Barro, R., and Sala-i-Martin, X. (1995), Economic Growth. New York: McGraw-Hill.
Baumol, W.J. (1986), “Productivity growth, convergence and welfare: what the long-run data show”, American Economic Review, Vol. 76, pp. 1072-1085.
Bencivenga, V. and Smith, S. (1991), “Financial intermediate and endogenous growth”, Review of Economic Studies, Vol. 58, No. 2, pp. 195-209.
Bernard, A.B. (1991). Empirical implications of the convergence hypothesis. Working paper. Stanford University: Center for Economic Policy Research.
Bernard, A.B., and Durlauf, S.N. (1995), “Convergence in international output”, Journal of Applied Econometrics, Vol. 10, pp. 97-108.
Campbell, J.Y., and Mankiw, N.G. (1989), “International evidence on the persistence of economic fluctuations”, Journal of Monetary Economics, Vol. 23, pp. 319-333.
Carlino, G.A., and Mills, L.O. (1993), “Are U.S. regional incomes converging? A time series analysis”, Journal of Monetary Economics, Vol. 32, 335-346.
Cellini, R., and Scorcu, A. (2000), “Segmented stochastic convergence across the G-7 countries”, Empirical Economics, Vol. 25, pp. 463-474.
51
Cogley, T. (1990), “International evidence on the size of therandom walk in output”, Journal of Political Economy, Vol. 98, pp. 501-518.
DeLong, J.B. (1988), “Productivity growth, convergence and welfare: Comment”, American Economic Review, Vol. 78, pp. 1138-1154.
Department of Statistics Malaysia. Statistical Yearbook, various issues. Department of Statistics Malaysia. Sabah Statistical Yearbook, various issues. Department of Statistics Malaysia. Sarawak Statistical Yearbook, various issues.
Dowrick, S., and Nguyen, D.T. (1989), “OECD comparative economic growth 1950-1985: Catch-up and convergence”,
American Economic Review, Vol. 79, pp. 1010-1030.
Dickey, D.A. and Fuller, W.A. (1981), “Likelihood ratio statistics for autoregressive time series with a unit root”,
Econometrica,Vol. 49, pp. 1057-1077.
Evans, P. (1998), “Using panel data to evaluate growth theories”, International Economic Review, Vol. 39, pp. 295-306. Evans, P., and Karras, G. (1996), “Convergence revisited”, Journal of Monetary Economics, Vol. 37, pp. 249-265.
Greasley, D., and Oxley, S. (1997), “Time-series based tests of the convergence hypothesis: Some positive results”,
Economics Letters, Vol. 56, pp. 143-147.
Greenwood, J. and Jovanovic, B. (1990), “Financial development, growth and the distribution of income”, Journal of Political Economy, Vol. 98, pp. 1067-1107.
Grier, K.B., and Tullock, G. (1989), “An empirical analysis of cross-national economic growth: 1951-1980”, Journal of Monetary Economics, Vol. 24, pp. 259-276.
Government of Malaysia. (1966), Second Malaysia Plan 1966-1970, Kuala Lumpur: Government Printers. Government of Malaysia. (2006), Five Malaysia Plan 2006-2010, Kuala Lumpur: Government Printers. Levine, R. (1991), “Stock markets, growth and tax policy”, Journal of Finance, Vol. 46, pp. 1445-1465. Lewis, W.A. (1955), Theory of Economic Growth, London: Unwin University Books.
Lim, L.L., and McAleer, M. (2004), “Convergence and catching up in ASEAN: A comparative analysis”, Applied Economics, Vol. 36, pp. 137-153.
Mankiw, G., Romer, P., and Weil, D.N. (1992), “A contribution to the empirics of economic growth”, Quarterly Journal of Economics, Vol. 107, pp. 407-437
Nurkse, R. (1962), Problems of Capital Formation in Underdeveloped Countries, London: Blackwell.
Pagano, M. (1993), “Financial market and growth: an overview”, European Economic Review, Vol. 37, pp. 613-622.
Phillips, P.C.B. and Perron, P. (1988), “Testing for a unit root in time series regression”, Biometrika, Vol. 75, No. 2, pp. 335-346.
Quah, D. (1993), “Galton‟s Fallacy and the tests of the convergence hypothesis”, Scandinavian Journal of Economics, Vol. 95, pp. 427-443.
Saint-Paul, G. (1992), “Technological choice, financial markets and economic development”, European Economic Review,
Vol. 36, pp. 763-781.
Schumpeter, J.A. (1934), The Theory of Economic Development, Oxford: Oxford University Press.
Skonhoft, A. (1995), “Catching up and falling behind: A vintage model approach”, Journal of Evolutionary Economics, Vol. 5, pp. 285-295.
Solow, Robert M. (1956), “A Contribution to the theory of economic growth”, Quarterly Journal of Economics, Vol. 70, No. 1, 65–94.
Swan, Trevor W. (1956), “Economic Growth and Capital Accumulation”, Economic Record, Vol. 32, No. 2, pp. 334–361. St. Aubyn, M. (1999), “Convergence across industrialised countries (1890-1989): New results using time series methods”,
Empirical Economics, Vol. 24, pp. 23-44.
World Bank. (1989), World Development Report 1989, Washington, D.C.: The World Bank.
52