____________________________
Corresponding author: Babic Vojka, Maize Research Institute „Zemun Polje“, Slobodana Bajica 1, 11185 Zemun-Belgrade, Serbia; Tel: (011)3756704, Fax: 3756707, e-mail: vbabic@mrizp.rs
UDC 575:633.15 DOI:10.2298/GENSR1002313B Original scientific paper
VISUAL ASSESSMENT OF SWEET MAIZE LINES PHENOTYPE, ACCORDING TO UPOV DESCRIPTOR, AS INDICATOR OF HETEROSIS
Vojka BABIĆ1, Zorica PAJIĆ1, Slaven PRODANOVIĆ2,
Milosav BABIĆ1 and Milomir FILIPOVIĆ1
1
Maize Research Institute, Zemun Polje, Belgrade 2
Faculty of Agriculture, University of Belgrade, Belgrade
Babić V., Z. Pajić, S. Prodanović, M.Babić and M. Filipović
(2010): Visual assessment of sweet maize lines phenotype, according to UPOV descriptor, as indicator of heterosis- Genetika, Vol 42, No. 2, 313 - 322.
The organisation of germplasm into genetically divergent groups is of extreme importance for the development of hybrid varieties in which the identification and exploitation of heterosis is very important for the final result of breeding. It can also be beneficial for breeding of self-pollination varieties, clones and synthetics. The discovery of heterotic groups in standard grain quality maize significantly improved the process of testing. The improvement in sweet maize was relatively modest in comparison to standard grain quality maize due to a relatively narrow genetic base of
sweet maize, then poorly defined heterotic relations, scarce sources of germplasm that satisfy commercial standards, poor seed vigour, low quality of root and stalk, as well as, a short period of time for the estimation of yield and quality.
The efficiency of hybrid breeding programmes would be significantly higher if heterosis could be predicted prior to the evaluation in the field. The application of the multivariate analysis method to data of phenotypic characterisation according to the UPOV Descriptor was an attempt to establish whether such a procedure can be beneficial for the determination of related groups and whether the phenotypic distance, obtained on the basis of a visual estimation of a plant group, can be an indicator of heterosis. Obtained results indicate that clustering is highly analogous to the pedigree. Since sweet maize breeders have at their disposal less significant genetic variability and search for the development and defining of heterotic groups, as such a procedure can be useful in both, the process of the hybrids development and the process of new inbreed development and genetic variability increasing. Certainly, further systematic studies aimed at this direction are necessary to reliably ascertain that the phenotypic distance is a justifiable indicator of heterosis.
Key words: heterosis, phenotypic distance, sweet maize INTRODUCTION
The three different hypotheses proposed to explain the phenomenon of heterosis are dominance, overdominance and epistasis (MOLL and STUBER, 1974) but none of them is entirely successful. It is undeniable that heterosis exists and that it can be used for the development of superior hybrids, but it also can be beneficial for breeding of clones and open-pollinated varieties and synthetics. The efficiency of hybrid breeding programmes could significantly improve if superior crosses be predicted prior to the field evaluation. However, field trials still have an irreplaceable role in the hybrid breeding programmes. Several methods, tried with variable success, employed to predict heterosis can be grouped into: per se performances; mitochondrial complementation; combining ability and genetic diversity of parents as determined either through pedigree or geographic origin, multivariate analysis using morphological and agronomic traits, as well as, molecular markers (VIRMANI, 1994). BARATA and CARENA (2006) classified North Dakota maize inbred lines into heterotic groups and concluded that there is still a great incongruity between data obtained on the basis of molecular markers and data of field trials. Distances computed from isozyme data were in some cases significantly correlated to heterosis but such distances were limited primarily to inbreed with similar pedigrees (FREI et al., 1986). The value of the RFLP results in the heterosis prediction was found to be in a promising extent when inbreeds of the same heterotic groups were crossed, while the prediction, done for unrelated inbreeds belonging to the genetically distant heterotic groups, was practically zero, and medium for mixtures of bout
(MELCHINGERet al., 1992). In the majority of cases, the correlation between RAPD-based genetic distances and hybrid performances were also small. A significant improvement in the correlation between genetic distances and heterosis was noted in maize by the application of AFLP markers in comparison with RFLP markers (AJMONE MARSANet al., 1998).
Generally, there are many potential reasons for weak correlations between genetic distances and hybrid performances. It is absolutely essential to identify specific marker loci with tight linkage to those chromosomal segments which determine the expression of the traits of interest (BERNARDO, 1992). Furthermore, some of designated chromosomal regions can be more important than others in defining performances of F1 hybrid yields (STUBERet al., 1992). Different levels of dominance among hybrids and inadequate genome coverage are other reasons suggested for the low correlations obtained between hybrid performance and marker diversity (MELCHINGERet al., 1990).
The discovery of heterotic groups in standard grain quality maize reduced the number of test crosses (JENKINS, 1978). The genetic base of sweet maize is relatively narrow and very often related inbreeds are crossed with the purpose of develop hybrids in order to achieve high criteria related to quality and ear appearance dictated by the market (TRACY, 1994). Not only the genetic base at the disposal of sweet maize breeders is narrow, but heterotic groups are also poorly defined (GOODMAN, 1985). The greatest number of sweet maize inbreeds originates from the following three open-pollinated varieties: Golden Bantam, Stowell’s Evergreen and Country Gentleman. Heterotic and phylogenetic relations between these three varieties and others are not clearly defined. All this is a reason of a modest improvement in breeding for sweet maize yield in comparison to standard grain quality maize. Observing the possibility to improve sweet maize breeding by the development of heterotic groups TRACY (1990) concluded that the most real starting point should be the classification of the existing sweet maize germplasm based on phylogenesis.
Morphological traits are traditionally used in the description and this trend will surely continue although many authors consider these traits unreliable as they have been created by abundant measures of a great number of plants, they have been also under great influence of the environment and under an unknown mechanism of genetic control (SMITH and SMITH, 1989).
Several assumptions were the starting point of this study. The UPOV Descriptor presents the procedure and the conduct of tests for distinctness, uniformity and stability (DUS) of new varieties of plants for the purpose of granting breeders' rights at the international level. Beside defined morphological traits that are observed during the growing season and during certain developmental stages of the plant, example varieties are also defined for the degree of expression of certain traits. The possibility to compare the expression of an observed trait during the growing season and in the same developmental stage of the plant increases quality of obtained estimates (UPOV, 2004). The degradation of a measurement scale from the scalar to the ordinary level of measurement (level of the trait expression instead of exact
magnitude in cm for instance), reduces the significance of environmental effects on observed quantitative traits and provides a more reliable comparison of the phenotypic description over different locations or years. As maize inbreeds are homozygous to a great extent, a visual estimation of a group of plants should be sufficiently reliable.
MATERIALS AND METHODS
The 14 sweet maize inbreeds, that are parental components of 10 following hybrids, were selected for the study: 424su (L3xL2); 111su (L1xL4); ZP-231su (L5xL1); ZP-311su (L6xL1); ZP-401 (L9xL1); ZP-504su (L9xL8); ZP-521su (L10xL2); ZP-461su (L11xL12); ZP-355su (L13xL12); ZP-441su (L14xL2). A phenotypic description is done according to the UPOV descriptor in two replicates during two years. Out of 56 traits that were estimated in sweet maize, a certain number of traits were rejected due to uniform estimation of observed inbreeds, hence they would not contribute to the discrimination. The following traits were analysed: intensity of anthocyanin colouration of the first leafsheath, shape of tip of the first leaf, position of the top leaf, angle between blade and steam and attitude of blade, degree of zig-zag of stem, intensity of anthocyanin colouration of brace roots, anthocyanin intensity in the base of tassel glumes, anthocyanin intensity of tassel glumes without the base, anthocyanin intensity of fresh anthers, tassel glumes density, angle, attitude and the number of lateral tassel branches, anthocyanin intensity of silk, anthocyanin intensity of leaf sheath in the middle part of the plant, the length of the main tassel branch above the highest and the lowest lateral tassel branch, plant height, the total plant height to ear height ratio, ear leaf width, number of tillers, length of peduncle, husk cover, ratio netto/bruto of ear weight, ear length and diameter, ear form and curvature, kernel row number and row straightness, filled ear tips, diameter of cob, kernel colour, kernel brightness and depth, kernel size, thickness of pericarp, sugar content. Ward's hierarchical clustering method was performed, while the squared Euclidean distance was applied as a measure of the distance. The phenotypic distances were used for the correspondence analysis, which shows interrelations within the observed material in the form of continuous variability.
RESULTS
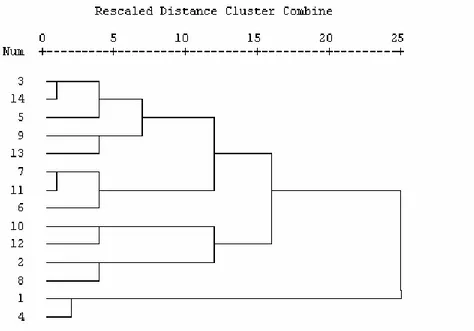
The phenotypic characterisation according to the UPOV Descriptor was used in the cluster analysis to determine whether homogenous groups are formed by relatedness and to what extent, and whether gained results were in accordance with the pedigree of observed sweet maize inbreeds. Ultimately, the inbreeds were classified into to clusters (A and B). The cluster A was further branched into to two subclusters (a1 and a2). The subcluster a1 encompassed inbreeds L3 and L14, derived from the F2 population of the North American hybrid RBN 9024, the inbred L5 introduced from Mexico, the inbred L9 derived from crosses of sweet maize germplasm (Talqueno - Mexican variety) and the germplasm that did not belong to a
sweet maize type (R588 - local inbred of the Ruma dent), the inbred L13, derived by the pedigree selection from the cross of the inbred L9 and the inbred originating from the F2 population of the hybrid Ivory’n gold, the inbred L7, derived from crosses of sweet maize germplasm (Talqueno - Mexican variety) and the germplasm that did not belong to a sweet maize type (K8 - dent inbred of the Iranian variety), the inbred L11, developed from the F2 population of the hybrid Dallas and the inbred L6, developed from the sweet maize inbred introduced from Argentina. The subcluster a2 included inbreds derived from sweet maize varieties introduced from Mexico (L2 and L8), then inbred L10, derived from the F2 population of the hybrid Lincoln, and the inbred L12, developed from the same material as the inbred L7. The second cluster (B) encompassed the inbreds L1 and L4, developed by the pedigree selection from the local sweet maize varieties. If it is presumed that there is a division into three clusters (a1, a2 and B) then parental components of eight hybrids are within different clusters, while parental components of only two hybrids (L1xL4 and L10xL2) are within the same clusters. Therefore, the results of the cluster analysis can be beneficial for the selection of genotypes for further crosses (Fig. 1).
Figure 1. Dendrogram of the cluster analysis of phenotypic distances of sweet maize inbreds
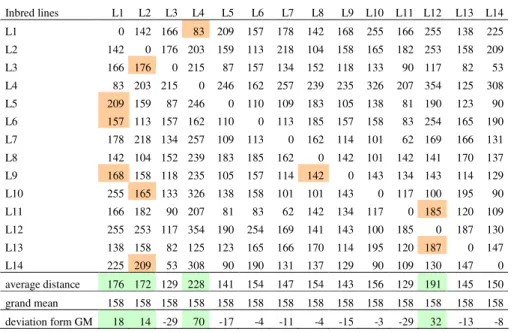
The phenotypic distances of observed sweet maize inbred lines ranged from 53 (L3 and L14) to 354 (L4 and L12). The average phenotypic distances ranged from 129 to 228. The grand mean was 158. The deviation of phenotypic distances from the
grand mean ranged from -29 to 70. The greatest deviations of 70, 32, 18 and14 were detected in the inbreds L4, L12, L1 and L2, respectively. Based on this, it can be assumed that these inbreds are good testers, which has been, to a great deal, confirmed in the practice (Tab. 1).
The phenotypic distance of parental inbreds of sweet maize hybrids developed from this material ranged from 83 (hybrid ZP-111su (L1xL4)) to 209 (hybirds ZP-231su and ZP-441su (L5xL1 and L14xL2)). The phenotypic distance of parental inbreds of the following hybrids was below the grand mean: 111su, ZP-311su and ZP-504su. These hybrids were developed at the end of the 1980s and the beginning of 1990s. Their yields were relatively modest. Beside the hybrid ZP-504su, with a high sugar content and a fine ear architecture, none of hybrids remained in the market for any significant time. At the same time, the hybrid ZP-231su, with the phenotypic distance of parental components of 209 had a solid yield, high quality of ears and kernels and was present in the market for a longer period of time. The phenotypic distance of parental inbreds of the following hybrids was above the grand mean: 424su, 231su, 521su, 461su, 355su, ZP-441su and ZP-401su. Beside the already mentioned hybrid ZP-231su, these hybrids were developed in the 2001-2008 period and they overyielded hybrids derived in the previous period (Tab. 1).
Table 1. Sweet maize inbreds phenotypic distance matrix
Inbred lines L1 L2 L3 L4 L5 L6 L7 L8 L9 L10 L11 L12 L13 L14 L1 0 142 166 83 209 157 178 142 168 255 166 255 138 225 L2 142 0 176 203 159 113 218 104 158 165 182 253 158 209 L3 166 176 0 215 87 157 134 152 118 133 90 117 82 53 L4 83 203 215 0 246 162 257 239 235 326 207 354 125 308 L5 209 159 87 246 0 110 109 183 105 138 81 190 123 90 L6 157 113 157 162 110 0 113 185 157 158 83 254 165 190 L7 178 218 134 257 109 113 0 162 114 101 62 169 166 131 L8 142 104 152 239 183 185 162 0 142 101 142 141 170 137 L9 168 158 118 235 105 157 114 142 0 143 134 143 114 129 L10 255 165 133 326 138 158 101 101 143 0 117 100 195 90 L11 166 182 90 207 81 83 62 142 134 117 0 185 120 109 L12 255 253 117 354 190 254 169 141 143 100 185 0 187 130 L13 138 158 82 125 123 165 166 170 114 195 120 187 0 147 L14 225 209 53 308 90 190 131 137 129 90 109 130 147 0 average distance 176 172 129 228 141 154 147 154 143 156 129 191 145 150 grand mean 158 158 158 158 158 158 158 158 158 158 158 158 158 158 deviation form GM 18 14 -29 70 -17 -4 -11 -4 -15 -3 -29 32 -13 -8
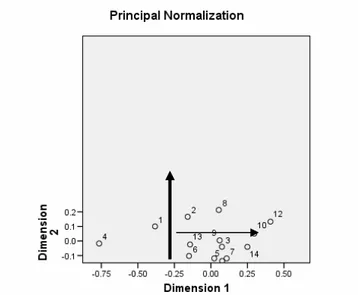
The presentation of results in the form of discrete groups-clusters is one of disadvantages of the cluster analysis as there is no insight into interrelations among inbreds within and among clusters, although there is continuous variability among them. The correspondence analysis of phenotypic similarities provides a global presentation of interrelations of the observed material in the form of continuous variability (Fig. 2).
The first two dimensions encompass 67% and 12% of inertia ("variance"), respectively, which makes a total of 79%. The first dimension of the correspondence analysis clearly separates inbreds L1 and L4, originating from the local sweet maize varieties, from remaining inbreds, originating from the material introduced from Mexico or developed from the F2 population of the US hybrids. The second dimension divides inbreds into subgroups. The inbred L10 is placed in the space between the subclusters a1 and a2 and it is phenotypically closer to some inbreds within the subcluster a1. The inbreds L4 and L12, and partially inbreds L1, L2 and L8, have the most prominent position in the Figure (they are the most distant from remaining inbreds), hence it can be assumed that they are good testers.
Figure 2. Figure of the correspondence analysis of phenotypic similarities of sweet maize inbreds
CONCLUSION
Carrying out field trials with sweet maize hybrids is more complex and expensive in relation to trials with standard grain quality hybrids (PAJIĆ et al., 2010). Bearing in
mind a narrow genetic base, weakly defined heterotic groups, as well as, poor seed vigour, weak root system and inferior stalk traits, it is obvious how complex and laborious sweet maize breeding is (PAJIĆet al., 2005). On the other hand, if we
compare it with the achievements in standard grain quality maize breeding there is still a lot to be done. The use of the heterosis phenomenon, due to well defined heterotic groups, significantly improved breeding and increased efficiency of standard grain quality maize inbred testing. As sweet maize breeders have been searching for the development and defining of heterotic groups, such a procedure could be useful. The information obtained through the phenotypic characterisation according to the UPOV Descriptor that is performed for needs of applying varieties to be released and for their listing into National or Common European Catalogue of Varieties of Agricultural Plant Species, it can be used in the process of maize hybrid breeding. If multivariate analysis methods are applied to phenotypic traits according to the UPOV descriptor for the standard grain quality maize inbreds there is a clear indication that related maize inbred lines can be, with a significant preciseness, grouped on the same clusters (BABIĆet al., 2008). PRODANOVIĆet al. (2007) and DRAŽIĆet al. (2001) in their studies concluded that the cluster analysis was proved to
be a useful method for planning hybridization. Parents should be selected from different clusters or subclusters in order to recombine genotypes as divergent as possible.
Naturally, systematic studies aimed at this direction are necessary in order to claim reliably that the phenotypic distance, obtained on the basis of the phenotypic characterisation according to the UPOV Descriptor, is a justifiable indicator of heterosis.
Received October 29th, 2009 Accepted April 18th, 2010
REFERENCES
AJMONE-MARSAN, P., P. CASTIGLIONI, F. FUSARI, M. KUIPER and M. MOTTO (1998): Genetic diversity and its relationship to hybrid performance in maize as revealed by RFLP and AFLP markers. Theor. Appl. Genet. 96:219-227.
BABIĆ, V., M.BABIC, M. FILIPOVIC, N. DELIC and V. ANDJELKOVIC (2008): Phenotypic characterisation and relatedness of maize inbred lines. Genetika 40 (3): 227-236.
BARATA, C. and M.J. CARENA,(2006): Classification of North Dakota maize inbred lines into heterotic groups based on molecular and testcross data. Euphytica 151: 339-349.
BERNARDO, R. (1992): Relationship between single cross performance and molecular marker heterozygosity. Theor. Appl. Genet. 83: 628-634.
DRAŽIĆ, S., S. PRODANOVIĆ (2001): Phenotypic divergence of burley tobacco varieties. Genetika 33 (1-2): 19-27.
FREI, O.M., C.W. STUBERand M.M. GOODMAN(1986): Use of allozymes as genetic markers fo predicting performance in maize single cross hybrids. Crop Sci 26:37-42.
GOODMAN, M.M. (1985): Exotic maize germplasm: Status, prospects, and remedies. Iowa State J. Res. 59: 497-527.
JENKINS, M.T. (1978): Maize breeding during the development and early years of hybrid maize, pp 13-28. In D.B. Walden (ed.). Maize breeding and genetics. Wiley, New York.
MELCHINGER A.E., M.LEE, K.R.LAMKEY and W.L. WOODMAN (1990): Genetic diversity for restriction fragment length polymorphisms: Relation to estimated genetic effects in maize inbreds. Crop. Sci. 30: 1033-1040.
MELCHINGER A.E., J. BOPPENMAIER, B.S. DHILLON and W.G. POLLMER (1992): Genetic diversity for RFLPs in European maize inbreds. II. Relation to performance of versus between heterotic groups for forage traits. Tteor. Appl. Genet. 84: 672-681
MOLL, R.H. and C.W. STUBER (1974): Quantitative genetics-empirical results relevant breeding. In: Brady NC (ed) Advances in Agronomy. Academic Press, San Francisco 313.
PAJIĆ, Z., J. VANČETOVIĆ and M. RADOSAVLJEVIĆ (2005): Maize hybrid with specific properties for industrial processing. Čas. proces. teh. energ. poljopr. 9 (1-2): 18-21.
PAJIĆ, Z., M. RADOSAVLJEVIĆ, M. FILIPOVIĆ, G. TODOROVIĆ, J. SRDIĆ, M. PAVLOV (2010): Breeding of speciality maize for industrial purposes. Genetika 42, (1): 57-66.
PRODANOVIĆ, S., D. MANOJLOVIĆ, D. MILOŠEVIĆ, T. ŽIVANOVIĆ (2007): The application of the cluster analysis for estimating selection values of F1 potato seedlings. Journal of Scientific Agricultural Research 68 (1): 39-46
SMITH, J.S.C. and O.S. SMITH (1989): The description and assessment of distances between inbred lines of maize: I the use of morphological traits as descriptors. Maydica 34: 141-150.
STUBER, C.W., S.E. LINCOLN, D.W. WOLFF, T. HELENTJARIS and E.S. LANDR (1992): Identification of genetic factors contributing to heterosis in a hybrid from two elite maize inbred lines using molecular markers. Genetics 132:823-839.
TRACY, W.F. (1994): Sweet corn, pp 147-187. In: A.R. Hallauer (ed.). Specialty types of maize. CRC Pres, Boca Raton, Fla.
TRACY, W.F. (1990): Potential of field corn germplasm for the improvement of sweet corn. Crop. Sci. 30: 1041-1045.
UPOV (2004): Outlier detection and data validation. UPOV/DATA/BEI/04/5
VIRMANI, S.S.(1994): Heterosis and Hybrid Rice Breeding. Monographs on Theoretical Genetics 22, Springer-Verlag, pp 1-38.
VIZUELNA OCENA FENOTIPA LINIJA KUKURUZA ŠEĆERCA, PO UPOV DESKRIPTORU, KAO POKAZATELJ HETEROZISA
Vojka BABIĆ1, Zorica PAJIĆ1, Slaven PRODANOVIĆ2,
Milosav BABIĆ1 i Milomir FILIPOVIĆ1
1
Institut za kukuruz „Zemun Polje“, Beograd 2Poljoprivredni fakultet, Beograd
I z v o d
Organizacija germ-plazme u genetički divergentne grupe je od izuzetne
važnosti prilikom stvaranja hibridnih sorti, gde je identifikacija i iskorišćavanje
fenomena heterozisa veoma važno za krajnji ishod oplemenjivanja. Ali takodje može biti od pomoći u oplemenjivanju slobodno oprašujućoh sorti, klonova i sintetika.
Otkriće heterotičnih grupa kod standardnog kukuruza je znatno unapredilo proces
testiranja. Kod kukuruza šećerca, elativno uska genetička osnova, malobrojni izvori
germ-plazme koji zadovoljavaju komercijalne standarde, slaba životna sposobnost semena, loš kvalite korena i stabla kao i kratak period za ocenu prinosa i kvaliteta su razlozi relativno skromnog unapredjenja prinosa u poredjenju sa standardnim kukuruzom.
Efikasnost hibridnih oplemenjivačkih programa bi se znatno moga povećati
ako bi bilo moguće predvideti heterizis pre evaluacije u polju. Primenjujući
multivarijacione metode statistike na podatke fenotipske karakterizacije po UPOV deskriptoru pokušano je da se istraži da li ovakva procedura može biti od pomoći
prilikom odredjivanja grupa po srodnosti i da li fenotipska distanca, dobijena na osnovu vizuelne ocene grupe biljaka, može biti indikator heterozisa. Dobijeni rezultati ukazuju da postoji grupisanje koje je u visokoj saglasnosti sa pedigreom. Kako oplemenjivači kukuruza šećerca imaju na raspolaganju manju genetičku
varijabilnost i u potrazi su za razvojem i definisanjem heterotičnih grupa, ovakva
procedura može biti od koristi kako u procesu stvaranja hibrida tako i u procesu stvaranje novih linija i povećanja genetičke varijabilnosti. Svakako da su sistematska
istraživanja u ovom pravcu potrebna da bi se moglo sa pouzdanošću tvrditi da je
fenotipska distanca pouzdan indikator heterizisa.
Primljeno 29. X 2009.