For your convenience Apress has placed some of the front
matter material after the index. Please use the Bookmarks
Contents at a Glance
Foreword by Jonathan Lewis ...
xix
Foreword by Cary Millsap ...
xxi
Foreword from the First Edition ...
xxiii
About the Author ...
xxv
About the Technical Reviewers ...
xxvii
Acknowledgments ...
xxix
Acknowledgments from the First Edition ...
xxxi
Introduction ...
xxxiii
Part I: Foundations
■
...
1
Chapter 1: Performance Problems
■
...
3
Chapter 2: Key Concepts
■
...
19
Part II: Identification
■
...
49
Chapter 3: Analysis of Reproducible Problems
■
...
51
Chapter 4: Real-Time Analysis of Irreproducible Problems
■
...
103
Chapter 5: Postmortem Analysis of Irreproducible Problems
■
...
151
Part III: Query Optimizer
■
...
167
Chapter 6: Introducing the Query Optimizer
■
...
169
Chapter 7: System Statistics
■
...
191
vi
Chapter 9: Configuring the Query Optimizer
■
...
273
Chapter 10: Execution Plans
■
...
299
Part IV: Optimization
■
...
357
Chapter 11: SQL Optimization Techniques
■
...
359
Chapter 12: Parsing
■
...
419
Chapter 13: Optimizing Data Access
■
...
449
Chapter 14: Optimizing Joins
■
...
529
Chapter 15: Beyond Data Access and Join Optimization
■
...
575
Chapter 16: Optimizing the Physical Design
■
...
655
Part V: Appendix
■
...
679
Bibliography
■
...
681
About IOUG Press
IOUG Press
is a joint effort by the
Independent Oracle Users Group (the IOUG)
and
Apress
to deliver some of the highest-quality content possible on Oracle Database and
related topics. The IOUG is the world's leading, independent organization for
professional users of Oracle products. Apress is a leading, independent technical
publisher known for developing high-quality, no-fluff content for serious technology
professionals. The IOUG and Apress have joined forces in IOUG Press to provide the
best content and publishing opportunities to working professionals who use Oracle
products.
Our shared goals include:
Developing content with excellence
Helping working professionals to succeed
Providing authoring and reviewing opportunities
Networking and raising the profiles of authors and readers
To learn more about Apress, visit our website at www.apress.com. Follow the link for
IOUG Press to see the great content that is now available on a wide range of topics
that matter to those in Oracle's technology sphere.
Visit www.ioug.org to learn more about the Independent Oracle Users Group and its
mission. Consider joining if you haven't already. Review the many benefits at
www.ioug.org/join
. Become a member. Get involved with peers. Boost your career.
xxxiii
Introduction
Oracle Database has become a huge piece of software. This not only means that a single human can no longer be proficient in using all the features provided in recent versions, it also means that some features will rarely be used. Actually, in most situations, it’s enough to know and take advantage of a limited number of core features in order to use Oracle Database efficiently and successfully. This is precisely why this book covers only the features that, based on my experience, are necessary to troubleshoot most of the database-related performance problems you will encounter.
The Structure of This Book
This book is divided into four parts:
Part 1 covers some basics that are required to read the rest of the book. Chapter 1, “Performance Problems,” explains not only why it’s essential to approach performance problems at the right moment and in a methodological way, but also why understanding business needs and problems is essential. It also describes the most common database-related design problems that lead to suboptimal performance. Chapter 2, “Key Concepts,” describes the operations carried out by the database engine when parsing and executing SQL statements and how to instrument application code and database calls. It also introduces some important terms that are frequently used in the book.
Part 2 explains how to approach performance problems in an environment that uses Oracle Database. Chapter 3, “Analysis of Reproducible Problems,” describes how to identify performance problems with the help of SQL trace and PL/SQL profilers. Chapter 4, “Real-time Analysis of Irreproducible Problems,” describes how to take advantage of information provided by dynamic performance views. Several tools and techniques that can be used with them are also introduced. Chapter 5, “Postmortem Analysis of Irreproducible Problems,” describes how to analyze performance problems that happened in the past with the help of Automatic Workload Repository and Statspack.
Part 4 shows which features are provided by Oracle Database to execute SQL statements efficiently. Chapter 11, “SQL Optimization Techniques,” describes the techniques provided by Oracle Database to influence the execution plans that are generated by the query optimizer. Chapter 12, “Parsing,” describes how to identify, solve, and work around performance problems caused by parsing. Chapter 13, “Optimizing Data Access,” describes the methods available to access data and how to choose between them. Chapter 14, “Optimizing Joins,” discusses how to join several sets of data together efficiently.
Chapter 15, “Beyond Data Access and Join Optimization,” describes advanced optimization techniques such as parallel processing, materialized views, and result caching. And Chapter 16, “Optimizing the Physical Design,” explains why it’s important to optimize the physical design of a database.
Intended Audience
This book is intended for performance analysts, application developers, and database administrators who are involved in troubleshooting performance problems in applications using Oracle Database.
No specific knowledge in optimization is required. However, readers are expected to have a working knowledge of Oracle Database and to be proficient with SQL. Some sections of the book cover features that are specific to programming languages such as PL/SQL, Java, C#, PHP, and C. These features are covered only to provide a wide range of application developers with specific information about the programming language they’re using. You can pick out the ones you’re using or interested in and skip the others.
Which Versions Are Covered?
The most important concepts covered in this book are independent of the version of Oracle Database you’re using. It’s inevitable, however, that when details about the implementation are discussed, some information is version-specific. This book explicitly discusses the versions currently available from Oracle Database 10g Release 2 to Oracle Database 12c Release 1. They are as follows:
Oracle Database 10g Release 2, up to and including version 10.2.0.5.0
•
Oracle Database 11g Release 1, up to and including version 11.1.0.7.0
•
Oracle Database 11g Release 2, up to and including version 11.2.0.4.0
•
Oracle Database 12c Release 1, version 12.1.0.1.0
•
Be aware that the granularity is the patch set level, and therefore, changes introduced by security and bundle patches aren’t discussed. If the text doesn’t explicitly mention that a feature is available for a specific version only, it’s available for all those versions.
Online Resources
xxxv
Differences between the First and the Second Editions
The main goals set for the revision of the book were the following:
Add content about Oracle Database 11g Release 2 and Oracle Database 12c Release 1.
•
Remove content about Oracle9i and Oracle Database 10g Release 1.
•
Add content that was missing in the first edition (for example, features like hierarchical
•
profiler, active session history, AWR, and Statspack).
Add information about PHP in the parts that cover features that are specific to programming
•
languages.
Reorganize part of the material for better readability. For example, splitting the chapter about
•
system and object statistics in two. Fix errata and generally enhance the text.
Foundations
Chi non fa e’ fondamenti prima, gli potrebbe con una grande virtú farli poi, ancora che si
faccino con disagio dello architettore e periculo dello edifizio.
He who has not first laid his foundations may be able with great ability to lay them
afterwards, but they will be laid with trouble to the architect and danger to the building.
1—Niccoló Machiavelli,
Il principe
. 1532.
3
Performance Problems
Too often, optimization begins when an application’s development is already finished. This is unfortunate because it implies that performance is not as important as other crucial requirements of the application. Performance is not merely optional, though; it is a key property of an application. Not only does poor performance jeopardize the acceptance of an application, it usually leads to a lower return on investment because of lower productivity of those using it. In fact, as shown in several IBM studies from the early 1980s, there is a close relationship between performance and user productivity. The studies showed a one-to-one decrease in user think time and error rates as system transaction rates increased. This was attributed to a user’s loss of attention because of longer wait times. In addition, poorly performing applications lead to higher costs for software, hardware, and maintenance. For these reasons, this chapter discusses why it is important to plan performance, which are the most common design mistakes that lead to sub-optimal performance, and how to know when an application is experiencing performance problems. Then, the chapter covers how to approach performance problems when they occur.
Do You Need to Plan Performance?
In software engineering, different models are used to manage development projects. Whether the model used is a sequential life cycle like a waterfall model or an iterative life cycle like the one used with agile methodologies, an application goes through a number of common phases (see Figure 1-1). These phases may occur once (in the waterfall model) or several times (in the iterative model) in development projects.
Requirements Analysis
Analysis and Design
Coding and Unit Testing
Integration and Acceptance
Testing
Figure 1-1. Essential phases in application development
Requirements Analysis
Simply put, a requirements analysis defines the aim of an application and therefore what it is expected to achieve. To do a requirements analysis, it is quite common to interview several stakeholders. This is necessary because it is unlikely that only one person can define all the business and technical requirements. Because requirements come from several sources, they must be carefully analyzed, especially to find out whether they potentially conflict. It is crucial when performing a requirements analysis to not only focus on the functionalities the application has to provide but also to carefully define their utilization. For each specific function, it is essential to know how many users1
are expected to interact with it, how often they are expected to use it, and what the expected response time is for one usage. In other words, you must define the expected performance figures.
RESPONSE TIME
The time interval between the moment a request enters a system or functional unit and the moment it leaves
is called response time. The response time can be further broken down into the time needed by the system to
process the request, which is called service time, and the time the request is waiting to be processed, which is
called wait time (or queueing delay in queueing theory).
response time = service time + wait time
If you consider that a request enters a system when a user performs an action, such as clicking a button, and
goes out of the system when the user receives an answer in response to the action, you can call that interval
user response time. In other words, the user response time is the time required to process a request from the
user’s perspective.
In some situations, like for web applications, considering user response time is uncommon because it is usually
not possible to track the requests before they hit the first component of the application (typically a web server).
In addition, most of the time guaranteeing a user response time is not possible because the provider of the
application is not responsible for the network between the user’s application, typically a browser, and the first
component of the application. In such situations, it is more sensible to measure and guarantee the interval
between the entry of requests into the first component of the system and when they exit. This elapsed time is
called system response time.
Table 1-1 shows an example of the expected performance figures for the actions provided by JPetStore.2 For each
action, the guaranteed system response times for 90% and 99.99% of the requests entering the system are given. Most of the time, guaranteeing performance for all requests (in other words, 100%) is either not possible or too expensive. It is quite common, therefore, to define that a small number of requests may not achieve the requested response time. Because the workload on the system changes during the day, two values are specified for the maximum arrival rate. In this specific case, the highest transaction rate is expected during the day, but in other situations—for example, when batch jobs are scheduled for nights—it could be different.
1Notethatauserisnotalwaysahumanbeing.Forexample,ifyouaredefiningrequirementsforawebservice,itislikelythatonly otherapplicationswilluseit.
5
These performance requirements are not only essential throughout the next phases of application development (as you will see in the following sections), but later you can also use them as the basis for defining service level agreements and for capacity-planning purposes.
Table 1-1. Performance Figures for Typical Actions Provided by a Web Shop
Action
Max. Response Time (s)
Max. Arrival Rate (trx/min)
90%
99.99%
0-7
8-23
Register/change profile 2 5 1 2
Sign in/sign out 0.5 1 5 20
Search products 1 2 60 240
Display product overview 1 2 30 120
Display product details 1.5 3 10 36
Add/update/remove product in/from cart 1 2 4 12
Show cart 1 3 8 32
Submit/confirm order 1 2 2 8
Show orders 2 5 4 16
SERVICE LEVEL AGREEMENTS
A service level agreement (SLA) is a contract defining a clear relationship between a service provider and a
service consumer. It describes, among others things, the provided service, its level of availability regarding uptime
and downtime, the response time, the level of customer support, and what happens if the provider is not able to
fulfill the agreement.
Defining service level agreements with regard to response time makes sense only if it is possible to verify their
fulfillment. They require the definition of clear and measurable performance figures and their associated targets.
These performance figures are commonly called key performance indicators (KPI). Ideally a monitoring tool is
used to gather, store, and evaluate them. In fact, the idea is not only to flag when a target is not fulfilled but
also to keep a log for reporting and capacity-planning purposes. To gather these performance figures, you can
use two main techniques. The first takes advantage of the output of instrumentation code (see Chapter 2 for
more information). The second one is to use a response-time monitoring tool (see the section “Response-Time
Monitoring” later in this chapter).
Analysis and Design
Sometimes requirements also impact the architecture by imposing limits on the utilization of a specific resource. For example, the architecture of an application to be used by mobile devices connected to the server through a slow network must absolutely be conceived to support a long latency and a low throughput. As a general rule, the architects have to foresee not only where the bottlenecks of a solution might be, but also whether these bottlenecks might jeopardize the fulfillment of the requirements. If the architects do not possess enough information to perform such a critical estimation a priori, one or even several prototypes should be developed. In this respect, without the performance figures gathered in the previous phase, making sensible decisions is difficult. By sensible decisions, I mean those leading to an architecture/design that supports the expected workload with a minimal investment— simple solutions for simple problems, elegant solutions for complex problems.
Coding and Unit Testing
A professional developer should write code that has the following characteristics:
Robustness: The ability to cope with unexpected situations is a characteristic any software should have. To achieve the expected quality, performing unit testing on a regular basis is essential. This is even more important if you choose an iterative life cycle. In fact, the ability to quickly refactor existing code is essential in such models. For example, when a routine is called with a parameter value that is not part of a specific domain, it must nevertheless be able to handle it without crashing. If necessary, a meaningful error message should be generated as well.
Maintainability: Long-term, well-structured, readable, and documented code is much simpler (and cheaper) to maintain than code that is poorly written and not documented. For example, a developer who packs several operations in a single line of cryptic code has chosen the wrong way to demonstrate his intelligence.
Speed: Code should be optimized to run as fast as possible, especially if a high workload is expected. It should be scalable, and therefore able to leverage additional hardware resources to support an increasing number of users or transactions. For example,
unnecessary operations, serialization points, as well as inefficient or unsuitable algorithms, should be avoided. It is essential, however, to not fall into the premature optimization trap.
Shrewd resource utilization: The code should make the best possible use of the available resources. Note that this does not always mean using the fewest resources. For example, an application using parallelization requires many more resources than one where all operations are serialized, but in some situations parallelization may be the only way to handle demanding workloads.
Security: The ability to ensure data confidentiality and integrity, as well as user authentication and authorization, is undisputed. Sometimes non-repudiation is also an issue. For example, digital signatures might be required to prevent end-users from successfully challenging the validity of a communication or contract.
7
Not only do some of these characteristics conflict with each other, but budgets are usually limited (and sometimes are very limited). It seems reasonable then that more often than not it is necessary to prioritize these characteristics and find a good balance of achieving the desired requirements within the available budget.
PREMATURE OPTIMIZATION
Premature optimization, (probably) because of Donald Knuth’s famous line “premature optimization is the root
of all evil,” is, at the very least, a controversial topic. The misconception based on that particular quote is that a
programmer, while writing code, should ignore optimization altogether. In my opinion this is wrong. To put the
quote in context, let’s have a look at the text that precedes and follows it:
“There is no doubt that the grail of efficiency leads to abuse. Programmers waste enormous amounts of time
thinking about, or worrying about, the speed of noncritical parts of their programs, and these attempts at
efficiency actually have a strong negative impact when debugging and maintenance are considered. We should
forget about small efficiencies, say about 97% of the time: premature optimization is the root of all evil. Yet we
should not pass up our opportunities in that critical 3%. A good programmer will not be lulled into complacency by
such reasoning, he will be wise to look carefully at the critical code; but only after that code has been identified. It
is often a mistake to make a priori judgments about what parts of a program are really critical, since the universal
experience of programmers who have been using measurement tools has been that their intuitive guesses fail.”
My take on Knuth’s paper is that programmers, when writing code, should not care about micro optimization that
has local impact only. Instead, they should care about optimizations that have global impact, like the design of a
system, the algorithms used to implement the required functionality, or in which layer (SQL, PL/SQL, application
language) and with which features a specific processing should be performed. Local optimizations are deferred till
a measurement tool points out that a specific part of the code is spending too much time executing. And because
the optimization is local, there is no impact on the overall design of the system.
Integration and Acceptance Testing
The purpose of integration and acceptance testing is to verify functional and performance requirements as well as the stability of an application. It can never be stressed enough that performance tests have the same importance as function tests. For all intents and purposes, an application experiencing poor performance is no worse than an application failing to fulfill its functional requirements. In both situations, the application is useless. Still, it is possible to verify the performance requirements only once they have been clearly defined.
The lack of formal performance requirements leads to two major problems. First, the chances are quite high that no serious and methodical stress tests will be performed during integration and acceptance testing. The application will then go to production without knowing whether it will support the expected workload. Second, it will not always be obvious to determine what is acceptable and what is not in terms of performance. Usually only the extreme cases (in other words, when the performance is very good or very poor) are judged in the same way by different people. And if an agreement is not found, long, bothersome, and unproductive meetings and interpersonal conflicts follow.
In practice, designing, implementing, and performing good integration and acceptance testing to validate the performance of an application are not trivial tasks. You have to deal with three major challenges to be successful:
Stress tests should be designed to generate a representative workload. To do so, two main
•
To generate a representative workload, representative test data is needed. Not only should
•
the number of rows and the size of the rows match the expected quantity, but also the data distribution and the content should match real data. For example, if an attribute should contain the name of a city, it is much better to use real city names than to use character strings like Aaaacccc or Abcdefghij. This is important because in both the application and the database there are certainly many situations where different data could lead to different behavior (for example, with indexes or when a hash function is applied to data).
The test infrastructure should be as close as possible to, and ideally the same as, the
•
production infrastructure. This is especially difficult for both highly distributed systems and systems that cooperate with a large number of other systems.
In a sequential life cycle model, the integration and acceptance testing phase occurs close to the end of the project, which might be a problem if a major flaw in the architecture leading to performance problems is detected too late. To avoid such a problem, stress tests should be performed during the coding and unit testing phases as well. Note that an iterative life cycle model does not have this problem. In fact, by the very definition of “iterative life cycle model,” a stress test should be performed for every iteration.
Designing for Performance
Given that applications should be designed for performance, it would be useful to cover an approach to doing that in great detail. However, the focus of this book is on troubleshooting. For this reason, I limit myself to briefly describing the top ten most common database-related design problems that frequently lead to suboptimal performance.
Lack of Logical Database Design
Once upon a time, it was considered obvious that one should have a data architect involved in every development project. Often this person was not only responsible for the data and the database design, but was also part of the team in charge of the whole architecture and design of the application. Such a person often had extensive experience with databases. He knew exactly how to design them to guarantee data integrity as well as performance.
Today, unfortunately, it is not always so. Too often I see projects in which no formal database design is done. The application developers do the client and/or middle-tier design. Then, suddenly, the database design is generated by a tool such as a persistence framework. In such projects, the database is seen as a dumb device that stores data. Such a viewpoint of the database is a mistake.
Implementing Generic Tables
Every CIO dreams of applications that are easily able to cope with new or changed requirements. The keyword is
flexibility. Such dreams sometimes materialize in the form of applications that use generic database designs. Adding new data is just a matter of changing the configuration without changing the database objects themselves.
Two main database designs are used to achieve such flexibility:
Entity-attribute-value (EAV) models: As their name implies, to describe every piece of information, at least three columns are used: entity, attribute, and value. Each combination defines the value of a specific attribute associated to a specific entity.
9
The problem with such designs is that they are (to say the least) suboptimal from a performance point of view. In fact, flexibility is tied to performance. When one is at its maximum, the other is at its minimum. In some situations suboptimal performance might be good enough. But in other situations it might be catastrophic. Hence, you should use a flexible design only when the required performance can be achieved with it.
Not Using Constraints to Enforce Data Integrity
Constraints (primary keys, unique keys, foreign keys, NOT NULL constraints, and check constraints) are not only fundamental to guarantee data integrity, but they are also extensively used by the query optimizer during the generation of execution plans. Without constraints, the query optimizer is not able to take advantage of a number of optimizations techniques. In addition, checking the constraints at the application level leads to more code being written and tested as well as to potential problems with data integrity, because data can always be manually modified at the database level. Also, checking constraints at application level usually requires greater consumption of resources, and leads to less scalable locking schemes (such as locking an entire table instead of letting the database lock only a subset of rows). Therefore, I strongly advise application developers to define all known constraints at the database level.
Lack of Physical Database Design
It is not uncommon to see projects where the logical design is directly mapped to the physical design without taking advantage of all the features provided by Oracle Database. The most common and obvious example is that every relation is directly mapped to a heap table. From a performance point of view, such an approach is suboptimal. In more than a few situations, index-organized tables (IOT), indexed clusters, or hash clusters might lead to better performance.
Oracle Database provides much more than just the usual b-tree and bitmap indexes. Depending on the situation, compressed indexes, reverse-key indexes, function-based indexes, linguistic indexes, or text indexes might be very valuable to improving performance.
For large databases, the implementation of the partitioning option is critical. Most DBAs recognize the option and its usefulness. A common problem in this area is that developers think that partitioning tables has no impact on the physical database design. Sometimes this is true, but sometimes this is not the case. As a result I strongly recommend planning the use of partitioning from the beginning of a project.
Another common issue to deal with during the development of a new application is the definition, and implementation, of a sound data-archiving concept. Postponing it is usually not an option, because it might impact the physical database design (if not the logical database design).
Not Choosing the Right Data Type
In recent years, I have witnessed a disturbing trend in physical database design. This trend may be called wrong datatype selection (such as storing dates in VARCHAR2 instead of using DATE or TIMESTAMP). At first glance, choosing the datatype seems to be a very straightforward decision to make. Nevertheless, do not underestimate the number of systems that are now running and suffering because wrong datatypes were selected.
There are four main problems related to wrong datatype selection:
Loss of information: During the conversion of the original (correct) datatype to the (wrong) database datatype, information gets lost. For example, let’s imagine what happens when the date and time of an event is stored with a DATE datatype instead of with a
TIMESTAMP WITH TIME ZONE datatype. Fractional seconds and time zone information get lost.
Things do not work as expected: Operations and features for which the order of data is important might result in unexpected results, because of the specific comparison semantics associated to every datatype. Typical examples are issues related to range partitioned tables and ORDER BY clauses.
Query optimizer anomalies: The query optimizer might generate wrong estimates and, consequently, might choose suboptimal execution plans because of wrong datatype selection. This is not the fault of the query optimizer. The problem is that the query optimizer cannot do its job because information is hidden from it.
In summary, there are plenty of good reasons for selecting datatypes correctly. Doing so will likely help you to avoid many problems.
Not Using Bind Variables Correctly
From a performance point of view, bind variables introduce both an advantage and a disadvantage. The advantage of bind variables is that they allow the sharing of cursors in the library cache, and in doing so they avoid hard parses and the associated overhead. The disadvantage of using bind variables in WHERE clauses, and only in WHERE clauses, is that crucial information is sometimes hidden from the query optimizer. For the query optimizer, to generate an optimal execution plan for every SQL statement, having literals instead of bind variables is in fact much better. Chapter 2 discusses this topic in detail.
From a security point of view, bind variables prevent the risks associated with SQL injection. In fact, it is not possible to change the syntax of a SQL statement by passing a value through a bind variable.
Not Using Advanced Database Features
Oracle Database is a high-end database engine that provides many advanced features that can drastically reduce development costs, not to mention debugging and bug-fixing costs, while boosting performance. Leverage your investment by taking advantage of those features as much as possible. Especially avoid rewriting already available features (for example, do not create your own queuing system, because one is provided for you). That said, special care should be taken the first time a specific feature is used, especially if that feature was introduced in the very same database version you are running. You should not only carefully test such a feature to know whether it fulfills the requirements, but also verify its stability.
The most common argument against advanced database features is that applications using them are closely coupled to your current database brand and cannot be easily ported to another. This is true. However, most companies will rarely change the database engine under a specific application anyway. Companies are more likely to change the whole application before changing just the engine.
11
Not Using PL/SQL for Data-Centric Processing
A special case, from the point raised in the previous section, is the use of PL/SQL for implementing batches that process lots of data. The most common example is an extract-transform-load (ETL) process. When, in such a process, the extract and load phases are executed against the very same database, from a performance point of view it is almost insane to not process the transform phase by taking advantage of the SQL and PL/SQL engines provided by the database engine that manages the source and target data. Unfortunately, the architecture of several mainstream ETL tools leads exactly to such insane behavior. In other words, data is extracted from the database (and frequently also moved to another server), the transform phase is executed, and then the resulting data is loaded back into the very same database from which it came. For this reason, vendors like Oracle started offering tools that perform transformations inside the database. Such tools, to differentiate them from the ETL tools, are commonly called ELT. For best performance, I advise performing data-centric processing as closely as possible to the data.
Performing Unnecessary Commits
Commits are operations that call for serialization (the reason is simple: there is a single process (LGWR) that is responsible for writing data to redolog files). It goes without saying that every operation that leads to serialization inhibits scalability. And as a result, serialization is unwanted and should be minimized as much as possible. One approach is to put several unrelated transactions together. The typical example is a batch job that loads many rows. Instead of committing after every insert, it is much better to commit the inserted data in batches.
Steadily Opening and Closing Database Connections
Opening a database connection that in turn starts an associated dedicated process on the database server, is not a lightweight operation. Do not underestimate the amount of time and resources required. A worst-case scenario that I sometimes observe is a web application that opens and closes a database connection for every request that involves a database access. Such an approach is highly suboptimal. Using a pool of connections in such a situation is of paramount importance. By using a connection pool, you avoid the constant starting and stopping of dedicated services processes, thus avoiding all the overhead involved.
Do You Have Performance Problems?
There is probably a good chance that sooner or later the performance of an application will be questioned. If, as described in the previous sections, you have carefully defined the performance requirements, it should be quite simple to determine whether the application in question is in fact experiencing performance problems. If you have not carefully defined them, the response will largely depend on who answers the question.
Interestingly enough, in practice the most common scenarios leading to questions regarding the performance of an application fall into very few categories. They are short-listed here:
Users are unsatisfied with the current performance of the application.
•
A system-monitoring tool alerts you that a component of the infrastructure is experiencing
•
timeouts or an unusual load.
A response-time monitoring tool informs you that a service level agreement is not being
•
fulfilled.
System Monitoring
System-monitoring tools perform health checks based on general system statistics. Their purpose is to recognize irregular load patterns that pop up as well as failures. Even though these tools can monitor the whole infrastructure at once, it is important to emphasize that they monitor only individual components (for example, hosts, application servers, databases, or storage subsystems) without considering the interplay between them. As a result, it is difficult, and for complex infrastructures virtually impossible, to determine the impact on the system response time when a single component of the infrastructure supporting it experiences an anomaly. An example of this is the high usage of a particular resource. In other words, an alert coming from a system-monitoring tool is just a warning that something could be wrong with the application or the infrastructure, but the users may not experience any performance problems at all (called a false positive). In contrast, there may be situations where users are experiencing performance problems, but the system-monitoring tool does not recognize them (called a false negative). The most common and simplest cases of false positive and false negative are seen while monitoring the CPU load of SMP systems with a lot of CPUs. Let’s say you have a system with four quad-core CPUs. Whenever you see a utilization of about 75%, you may think that it is too high; the system is CPU-bounded. However, this load could be very healthy if the number of running tasks is much greater than the number of cores. This is a false positive. Conversely, whenever you see a utilization of about 8% of the CPU, you may think that everything is fine. But if the system is running a single task that is not parallelized, it is possible that the bottleneck for this task is the CPU. In fact, 1/16th of 100% is only 6.25%, and therefore, a single task cannot burn more than 6.25% of the available CPU. This is a false negative.
Response-Time Monitoring
Response-time monitoring tools (also known as application-monitoring tools) perform health checks based on either synthetic transactions that are processed by robots, or on real transactions that are processed by end-users. The tools measure the time taken by an application to process key transactions, and if the time exceeds an expected threshold value, they raise an alert. In other words, they exploit the infrastructure as users do, and they complain about poor performance as users do. Because they probe the application from a user perspective, they are able to not only check single components but, more importantly, check the whole application’s infrastructure as well. For this reason, they are devoted to monitoring service level agreements.
Compulsive Tuning Disorder
Once upon a time, most database administrators suffered from a disease called compulsive tuning disorder.3 The signs
of this illness were the excessive checking of many performance-related statistics, most of them ratio-based, and the inability to focus on what was really important. They simply thought that by applying some “simple” rules, it was possible to tune their databases. History teaches us that results were not always as good as expected. Why was this the case? Well, all the rules used to check whether a given ratio (or value) was acceptable were defined independently of the user experience. In other words, false negatives or positives were the rule and not the exception. Even worse, an enormous amount of time was spent on these tasks.
For example, from time to time a database administrator will ask me a question like “On one of our databases I noticed that we have a large amount of waits on latch X. What can I do to reduce or, even better, get rid of such waits?” My typical answer is “Do your users complain because they are waiting on this specific latch? Of course not. So, do not worry about it. Instead, ask them what problems they are facing with the application. Then, by analyzing those problems, you will find out whether the waits on latch X are related to them or not.” I elaborate on this in the next section.
Even though I have never worked as a database administrator, I must admit I suffered from compulsive tuning disorder as well. Today, I have, like most other people, gotten over this disease. Unfortunately, as with any bad illness, it takes a very long time to completely vanish. Some people are simply not aware of being infected. Others are aware, but after many years of addiction, it is always difficult to recognize such a big mistake and break the habit.
3ThiswonderfultermwasfirstcoinedbyGayaKrishnaVaidyanatha.YoucanfindadiscussionaboutitinthebookOracleInsights:
13
How Do You Approach Performance Problems?
Simply put, the aim of an application is to provide a benefit to the business using it. Consequently, the reason for optimizing the performance of an application is to maximize that benefit. This does not mean maximizing the performance, but rather finding the best balance between costs and performance. In fact, the effort involved in an optimization task should always be compensated by the benefit you can expect from it. This means that from a business perspective, performance optimization may not always make sense.
Business Perspective vs. System Perspective
You optimize the performance of an application to provide a benefit to a business, so when approaching performance problems, you have to understand the business problems and requirements before diving into the details of the application. Figure 1-2 illustrates the typical difference between a person with a business perspective (that is, a user) and a person with a system perspective (that is, an engineer).
Figure 1-2. Different observers may have completely different perspectives4
It is important to recognize that there is a cause-effect relationship between these two perspectives. Although the effects must be recognized from the business perspective, the causes must be identified from the system perspective. So if you do not want to troubleshoot nonexistent or irrelevant problems (compulsive tuning disorder), it is essential to understand what the problems are from a business perspective—even if subtler work is required.
Cataloging the Problems
The first steps to take when dealing with performance problems are to identify them from a business perspective and to set a priority and a target for each of them, as illustrated in Figure 1-3.
Identify the Problems from a Business
Perspective
Set a Priority for Each Problem
Set a Target for Each Problem
Figure 1-3. Tasks to carry out while cataloging performance problems
Business problems cannot be found by looking at system statistics. They have to be identified from a business perspective. If a monitoring of service level agreements is in place, the performance problems are obviously identified by looking at the operations not fulfilling expectations. Otherwise, there is no other possibility but to speak with the users or those who are responsible for the application. Such discussions can lead to a list of operations, such as registering a new user, running a report, or loading a bunch of data that is considered slow.
Caution
■
It is not always necessary to identify problems from a business perspective. Sometimes they are already
known. For example, the identification is required when somebody tells you something like “The end-users are constantly
complaining about the performance; find out what the causes are.” But additional identification is not needed when your
customer tells you that “Running the report XY takes way too long.” In the latter case, you already know what part of the
application you have to look at. In the former, you have no clue; any part of the application might be involved.
Once you have identified the problematic operations, it is time to give them a priority. For that, ask questions like “If we can work on only five problems, which should be handled?” Of course, the idea is to solve them all, but sometimes the time or budget is limited. In addition, it is not possible to leave out cases where the measures needed to fix different problems conflict with each other. It is important to stress that to set priorities, the current performance could be irrelevant. For example, if you are dealing with a set of reports, it is not always the slowest one that has the highest priority. Possibly the fastest one is also the one that is executed more frequently, or the one the business (or simply the CEO) cares about most. It might therefore have the highest priority and should be optimized first. Once more, business requirements are driving you.
For each problem, you should set a quantifiable target for the optimization, such as “When the Create User button is clicked, the processing lasts at most two seconds.” If the performance requirements or even service level agreements are available, it is possible that the targets are already known. Otherwise, once again, you must consider the business requirements to determine the targets. Note that without targets you do not know when it is time to stop investigating for a better solution. In other words, the optimization could be endless. Remember, the effort should always be balanced by the benefit.
Working the Problems
15
For each problem, the three questions shown in Figure 1-4 must be answered:
Where is time spent? First, you have to identify where time goes. For example, if a specific operation takes ten seconds, you have to find out which module or component most of these ten seconds are used up in.
How is time spent? Once you know where the time goes, you have to find out how that time is spent. For example, you may find out that the component spends 4.2 seconds on CPU, 0.4 seconds doing disk I/O operations, and 5.1 seconds waiting for dequeuing a message coming from another component.
How can time spent be reduced? Finally, it is time to find out how the operation can be made faster. To do so, it is essential to focus on the most time-consuming part of the processing. For example, if disk I/O operations take 4% of the overall processing time, it makes no sense to start optimizing them, even if they are very slow.
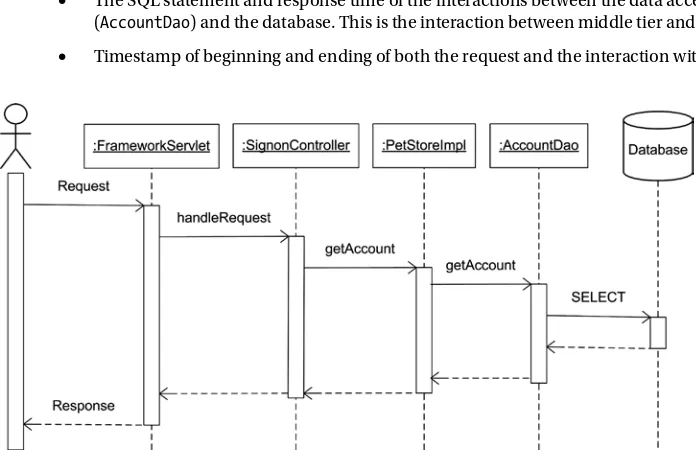
To find out where and how the time is spent, the analysis should start by collecting end-to-end performance data about the execution of the operation you are concerned with. This is essential because multitier architectures are currently the de facto standard in software development for applications needing a database like Oracle. In the simplest cases, at least two tiers (a.k.a. client/server) are implemented. Most of the time, there are three: presentation, logic, and data. Figure 1-5 shows a typical infrastructure used to deploy a web application. Frequently, for security or workload-management purposes, components are spread over multiple machines as well.
Where Is Time Spent? How Is Time Spent? How Can Time Spent Be Reduced?
Figure 1-4. To troubleshoot a performance problem, you need to answer these three questions
Client Reverse Proxy
Web Server
Application Server
Database
Server Storage
Figure 1-5. A typical web application consists of several components deployed on multiple systems
To be processed with a multitier infrastructure, requests may go through several components. However, not in all situations are all components involved in the processing of a specific request. For example, if caching at the web server level has been activated, a request may be served from the web server without being forwarded to the application server. Of course, the same also applies to an application server or a database server.
Ideally, to fully analyze a performance problem, you should collect detailed information about all components involved in the processing. In some situations, especially when many components are involved, it may be necessary to collect huge amounts of data, which may require significant amounts of time for analysis. For this reason, a divide-and-conquer approach is usually the only efficient5 way to approach a problem. The idea is to start the
analysis by breaking up the end-to-end response time into its major components (see Figure 1-6 for an example) and then to gather detailed information only when it makes sense. In other words, you should collect the minimum amount of data necessary to identify the performance problem.
Once you know which components are involved and how much time is spent by each of them, you can further analyze the problem by selectively gathering additional information only for the most time-consuming components. For example, according to Figure 1-6, you should worry only about the application server and the database server. Fully analyzing components that are responsible for only a very small portion of the response time is pointless.
Depending on what tools or techniques you use to gather performance data, in many situations you will not be able to fully break up the response time for every component as shown in Figure 1-6. In addition, this is usually not necessary. In fact, even a partial analysis, as shown in Figure 1-7, is useful in order to identify which components may, or may not, be mainly responsible for the response time.
Figure 1-6. The response time of a request broken up into all major components. Communication delays between components are omitted
Figure 1-7. The response time of a request partially broken up by components
To gather performance data about problems, basically only the following two methods are available:
17
Profiling analysis: A profiler is a performance-analysis tool that, for a running application, records the executed operations, the time it takes to perform them, and the utilization of system resources (for example, CPU and memory). Some profilers gather data at the call level, others at the line level. The performance data is gathered either by sampling the application state at specified intervals or by automatically instrumenting the code or the executable. Although the overhead associated with the former is much smaller, the data gathered with the latter is much more accurate.
Generally speaking, both methods are needed to investigate performance problems. However, if good instrumentation is available, profiling analysis is less frequently used. Table 1-2 summarizes the pros and cons of these two techniques.
Table 1-2. Pros and Cons of Instrumentation and Profiling Analysis
Technique
Pros
Cons
Instrumentation Possible to add timing information to key business operations. When available, can be dynamically activated without deploying new code. Context information (for example, about the user or the session) can be made available.
Must be manually implemented. Covers single components only; no end-to-end view of response time. Usually, the format of the output depends on the developer who wrote the instrumentation code.
Profiling analysis Always-available coverage of the whole
application. Multitier profilers provide end-to-end view of the response time.
May be expensive, especially for multitier profilers. Cannot always be (quickly) deployed in production. Overhead
associated with profilers working at the line level may be very high.
It goes without saying that you can take advantage of instrumentation only when it is available. Unfortunately, in some situations and all too often in practice, profiling analysis is often the only option available.
When you take steps to solve a particular problem, it is important to note that thanks to beneficial side effects, other problems might sometimes also be fixed (for example, reducing CPU use might benefit other CPU-intensive operations, and make them perform acceptably). Of course, the opposite can happen as well. Measures taken may introduce new problems. It is essential therefore to carefully consider all the possible side effects that a specific fix may have. Also, the inherent risks of introducing a fix should be cautiously evaluated. Clearly, all changes have to be carefully tested before implementing them in production.
Note that problems are not necessarly solved in production according to their priority. Some measures might take much longer to be implemented. For example, the change for a high-priority problem could require downtime or an application modification. As a result, although some measures might be implemented straight away, others might take weeks if not months or longer to be implemented.
On to Chapter 2
This chapter describes key issues of dealing with performance problems: why it is essential to approach performance problems at the right moment and in a methodological way, why understanding business needs and problems is absolutely important, and why it is necessary to agree on what good performance means.
Key Concepts
The aim of this chapter is threefold. First, to avoid unnecessary confusion, I introduce some terms that are used repeatedly throughout this book. The most important include selectivity and cardinality, cursor, soft and hard parses,
bind variable peeking , and adaptive cursor sharing. Second, I describe the life cycle of SQL statements. In other words, I describe the operations carried out in order to execute SQL statements. During this discussion, special attention is given to parsing. And third, I describe how to instrument application code and database calls.
Selectivity and Cardinality
The selectivity is a value between 0 and 1 representing the fraction of rows filtered by an operation. For example, if an access operation reads 120 rows from a table and, after applying a filter, returns 18 of them, the selectivity is 0.15 (18/120). The selectivity can also be expressed as a percentage, so 0.15 can also be expressed as 15 percent. When the selectivity is close to 0, it’s said to be strong. When it’s close to 1, it’s said to be weak.
Caution
■
I used to use the terms low/high or good/bad instead of strong/weak. I stopped using low/high because they
don’t make it clear whether they refer to the degree of selectivity or to its numerical value. In fact, various and conflicting
definitions exist. I stopped using good/bad because it isn’t sensible to associate a positive or negative quality to selectivity.
The number of rows returned by an operation is the cardinality. Formula 2-1 shows the relationship between selectivity and cardinality. In this formula, the num_rows value is the number of input rows.
Formula 2-1.Relationship between selectivity and cardinality
Caution
■
In the relational model, the term cardinality refers to the number of tuples in a relation. Because a relation
never contains duplicates, when the relation is unary, the number of tuples corresponds to the number of distinct values
it represents. Probably for this reason, in some publications, the term cardinality refers to the number of distinct values
stored in a particular column. Because SQL allows tables containing duplicates (that is, SQL doesn’t adhere to the
relational model in this regard), I never use the term cardinality to refer to the number of distinct values in a column.
In addition, Oracle itself isn’t consistent in the definition of the term. Sometimes, in the documentation, Oracle uses it for
the number of distinct values, and sometimes for the number of rows returned by an operation.
20
Let’s take a look at a couple of examples based on the selectivity.sql script. In the following query, the selectivity of the operation accessing the table is 1. That’s because no WHERE clause is applied, and therefore, the query returns all rows stored in the table. The cardinality, which is equal to the number of rows stored in the table, is 10,000:
SQL> SELECT * FROM t; ...
10000 rows selected.
In the following query, the cardinality of the operation accessing the table is 2,601, and therefore the selectivity is 0.2601 (2,601 rows returned out of 10,000):
SQL> SELECT * FROM t WHERE n1 BETWEEN 6000 AND 7000; ...
2601 rows selected.
In the following query, the cardinality of the operation accessing the table is 0, and therefore the selectivity is also 0 (0 rows returned out of 10,000):
SQL> SELECT * FROM t WHERE n1 = 19; no rows selected.
In the previous three examples, the selectivity related to the operation accessing the table is computed by dividing the cardinality of the query by the number of rows stored in the table. This is possible because the three queries don’t contain joins or operations leading to aggregations. As soon as a query contains a GROUP BY clause or aggregate functions in the SELECT clause, the execution plan contains at least one aggregate operation. The following query illustrates this (note the presence of the sum aggregate function):
SQL> SELECT sum(n2) FROM t WHERE n1 BETWEEN 6000 AND 7000; SUM(N2)
70846 1 row selected.
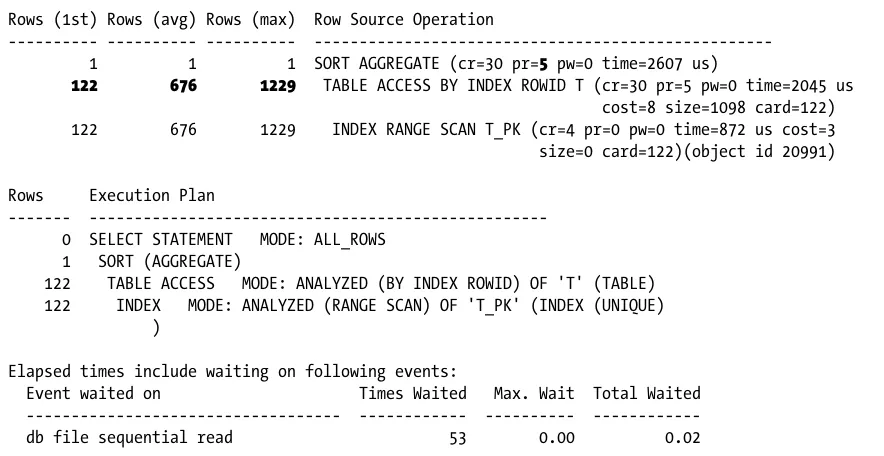
In this type of situation, it’s not possible to compute the selectivity of the access operation based on the cardinality of the query (in this case, 1). Instead, a query like the following should be executed to find out how many rows are returned by the access operation and passed as input to the aggregate operation. Here, the cardinality of the access operation accessing the table is 2,601, and therefore the selectivity is 0.2601 (2,601/10,000):
SQL> SELECT count(*) FROM t WHERE n1 BETWEEN 6000 AND 7000; COUNT(*)
2601 1 row selected.
What Is a Cursor?
A cursor is a handle (that is, a memory structure that enables a program to access a resource) that references a private SQL area with an associated shared SQL area. As shown in Figure 2-1, although the handle is a client-side memory structure, it references a memory structure allocated by a server process that, in turn, references a memory structure stored in the SGA, and more precisely in the library cache.
Figure 2-1. A cursor is a handle to a private SQL area with an associated shared SQL area
A private SQL area stores data such as bind variable values and query execution state information. As its name suggests, a private SQL area belongs to a specific session. The session memory used to store private SQL areas is called user global area (UGA).
A shared SQL area consists of two separate structures: the so-called parent cursor and childcursor. The key information stored in a parent cursor is the text of the SQL statement associated with the cursor. Simply put, the SQL statement specifies the processing to be performed. The key elements stored in a child cursor are the execution environment and the execution plan. These elements specify how the processing is carried out. A shared SQL area can be used by several sessions, and therefore it’s stored in the library cache.
Note
■
In practice, the terms cursor and private/shared SQL area are used interchangeably.
Life Cycle of a Cursor
Having a good understanding of the life cycle of cursors is required knowledge for optimizing applications that execute SQL statements. The following are the steps carried out during the processing of a cursor:
1. Open cursor: A private SQL area is allocated in the UGA of the session used to open the cursor. A client-side handle referencing the private SQL area is also allocated. Note that no SQL statement is associated with the cursor yet.
2. Parse cursor: A shared SQL area containing the parsed representation of the SQL statement associated to it and its execution plan (which describes how the SQL engine will execute the SQL statement) is generated and loaded in the SGA, specifically into the library cache. The private SQL area is updated to store a reference to the shared SQL area. (The next section describes parsing in more detail.)
3. Define output variables: If the SQL statement returns data, the variables receiving it must be defined. This is necessary not only for queries but also for DELETE, INSERT, and UPDATE
statements that use the RETURNING clause.
22
Figure 2-2. Life cycle of a cursor
6. Fetch cursor: If the SQL statement returns data, this step retrieves it. Especially for queries, this step is where most of the processing is performed. In the case of queries, the result set might be partially fetched. In other words, the cursor might be closed before fetching all the rows.
7. Close cursor: The resources associated with the handle and the private SQL area are freed and consequently made available for other cursors. The shared SQL area in the library cache isn’t removed. It remains there in the hope of being reused in the future.
To better understand this process, it’s best to think about each step being executed separately in the order shown by Figure 2-2. In practice, though, different optimization techniques are applied to speed up processing. For example, bind variable peeking requires that the generation of the execution plan is delayed until the value of the bind variables is known.
Depending on the programming environment or techniques you’re using, the different steps depicted in Figure 2-2 may be implicitly or explicitly executed. To make the difference clear, take a look at the following two PL/SQL blocks that are available in the lifecycle.sql script. Both have the same purpose (reading one row from the emp table), but they’re coded in a very different way.
The first is a PL/SQL block using the dbms_sql package to explicitly code every step shown in Figure 2-2:
DECLARE
dbms_sql.parse(l_cursor, 'SELECT empno FROM emp WHERE ename = :ename', 1); dbms_sql.define_column(l_cursor, 1, l_empno);
dbms_sql.bind_variable(l_cursor, ':ename', l_ename); l_retval := dbms_sql.execute(l_cursor);
IF dbms_sql.fetch_rows(l_cursor) > 0 THEN
dbms_sql.column_value(l_cursor, 1, l_empno); dbms_output.put_line(l_empno);
END IF;
dbms_sql.close_cursor(l_cursor); END;
The second is a PL/SQL block taking advantage of an implicit cursor; basically, the PL/SQL block delegates the control over the cursor to the PL/SQL compiler:
DECLARE
24
a slight but important difference. Independently of how many rows the query returns, the first block doesn’t generate an exception. Instead, the second block generates an exception if zero or several rows are returned.
How Parsing Works
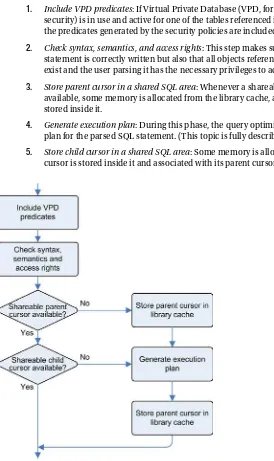
The previous section describes the life cycle of cursors, and this section focuses on the parse phase. The steps carried out during this phase, as shown in Figure 2-3, are the following:
1. Include VPD predicates: If Virtual Private Database (VPD, formerly known as row-level security) is in use and active for one of the tables referenced in the parsed SQL statement, the predicates generated by the security policies are included in its WHERE clause.
2. Check syntax, semantics, and access rights: This step makes sure not only that the SQL statement is correctly written but also that all objects referenced by the SQL statement exist and the user parsing it has the necessary privileges to access them.
3. Store parent cursor in a shared SQL area: Whenever a shareable parent cursor isn’t yet available, some memory is allocated from the library cache, and a new parent cursor is stored inside it.
4. Generate execution plan: During this phase, the query optimizer produces an execution plan for the parsed SQL statement. (This topic is fully described in Chapter 6.)
5. Store child cursor in a shared SQL area: Some memory is allocated, and the shareable child cursor is stored inside it and associated with its parent cursor.
Once stored in the library cache, parent and child cursors are externalized through the v$sqlarea and v$sql
views, respectively. Strictly speaking, the identifier of a cursor is its memory address, both for the parent and the child. But in most situations, cursors are identified with two columns: sql_id and child_number. The sql_id column identifies parent cursors. Both values together identify child cursors. There are cases, though, where the two values together aren’t sufficient to identify a cursor. In fact, depending on the version1, parent cursors with many children are
obsoleted and replaced by new ones. As a result, the address column is also required to identify a cursor. When shareable parent and child cursors are available and, consequently, only the first two operations are carried out, the parse is called a soft parse. When all operations are carried out, it’s called a hard parse.
From a performance point of view, you should avoid hard parses as much as possible. This is precisely why the database engine stores shareable cursors in the library cache. In this way, every process belonging to the instance might be able to reuse them. There are two reasons why hard parses should be avoided. The first is that the generation of an execution plan is a very CPU-intensive operation. The second is that memory in the shared pool is needed for storing the parent and child cursors in the library cache. Because the shared pool is shared over all sessions, memory allocations in the shared pool are serialized. For that purpose, one of the latches protecting the shared pool (known as shared pool latches) must be obtained to allocate the memory needed for both the parent and child cursors. Because of this serialization, an application causing a lot of hard parses is likely to experience contention for shared pool latches. Even if the impact of soft parses is much lower than that of hard parses, avoiding soft parses is desirable as well because they’re also subject to some serialization. In fact, the database engine must guarantee that the memory structures it accesses aren’t modified while it’s searching for a shareable cursor. The actual implementation depends on the version: through version 10.2.0.1 one of the library cache latches must be obtained, but from version 10.2.0.2 onward Oracle started replacing the library cache latches with mutexes, and as of version 11.1 only mutexes are used for that purpose. In summary, you should avoid soft and hard parses as much as possible because they inhibit the scalability of applications. (Chapter 12 covers this topic in detail.)
Shareable Cursors
The result of a parse operation is a parent cursor and a child cursor stored in a shared SQL area inside the library cache. Obviously, the aim of storing them in a shared memory area is to allow their reutilization and thereby avoid hard parses. Therefore, it’s necessary to discuss in what situations it’s possible to reuse a parent or child cursor. To illustrate how sharing parent and child cursors works, this section covers three examples.
The purpose of the first example, based on the sharable_parent_cursors.sql script, is to show a case where the parent cursor can’t be shared. The key information related to a parent cursor is the text of a SQL statement. Therefore, in general, several SQL statements share the same parent cursor if their text is exactly the same. This is the most essential requirement. There’s, however, an exception to this when cursor sharing is enabled. In fact, when cursor sharing is enabled, the database engine can automatically replace the literals used in SQL statements with bind variables. Hence, the text of the SQL statements received by the database engine is modified before being stored in parent cursors. (Chapter 12 covers cursor sharing in more detail.) In the first example, four SQL statements are executed. Two have the same text. Two others differ only because of lowercase and uppercase letters or blanks:
SQL> SELECT * FROM t WHERE n = 1234; SQL> select * from t where n = 1234;
SQL> SELECT * FROM t WHERE n=1234; SQL> SELECT * FROM t WHERE n = 1234;
26
Through the v$sqlarea view, it’s possible to confirm that three distinct parent cursors were created. Also notice the number of executions for each cursor:
SQL> SELECT sql_id, sql_text, executions 2 FROM v$sqlarea
3 WHERE sql_text LIKE '%1234';
SQL_ID SQL_TEXT EXECUTIONS --- --- ---2254m1487jg50 select * from t where n = 1234 1 g9y3jtp6ru4cb SELECT * FROM t WHERE n = 1234 2 7n8p5s2udfdsn SELECT * FROM t WHERE n=1234 1
The aim of the second example, based on the sharable_child_cursors.sql script, is to show a case where the parent cursor, but not the child cursor, can be shared. The key information related to a child cursor is an execution plan and the execution environment related to it. As a result, several SQL statements are able to share the same child cursor only if they share the same parent cursor and their execution environments are compatible. To illustrate, the same SQL statement is executed with two different values of the optimizer_mode initialization parameter:
SQL> ALTER SESSION SET optimizer_mode = all_rows; SQL> SELECT count(*) FROM t;
COUNT(*) 1000
SQL> ALTER SESSION SET optimizer_mode = first_rows_1; SQL> SELECT count(*) FROM t;
COUNT(*) 1000
The result is that a single parent cursor (5tjqf7sx5dzmj) and two child cursors (0 and 1) are created. It’s also essential to note that both child cursors have the same execution plan (the plan_hash_value column has the same value). This shows very well that a new child cursor was created because of a new individual execution environment and not because another execution plan was generated:
SQL> SELECT sql_id, child_number, optimizer_mode, plan_hash_value 2 FROM v$sql
3 WHERE sql_text = 'SELECT count(*) FROM t';