www.elsevier.comrlocaterdsw
Flexible bed allocation and performance in the intensive care unit
Seung-Chul Kim
a,), Ira Horowitz
b,c, Karl K. Young
d, Thomas A. Buckley
e aCollege of Hospitality and Tourism Management, Sejong UniÕersity, Seoul, South Korea
b
Economics and Finance Department, City UniÕersity of Hong Kong, Kowloon,
Hong Kong, People’s Republic of China c
Decision and Information Sciences, College of Business Administration, UniÕersity of Florida, GainesÕille FL 32611, USA
d
IntensiÕe Care Unit, Queen Mary Hospital, Pokfulam, Hong Kong, People’s Republic of China
e
Department of Anesthesia and IntensiÕe Care Unit, The Prince of Wales Hospital, Shatin, New Territories,
Hong Kong, People’s Republic of China
Received 1 October 1998; accepted 1 October 1999
Abstract
Ž .
The beds of an intensive care unit ICU are a scarce resource. Stochastic patient demands for these beds and stochastic service times in their utilization make managing that resource a complex problem lacking an easy solution. The current practice in one Hong Kong hospital is for the ICU administrator to exploit the fact that there are some patients whose admission to the unit can be postponed. These are patients scheduled for an elective surgery that can be cancelled. One way to minimize the number of cancelled surgeries is to reserve some of the unit’s beds for the exclusive use of the elective-surgery patients. We evaluate various bed-reservation schemes via a simulation model that is based on this ICU’s historical data, and demonstrate the tradeoffs that each requires among various relevant system-performance measures. We further show how this information can be summarized in a classic efficient frontier. This frontier provides a useful medium through which the ICU administrator can communicate the rationale behind the chosen bed-allocation system to the surgeons and the ICU physicians, in an attempt to resolve the potential conflicts between them.q2000 Elsevier Science B.V. All
rights reserved.
Keywords: Operations strategy; Computer simulations; Facility layout; Scheduling
1. Introduction
Operations managers make repetitive decisions subject to capacity constraints that are not readily relaxed. Thus, utilizing the extant capacity optimally
)Corresponding author. The Chinese University of Hong Kong, Faculty of Business Administration, Shatin, New Territories, Hong Kong, People’s Republic of China. Tel.: q852-2609-7813; fax: q852-2603-6840.
Ž .
E-mail address: [email protected] S.-C. Kim .
is an operational imperative. Nowhere is this impera-tive better exemplified than in a hospital’s intensive
Ž .
care unit ICU where the lives of the hospital’s most critically ill patients are at stake.
We focus on the ICU in a not atypical Hong Kong public hospital whose administrator, acting as a triage officer, determines admissions priorities so as to enhance the number of surviving patients. Expanding capacity, the number of beds in the unit, is not an option, as ICU care is an unusually expensive ther-apy. Reducing capacity is not an option either, as
0272-6963r00r$ - see front matterq2000 Elsevier Science B.V. All rights reserved. Ž .
this would risk deserving patients being denied ad-mission to the unit or released prematurely. Thus, the ICU administrator’s problem is how to better utilize the existing capacity so as to relieve what upon occasion is a bed shortage and better serve the patients without incurring additional cost. Patients, however, are only one of several constituencies to which the administrator is accountable, and the pref-erences of those constituencies in the prioritization process often conflict. One especially prominent con-flict in our sample hospital is between the operating surgeons and the ICU physicians. This is a potential conflict in any hospital that has an ICU.
The basis for the conflict is that the surgeons must schedule elective surgeries and the operating theater well in advance, and assume there will be an empty bed in the ICU, whereas the ICU physicians set their admissions priorities based upon all the applicants’ needs. In this setting, the administrator often must
Ž .
deny admission to an elective-surgery ES patient, ex ante, thereby forcing the surgeon to cancel and reschedule the surgery, which can have several nega-tive consequences. First, this can wreak havoc with both the surgeons’ schedules and those of the sup-porting staff, and waste the time of some highly skilled people. Second, the cancellations require changes in the operating theater’s schedule. Last, they can cause great psychological stress on patients, few of whom view their own surgeries as being ‘‘minor’’.
To resolve the conflict, the surgeons have pro-posed reserving some ICU beds exclusively for ES patients. Though blatantly self-serving, this is not necessarily a bad idea. Indeed, some form of reserva-tion strategy might be a very good idea that offers the administrator a way out of a very ticklish man-agerial situation. But lives rather than personal sensi-bilities are involved in the bed-reallocation process. Therefore, in lieu of tinkering with the actual bed arrangements, we use a simulation model to explore the implications of a bed-reservation strategy. The model generates the data that are relevant to evaluat-ing the effects of two specific forms of reservation
Ž .
strategy: a classic dependency unit DICU attached to the surgery department, and a novel flexible bed
Ž .
allocation FBA scheme that reserves beds for ES patients. The strategies are evaluated on various performance criteria both for ICU patients as a group
and for patients delineated by each of four distinct sources from which the unit receives its referrals. The model’s parameters are determined empirically from historical data.
An earlier version of the model, which was ex-pressly built to analyse this ICU’s operations, is
Ž .
described in detail in Kim et al. 1999 , where we confirm its validity for the unit. Our simulations alone led us to infer that ‘‘insofar as there are serious issues relating to the managerial aspects of this particular ICU, these emanate solely from elec-tive surgery’’, and that ‘‘the current ICU capacity of 14 beds is sufficient to handle patients at the current
Ž .
arrival rates’’ Kim et al., 1999, p. 45 . These infer-ences and the expressed concerns of the protagonists have prompted the present extension of that earlier work. In this extension, we first refine the basic model by introducing and verifying a new assump-tion as to the distribuassump-tion of service times for the ES patients. Second, we explore the implications of various FBA strategies in a multiple-objective set-ting. Third, we introduce the administrator to the concept of an efficient frontier both as an immediate decision aid and as a visual means to help explain to the physicians and surgeons the preferred choice among those strategies and the status quo.
There is a considerable literature on hospital ca-pacity and bed allocation. Some of this literature
Ž
relies on queuing theory Bailey, 1954; Cooper and
.
Corcoran, 1974 . Elsewhere, simulation is preferred
ŽGoldman et al., 1968; Blewett et al., 1972; Kuzdrall et al., 1974; Kwak et al., 1975; Kao and Tung, 1981; Williams, 1983; Dumas, 1984; Dumas, 1985; Hashimoto et al., 1987; Rakich et al., 1991; Parry
.
and Petroda, 1992; Ridge et al., 1998 . Simulation has also been widely used in attempts to improve other aspects of hospital performance. Some recent
Ž .
studies in point are McAleer et al. 1995 , Wharton
Ž1996 , Klassen and Rohleder 1996 and Gonzalez. Ž .
Ž . Ž .
et al. 1997 .Butler et al. 1996 contains a survey of the literature on operations management in the strate-gic planning process in hospitals. The present paper adds to that specific literature directed at bed alloca-tion and scheduling in the ICU.
Previous research specific to ICUs focused pri-marily on the clinical aspects of their operations
ŽTeres et al., 1991; Zussman, 1992; Oh et al., 1993;
.
Ž .
books Williams, 1983 Ridge et al., 1998 . The latter data often show only admitted patients and do not detail the number of patients that arrive and are admitted or rejected, on a daily basis. We are the first to develop and evaluate a bed-allocation and scheduling method for an ICU via a validated simu-lation model that is based on around-the-clock data that were specifically collected by the hospital for capacity planning purposes. We are also the first to incorporate the specific objective of reducing the cancellation of elective surgeries, considered as one of a pair of objectives in a multiple-objective prob-lem.
Our principal conclusion is that FBA will greatly facilitate the scheduling of elective surgeries and ES patient care, without adding to the hospital’s costs. The price to be paid is principally in the added queuing time endured by other patients. This is just one of the unavoidable tradeoffs that must be made. It falls to the administrator to evaluate the tradeoffs and determine the system to put in place. As the triage officer, the administrator must also communi-cate with the various attending physicians and com-ponents of the hospital that are involved in ICU
Ž .
patient care Teres, 1993, p. 600 . In identifying and quantifying the tradeoffs, and determining the sys-tems that are dominated, the simulation’s output should greatly assist the administrator in the manage-rial communication and conflict-resolution process. The proffered means for helping to accomplish this is an efficient frontier that is derived from the simu-lations. The general principles we infer and the approach we take in the inferential process should interest hospital administrators globally, too, since this ICU and its multiple-objective capacity manage-ment problems are very much like those faced else-where.
2. The intensive care unit
2.1. Admission and bed allocation
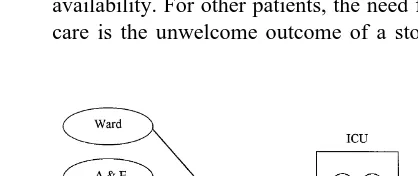
We study a multi-disciplinary ICU that receives patients from five sources: ward; accidents and
Ž . Ž .
emergency A & E ; operating theater OT
-emer-Ž .
gency; operating theater OT -elective; and other hospitals. As there was only one hospital referral in
the 6-month sample period, we treat the unit as if all of its patients come from the four basic sources.
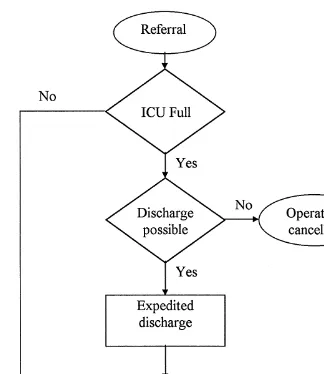
The ICU physicians’ review of a referral’s dossier might take from a few hours to a few days. Qualified referrals from any group join a single queue for a bed, as shown in Fig. 1. Admission is on a first-come, first-served basis. When there are empty beds, all qualifying patients are admitted immediately. When there is no empty bed, a sufficiently recovered pa-tient is given an expedited discharge to a general ward. When the severity of a referral’s illness re-quires immediate admission, an expedited discharge might become a virtual necessity. If no bed is empty and an expedited discharge is infeasible, the new referral joins the queue; in the case of ES patients, the operation is cancelled and rescheduled. Fig. 2
Ž .
shows the admission process for OT -elective pa-tients.
Although the administrator is the triage officer in the prioritization process, the physicians have the
final say as to admission or rejection. Referrals are
not admitted if they die prematurely, if they are judged to be either too well or too ill to qualify for intensive care, or if the ICU is full. Table 1 shows the average admission and survival rates from each source.
2.2. ElectiÕe surgery-related problems
As Table 1 shows, the patient groups differ in arrival frequency and pattern, admission and survival rates, and treatment times. These differences are especially acute for ES patients. First, their surgeries are scheduled in advance in accordance with a sur-geon’s schedule, given their condition and ICU bed availability. For other patients, the need for intensive care is the unwelcome outcome of a stochastic
Fig. 2. The flow chart of the admission process for OT-electives.
cess. Second, an ES patient’s medical history and condition is well known. This simplifies the review-and-admission decision. Third, the medical condi-tions of these patients are usually less severe and require less intensive monitoring during the postop-erative recovery period than those of their ICU roommates. Fourth, the average ES patient requires less ICU time than does the average patient from any
Table 2
Percentage and number of patients rejected due to a full ICU during the 6-month study period
Source Percent Number Survival
Ward 3.33 13 6
A&E 1.03 2 1
OT-emergency 0.0 0 0
OT-elective 23.56 49 Operation-cancelled
source other than A & E; most ES patients are dis-charged within 48 h. Lastly, their paths of recovery are more predictable and their mortality rate is one fourth of the rate of the others. Because of these characteristics, during high-demand periods ES pa-tients are often asked to take a back seat in favour of patients from the other groups who are in more immediate dire straits. Table 2 shows the abnormally higher one-in-four rejection rate for OT-elective pa-tients due to a full ICU.
2.3. AlternatiÕe bed-allocation methods
2.3.1. Creation of a dependency unit
A DICU is attached to a functional unit such as the surgery department and limits its service exclu-sively to patients in the post-operative recovery stage. This type of ICU is widely implemented in the
Table 1
Ž .
Admission rates excluding the rejections due to a full ICU , survival rates, and the percentage discharged within 48 h
After eliminating the records with missing information, the full sample contains 882 patient arrivals: 390 for ward; 194 for A & E; 90 for OT-emergency; 208 for OT-electives. Numbers admitted are 559 patients: 188 for ward; 129 for A & E; 87 for OT-emergency; 155 for OT-elective. Rejections due to a full ICU are excluded when calculating admission and rejection rates
Source Review Percent Survival Percent Discharged
Ž .
outcome outcome within 48 h %
Ward Admitted 50.40 Lived 69.15
Died 30.85 61.27
Rejected 49.60
A & E Admitted 69.73 Lived 75.19
Died 24.81 64.52
Rejected 30.27
OT-emergency Admitted 96.67 Lived 67.82
Died 32.18 45.68
Rejected 3.33
OT-elective Admitted 97.48 Lived 92.90
Died 7.10 81.88
United States. A pediatric DICU designed to meet the special needs of seriously ill children has a staff trained in both pediatric and critical care.
The creation of a DICU for ES patients by physi-cally locating some beds in a place other than the current ICU should improve the service to those patients, because they will no longer compete for a bed with other patients. The performances of both units are likely to be less than optimal, however, because each one, and particularly the DICU, is subject to larger fluctuations in overall patient ar-rivals. Further, the remaining ICU will have fewer beds to allocate to referrals from the other sources during periods when fewer scheduled elective surg-eries might otherwise result in slack. Thus, the cur-rent ICU may enjoy the advantages of ‘‘diversifica-tion’’, which in this context implies that the fluctua-tions of patient arrivals from one source might offset the fluctuations from another source. Such offsets stabilize the pattern of arrivals and demands and will have a positive impact on the ICU’s performance.
2.3.2. Flexible bed allocation
FBA, which to the best of our knowledge is being proposed here for the first time, maintains all beds within the current ICU, reserving one or more for the exclusive use of ES patients. This is a one-way stream, since the FBA scheme that the surgeons favour assigns any empty unreserved bed to an ES referral when the reserved beds are fully occupied.
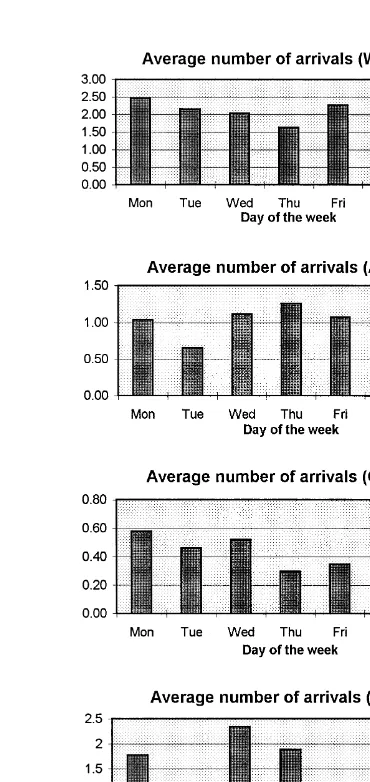
Four bed-reservation schemes were tested under the basic FBA umbrella as alternatives to the current system, labelled Strategy 1. The first, Strategy 2, reserves some beds exclusively for ES patients. The other three schemes, which run counter to the sur-geons preferences, seek to exploit the fact that elec-tive surgeries are seldom performed on weekends. Under these circumstances, it seems reasonable to consider allowing patients who would not otherwise qualify for a reserved bed to occupy an empty one on weekends, when the unreserved beds are fully occupied. An additional condition is that the latter patients should come from groups that require rela-tively little ICU time. This restriction would nor-mally release the reallocated reserved beds for ES patients on the following Monday.
A look at the A & E patient-arrival and service-time patterns encouraged consideration of a Strategy
3 that opens up the reserved beds to admit A & E patients on Fridays and Saturdays. During our sam-ple period on average there were 1 to 1.5 A & E arrivals on Fridays and Saturdays, and the average A & E arrival spends about 2 days in the ICU. Some other schemes inspired by the data of Fig. 3 were also considered, but few proved worthy. Of these, we only detail our results for a Strategy 4 that opens up the reserved beds to all the patients on Fridays and Saturdays, and for Strategy 5 under which the reserved beds are shared with OT-emergency pa-tients throughout the week. Table 3 summarizes the
Table 3
Bed allocation methods tested in the simulation
Systems Description Bed numbers tested
I. Current bed allocation There is no reserved bed for any group; 13 beds methodsStrategy 1 OT-elective patients often receive
lower priority
II. DICU Locate some beds in other place for 3,4,5,6 beds for DICU
OT-elective patients only III. FBA
ExclusivesStrategy 2 Reserved beds are used exclusively by 1, 2, 3, 4, 5-bed cases are
OT-elective patients tested in the preliminary
Reserveropen to A & E on Frir Reserved beds are open to use by A & E experiment. 3-bed case
SatsStrategy 3 patients on Fridays and Saturdays is used for main experiment
Reserveropen to all Frir Reserved beds are open to use by all SatsStrategy 4 patients on Fridays and Saturdays Shared reservation with Reserved beds are shared with
OT-emergencysStrategy 5 OT-emergency patients throughout the week
most salient bed-reservation schemes tested in the simulation experiment.
3. The simulation model
3.1. Underlying data and the simulation model
The model’s parameters, given in Tables 1 and 4, derive from round-the-clock data collected in the ICU from March–August 1995. The parameters in-clude admission and survival rates, mean arrival rates and service times, and their respective vari-ances, for each group
The current ICU configuration is akin to a multi-ple-parallel-server queuing model with each bed act-ing as a server. Such models typically hypothesize Poisson arrivals and exponential service times. Based on thex2 test results of Table 4, except for
OT-elec-Ž .
tives we cannot reject these hypotheses as0.05 for our ICU. As for OT-electives, the patient arrival data of Fig. 3 reveal that elective surgeries are seldom scheduled for weekends, a pattern confirmed by operating-theater allocation forms showing only Saturday-morning surgeries. After excluding week-end data, the x2 test also fails to reject the
Poisson-Ž .
arrival assumption for OT-electives as0.05 . The exponential assumption that was used in our initial work and that was serviceable for our more
Ž .
modest purposes there Kim et al., 1999 appears to
be invalid for OT-elective service times; the standard
Ž .
deviation of the service times 65.78 is 35% greater
Ž .
than the mean 48.72 . Given our present focus exclusively on elective surgeries, to assure that the protagonists would feel comfortable with our results and inferences, it was incumbent upon us to replace that assumption with one that is valid. On theoretical grounds alone we rejected such continuous densities as the normal and the uniform. The normal and uniform densities whose parameter values corre-spond to the statistics have inordinately high proba-bilities of generating negative service times. The lognormal density, the exponential density, and the gamma density whose parameters correspond to these statistics were rejected by x2 tests. For example, a gamma density with parameter values of as0.5486 and bs88.8028 has a mean and variance equal to that of our sample statistics. The x2 test, however, rejects the hypothesis that this density ‘‘generated’’ our sample data.
Closer Õisual inspection of Fig. 4 suggested to us that OT-elective service times fall into three classes. In the first class, comprising 96 observations, the modal service time is between 24 and 28 h. In the second class, comprising 29 observations, the modal service time is between 42 and 46 h. The third class comprises the remaining 24 observations.
Table 4
2 Ž . Ž . Ž .
x goodness-of-fit tests on arrival rates l and the ICU service times m length of stay
a a
Source Mean Variance H0 Mean Variance H0
2 2
Ž .lrday Žsa . Žm. Ž ., h Žss . Ž ., h
Ž . Ž .
Ward 2.120 2.638 accepted 0.10-p-0.25 63.73 4976.21 accepted 0.05-p-0.10
Ž . Ž .
A & E 1.054 1.149 accepted 0.25-p-0.50 48.48 2952.58 accepted 0.05-p-0.10
Ž . Ž .
OT-emergency 0.489 0.489 accepted 0.25-p-0.50 77.47 5353.98 accepted 0.25-p-0.50
b b Ž . c Ž .
OT-elective 1.515 1.568 accepted 0.05-p-0.10 48.72 4326.47 rejected p-0.005
a Ž .
All are one-tailed tests withas0.05; for detailed procedure, see, e.g., Snedecor and Cochran 1980, p.75 .
b
OT-elective arrival rates exclude Saturdays and Sundays.
c
As discussed in the text, for OT-electives the service times are determined through three gdensities chosen, at random, with fixed probabilities.
have a mean service time of 19.19 h and a variance of 39.02 h. The gamma density corresponding to these statistics has parameters of a1s9.4359 and b1s2.0335. The second class contains service times of at least 34 h and less than 63 h. These patients, who generally spend at least one night and at most two nights in the unit, have a mean service time of 42.42 h and a variance of 26.89. The gamma density corresponding to these statistics has parameters of a2s66.8894 and b2s0.6341. The remaining ob-servations have a mean of 175.50 and a variance of 7447.04, for which the corresponding gamma density
has parameters of a3s4.0889, and b3s42.6765. These patients have quite open-ended recovery times. To test the hypothesis that in combination these densities would generate service times in line with those of our sample data, we divided the time contin-uum into 15 classes chosen such that each has between 8 and 13 expected observations, and none covers less than two actual service times. The ex-pected number in each class was obtained by first determining the proportion of the density, for each of the three densities, falling within that class. For the first class, which consists of service times of 12 h or
less, the proportions are 0.110337, 0.0, and 0.000162, respectively. Using weights of 96, 29, and 24 the
Ž . Ž .
expected number is computed as 96 0.11 q29 0 q
Ž .
24 0 s10.5914. Proceeding in this manner, we ob-tain a x2 statistic of 20.24; the critical x2 value is 22.36. Thus, we cannot reject the null hypothesis of a tripartite gamma density, and we use this density in our simulations. In those simulations, the first den-sity is given a weight of 96r149s0.644, the second is given a weight of 29r149s0.195, and the third is given a weight of 24r149s0.161. That is, for example, with probability 0.644 service times are randomly generated using the first density.
The ICU has 14 beds. In order to model a normal condition for the unit, our data analysis excluded patients whose stays were unusually long, namely in excess of 15 days. These service times comprised 5.89% of the total number of observations. To com-pensate for their elimination, we proceed as if there are only 13 beds in the ICU, which reduces the available capacity by 7.14%. Thus, our approach is a conservative one.
The model uses the SLAM II simulation language
ŽPritsker, 1986 with user-written FORTRAN pro-.
grams and the data of Table 4. Our earlier model
Ž .
presented in Kim et al. 1999 was coded in XCELL q, which is a menu driven graphical animation software with limited capability in modelling com-plex situations. The present extension of that work develops and tests various schemes that could not be programmed in XCELLq. SLAM II, however, al-lows one to run user-programmed subroutines in FORTRAN.
OT-elective arrivals are generated for Monday through Friday by skipping weekends. To further emulate the current situation, when there are no empty beds in the ICU, a simulated OT-elective arrival does not join the queue. Rather, as in the real world that arrival is not admitted to the unit and is not permitted to wait for a bed to be released. Instead, the arrival is recorded as a cancelled surgery. Expedited discharges are not specifically modelled, nor did we separate the different causes for rejection. Expedited discharges enter through the service times and their distributions for each group. The overall admission and rejection rates reflect all of the differ-ent causes over the 6-month sample period. In the simulations, ES patients join the others in the queue
on a first-come, first-served basis, and cancelled surgeries are not rescheduled. The actual arrival numbers reflect any cancelled and then rescheduled surgeries, and the OT-elective arrival distribution used in the simulation does, too.
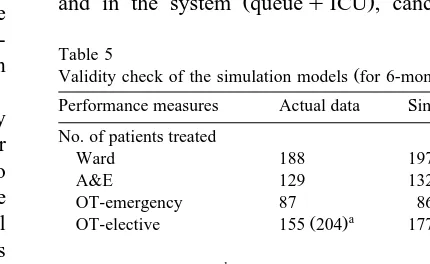
3.2.. ModelÕalidity and the experiment
The simulation experiment was run for a 20-year time span. Table 5 shows the actual data and the simulation results. Except for ES patients treated, the simulation results correspond closely to the actual data. A reason for the relatively large ES-patient discrepancy is that simulated OT-elective arrivals are not generated for Saturday or Sunday, although a few elective surgeries were in fact performed on weekends.
To evaluate a DICU, we first computed the pro-portion of ES patients among the total arrivals as 208r882s0.2358. The number of beds tested ini-tially was then set at 0.2358=13f3, and increased in unit increments to determine the best-performing level. To evaluate FBA, the number of reserved beds is increased incrementally starting from one bed.
System performance is evaluated through the seven criteria that most concern the ICU physicians, the surgeons, and the ICU administrator. These are bed utilization, average number of patients waiting in the queue, average time spent waiting in the queue
Ž .
and in the system queueqICU , cancelled
surg-Table 5
Ž .
Validity check of the simulation models for 6-months Performance measures Actual data Simulation No. of patients treated
Ward 188 197.1
A&E 129 132.4
OT-emergency 87 86.7
a Ž .
OT-elective 155 204 177.2
b
No. of patients rejected
Ward 189 193.3
A&E 63 58.7
OT-emergency 3 3.1
OT-elective 4 5.1
a Ž .
Includes 49 rejected patients cancelled operations due to a full ICU, who would have been treated if they had waited, as in the simulation.
b
eries, and the number of patients treated and re-jected.
4. Analysis of results
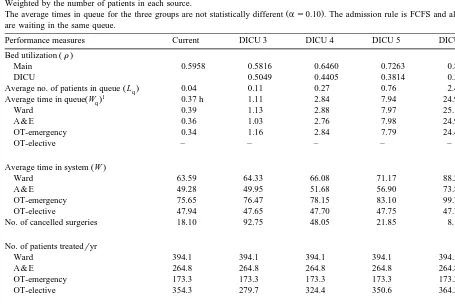
Table 6 presents the results for the DICU. The numbers of patients treated and rejected are compa-rable to the current ICU, except for OT-electives. More DICU beds mean fewer cancelled surgeries and lower bed utilization for OT-electives. Other than patients treated, all performance measures dete-riorate for the other groups. This is not unexpected since increased DICU capacity means decreased ca-pacity for the other groups. The issue, then, is not whether a DICU impacts adversely on other patients.
Rather, the issue is whether any favourable effects on ES patients outweigh those adverse impacts.
In no case did a DICU outperform the current system in all aspects. The three-bed unit performed comparably in terms of bed utilization, but cancelled surgeries increased fivefold. With a six-bed DICU, cancelled surgeries more than halved, at a cost of a significant deterioration in queue performance for the main group. Specifically, the average number of patients in the queue increased from 0.04 to 2.40. In sum, a DICU only resolves the cancelled-surgeries problem by imposing substantially poorer service on the other patients.
FBA is evaluated with n of the 13 ICU beds reserved for ES patients, with n increased from 1 to
Table 6
Evaluation of the performance of the dependency unit Weighted by the number of patients in each source.
Ž .
The average times in queue for the three groups are not statistically different as0.10 . The admission rule is FCFS and all three groups are waiting in the same queue.
Performance measures Current DICU 3 DICU 4 DICU 5 DICU 6
Ž .
Bed utilization r
Main 0.5958 0.5816 0.6460 0.7263 0.8270
DICU 0.5049 0.4405 0.3814 0.3305
Ž .
Average no. of patients in queue Lq 0.04 0.11 0.27 0.76 2.40
1 Ž .
Average time in queue Wq 0.37 h 1.11 2.84 7.94 24.96
Ward 0.39 1.13 2.88 7.97 25.11
A & E 0.36 1.03 2.76 7.98 24.97
OT-emergency 0.34 1.16 2.84 7.79 24.48
OT-elective – – – – –
Ž .
Average time in system W
Ward 63.59 64.33 66.08 71.17 88.28
A & E 49.28 49.95 51.68 56.90 73.88
OT-emergency 75.65 76.47 78.15 83.10 99.75
OT-elective 47.94 47.65 47.70 47.75 47.75
No. of cancelled surgeries 18.10 92.75 48.05 21.85 8.10
No. of patients treatedryr
Ward 394.1 394.1 394.1 394.1 394.1
A & E 264.8 264.8 264.8 264.8 264.8
OT-emergency 173.3 173.3 173.3 173.3 173.3
OT-elective 354.3 279.7 324.4 350.6 364.3
No. of patients rejectedryr
Ward 386.5 386.5 386.5 386.5 386.5
A & E 117.3 117.3 117.3 117.3 117.3
OT-emergency 6.1 6.1 6.1 6.1 6.1
5 incrementally. As anticipated, as n increases, the measures for the favoured ES patients improve while those for the others worsen. Specifically, cancelled surgeries again decline, but for the other groups the waiting times and the number of waiting patients increase. Once again the issue is whether the benefits to the favoured group offset the costs to the others. The changes for these measures are nonlinear functions of the number of beds reserved. As more beds are reserved, the average waiting time in-creases, and cancelled surgeries decrease, at higher rates. Among the five cases tested, for expositional purposes the three-bed case was chosen for our main experiment as it gives the greatest reduction in can-celled surgeries with relatively less effect on the average queue size. This choice reflects our assess-ment of the alternatives and the performance criteria.
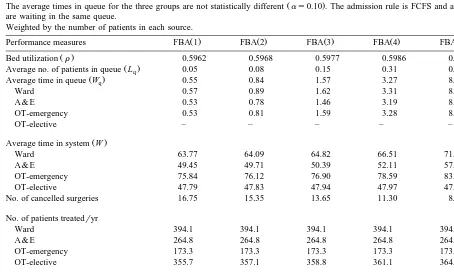
Table 7 shows the results of the pilot runs for the exclusive-reservation method.
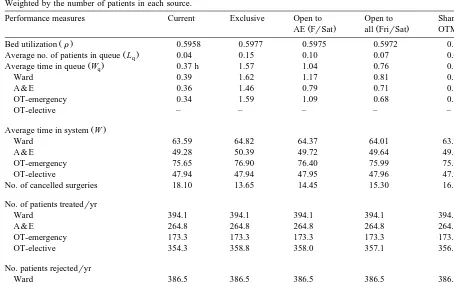
Table 8 compares the four FBA bed-reservation schemes with the current ICU. Three beds are re-served in all four cases. As with a DICU, all four schemes produced numbers of patients treated and rejected that are comparable to the current numbers. The four schemes, however, resulted in different levels of performance for the criteria of primary interest: average queue size and queuing times for patients coming from the Ward, A & E, and OT-emergency, and the number of cancelled surgeries. It is immediately apparent ex post that our ex ante conjectures are realized. On the one hand, a reserva-tion system benefits the surgeons and ES patients, insofar as it reduces the number of cancelled surg-eries. On the other hand, the system works to the
Table 7
Ž .
Determining the optimal number of beds for FBA scheme exclusive reservation
Ž .
The average times in queue for the three groups are not statistically different as0.10 . The admission rule is FCFS and all three groups are waiting in the same queue.
Weighted by the number of patients in each source.
Ž . Ž . Ž . Ž . Ž .
Performance measures FBA 1 FBA 2 FBA 3 FBA 4 FBA 5
Ž .
Bed utilization r 0.5962 0.5968 0.5977 0.5986 0.6000
Ž .
Average no. of patients in queue Lq 0.05 0.08 0.15 0.31 0.79
Ž .
Average time in queue Wq 0.55 0.84 1.57 3.27 8.24
Ward 0.57 0.89 1.62 3.31 8.26
A & E 0.53 0.78 1.46 3.19 8.25
OT-emergency 0.53 0.81 1.59 3.28 8.15
OT-elective – – – – –
Ž .
Average time in system W
Ward 63.77 64.09 64.82 66.51 71.46
A & E 49.45 49.71 50.39 52.11 57.17
OT-emergency 75.84 76.12 76.90 78.59 83.45
OT-elective 47.79 47.83 47.94 47.97 47.90
No. of cancelled surgeries 16.75 15.35 13.65 11.30 8.05
No. of patients treatedryr
Ward 394.1 394.1 394.1 394.1 394.1
A & E 264.8 264.8 264.8 264.8 264.8
OT-emergency 173.3 173.3 173.3 173.3 173.3
OT-elective 355.7 357.1 358.8 361.1 364.4
No. of patients rejectedryr
Ward 386.5 386.5 386.5 386.5 386.5
A & E 117.3 117.3 117.3 117.3 117.3
OT-emergency 6.1 6.1 6.1 6.1 6.1
Table 8
Comparison of four bed reservation schemes of FBA
Ž .
The average times in queue for the three groups are not statistically different as0.10 except for special arrangements such as Open to AE.
Weighted by the number of patients in each source.
Performance measures Current Exclusive Open to Open to Share with
Ž . Ž .
AE FrSat all FrirSat OTM
Ž .
Bed utilization r 0.5958 0.5977 0.5975 0.5972 0.5970
Ž .
Average no. of patients in queue Lq 0.04 0.15 0.10 0.07 0.06
Ž .
Average time in queue Wq 0.37 h 1.57 1.04 0.76 0.65
Ward 0.39 1.62 1.17 0.81 0.75
A & E 0.36 1.46 0.79 0.71 0.71
OT-emergency 0.34 1.59 1.09 0.68 0.30
OT-elective – – – – –
Ž .
Average time in system W
Ward 63.59 64.82 64.37 64.01 63.95
A & E 49.28 50.39 49.72 49.64 49.63
OT-emergency 75.65 76.90 76.40 75.99 75.61
OT-elective 47.94 47.94 47.95 47.96 47.96
No. of cancelled surgeries 18.10 13.65 14.45 15.30 16.30
No. of patients treatedryr
Ward 394.1 394.1 394.1 394.1 394.1
A & E 264.8 264.8 264.8 264.8 264.8
OT-emergency 173.3 173.3 173.3 173.3 173.3
OT-elective 354.3 358.8 358.0 357.1 356.1
No. patients rejectedryr
Ward 386.5 386.5 386.5 386.5 386.5
A & E 117.3 117.3 117.3 117.3 117.3
OT-emergency 6.1 6.1 6.1 6.1 6.1
OT-elective 10.2 10.2 10.2 10.2 10.2
detriment of all other patients, insofar as it lengthens their average waiting times. Put otherwise, there is no win–win situation here. Instead, tradeoffs have to be made and evaluated. The ultimate responsibility for making that evaluation and persuading the physi-cians and surgeons to accept the system hershe chooses falls to the administrator.
Notwithstanding the different tradeoffs, bed uti-lization under all four FBA variants is only marginally higher than with the current system. The most profound differences are in the average queuing times and cancelled surgeries. The exclusivity of Strategy 2 gives the greatest reduction in cancelled surgeries, a 24.6% reduction from 18.10 to 13.65. The cost is an average of 1.2 additional hours in queuing time that is borne almost uniformly by patients from each of the other sources. That addi-tional time can be halved by Strategy 3, opening the
reserved beds to A & E patients on Friday and Satur-day, but at a price of another cancelled surgery. This is a 6% increase in cancelled surgeries over the number with Strategy 2. We would have preferred our results to contain at least one patently superior option that markedly reduces cancelled elective surg-eries and has a negligible impact on waiting times. Such an option is unavailable. Still, our results have two important managerial implications.
ammunition with which to fend off the surgeons’ requests to implement some form of FBA.
Second, insofar as some reservation system is to be put in place, it is apparent that FBA has several advantages over DICU. The first is that FBA offers greater flexibility in resource utilization; the two units can share such resources as doctors and nurses without additional monetary cost. A second FBA advantage is its greater flexibility in bed allocation. The number of beds reserved can be readily changed if the patient arrival numbers change, as might occur between different seasons. Third, FBA will be more effective in offsetting the demand fluctuations be-tween groups. This is achieved by merging several groups into the same unit as opposed to isolating them in a DICU. Finally, our results indicate that FBA performs better on similar dimensions with a smaller number of reserved beds, and without the higher operating costs required for a DICU to per-form comparably.
4.1. The efficient frontier
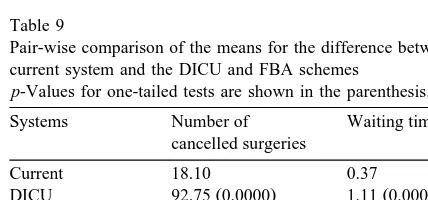
As shown in Table 9, the DICU option and all four FBA schemes result in statistically significant
Žp-0.004 increases in waiting times for the non-.
favoured groups. Statistical significance, however, need not imply that the increases are important in terms of how their impact on the patients’ health and welfare. As Table 9 also reveals two FBA schemes
Ž .
produce statistically significant as0.10 decreases in cancelled surgeries. These decreases may be im-portant, too. In evaluating alternatives, the adminis-trator must do a balancing act between statistically significant tradeoffs involving the two conflicting
Table 9
Pair-wise comparison of the means for the difference between the current system and the DICU and FBA schemes
p-Values for one-tailed tests are shown in the parenthesis.
Systems Number of Waiting time
cancelled surgeries
Current 18.10 0.37
Ž . Ž .
DICU 92.75 0.0000 1.11 0.0001
Ž . Ž .
FBA-exclusive 13.65 0.0219 1.57 0.0000
Ž . Ž .
FBA-open to AE 14.45 0.0547 1.04 0.0000
Ž . Ž .
FBA-open to all 15.30 0.1181 0.76 0.0005
Ž . Ž .
FBA-share with 16.30 0.2293 0.65 0.0037 OT-emergency
objectives of greatest moment to himrher in a multi-ple-objective problem.
As an interesting aside, although the performance numbers differed, essentially the same inferences were reached in our initial experiments when we generated the OT-elective service times using an exponential density whose parameter was taken as
Ž .
the standard deviation 65.78 for that category from the empirical data of Table 4. We chose to use the standard deviation rather than the mean, in order to be conservative in light of our rejection of the expo-nential-density hypothesis. The fact that the same policy inferences are drawn from such widely
differ-Ž
ing assumptions is not surprising. As Baker 1974, p.
.
230 wrote a quarter of a century ago, ‘‘the
implica-Ž .
tion that a policy does not suffer drastically if input information is unreliable suggests that the simplifica-tions often made in experimental models may not be crucial to the adaptation of simulation results to actual shop control’’.
In a related vein, rather than reducing the number of beds, we considered modelling the service times of the outliers, but rejected this option as there are only 32 patients in our set, with 15 coming from the Ward. Their fewness in numbers and the fact their service times are spread all over the map, is what makes them outliers. The only density that would seem appropriate for modelling these outliers is a uniform density, we would require a unique density for each of the four patient sources, and no case has a sufficient number of observations to permit a good-ness-of-fit test. Rather than invoking one of these suspect densities with probability 0.0589, we have chosen to reduce the number of beds by 7.14%. The numbers that we get might therefore be somewhat different from those in the alternative procedure, but they are conservative numbers that will yield the same basic conclusions and policy inferences as in the alternative approach.
Returning to our main theme, a classic approach for dealing with the multiple-objective problem is to determine the efficient frontier or trade-off curve that summarizes the Pareto-optimal tradeoffs between
Ž
these objectives Winston and Albright, 1997, pp.
.
353–354 . This approach has previously been used
Ž .
in a hospital setting Banker et al., 1986 , as well as in a variety of other settings. These include financial
Fig. 5. The efficient frontier.
. Ž
and Morey, 1999 , managerial Thanassoulis et al.,
. Ž
1996 , industrial Park and Simar, 1994; Tamiz et
. Ž
al., 1999 , economics Sueyoshi et al., 1998; Hibiki
Ž .
Fig. 6. The effects of adding one more bed 14 beds .
. Ž
and Sueyoshi, 1999 , marketing Horsky and Nelson,
. Ž .
1996 , and production De et al., 1992 settings. Fig.
Table 10
The effect of increasing the number of beds by 1 to 14 Weighted by the number of patients in each source.
Ž .
The average times in queue for the three groups are not statistically different as0.10 except for special arrangements such as Open to AE.
Performance measures Current Exclusive Open to Open to Share with
Ž . Ž .
AE FrirSat FrirSat OTM
Ž .
Bed utilization r 0.5565 0.5574 0.5573 0.5571 0.5570
Ž .
Average no. of patients in queue Lq 0.01 0.06 0.04 0.03 0.02
Ž .
Average time in queue Wq 0.14 h 0.64 0.42 0.29 0.24
Ward 0.15 0.68 0.47 0.30 0.29
A & E 0.14 0.57 0.31 0.28 0.26
OT-emergency 0.14 0.66 0.48 0.26 0.12
OT-elective – – – – –
Ž .
Average time in system W
Ward 63.35 63.88 63.67 63.51 63.49
A & E 49.06 49.49 49.23 49.20 49.19
OT-emergency 75.45 75.97 75.79 75.57 75.42
OT-elective 47.80 47.82 47.81 47.89 47.86
No. of cancelled surgeries 9.60 7.70 7.95 8.85 8.90
No. of patients treatedryr
Ward 394.1 394.1 394.1 394.1 394.1
A & E 264.8 264.8 264.8 264.8 264.8
OT-emergency 173.3 173.3 173.3 173.3 173.3
OT-elective 362.8 364.7 364.5 363.6 363.5
No. of patients rejectedryr
Ward 386.5 386.5 386.5 386.5 386.5
A & E 117.3 117.3 117.3 117.3 117.3
OT-emergency 6.1 6.1 6.1 6.1 6.1
Fig. 7. Number of admitted patients by month over the 2-yr period.
5 presents the efficient frontier that can be achieved through the current system and the four FBA bed-re-servation schemes. The dots indicate the five points
determined from the data of Table 8. The curve is sketched from four of those points; the fifth point, which is associated with opening the reserved beds to OT-emergency patients throughout the week, sits above the curve.
The efficient frontier has a negative slope and is convex. The slope is negative, because any reduction in the number of cancelled surgeries comes at the expense of additional waiting time. The frontier is necessarily convex, because we can always achieve a point on the straight line connecting any two points by a linear combination of those points. That is, we can employ a mixed strategy that implements one of the latter two pure strategies x percent of the time
Ž .
and the other 1yx percent of the time.
The strictly concave curves are hypothetical indif-ference curves drawn solely for illustrative purposes.
Table 11
Evaluation of the impacts of increased arrival rates with 40% increase
Ž .
The average times in queue for the three groups are not statistically different as0.10 except for special arrangements such as Open to AE.
Weighted by the number of patients in each source.
Performance measures Current Exclusive Open to Open to all Share with
Ž . Ž .
AE FrirSat FrirSat OTM
Ž .
Bed utilization r 0.7903 0.8000 0.7990 0.7997 0.7930
Ž .
Average no. of patients in queue Lq 0.46 2.35 1.34 1.11 0.80
Ž .
Average time in queue Wq 3.43 h 17.49 9.98 8.28 5.95
Ward 3.43 17.51 10.68 8.31 6.78
A & E 3.53 17.71 8.72 8.33 6.85
OT-emergency 3.29 17.12 10.33 8.14 2.61
OT-elective – – – – –
Ž .
Average time in system W
Ward 66.90 80.98 74.15 71.78 70.25
A & E 52.57 66.73 57.75 57.36 55.88
OT-emergency 78.48 92.29 85.51 83.33 77.80
OT-elective 49.12 48.32 48.74 48.94 48.99
No. of cancelled surgeries 155.90 114.00 123.00 130.05 143.85
No. of patients treatedryr
Ward 555.2 555.2 555.2 555.2 555.2
A & E 375.5 375.5 375.5 375.5 375.5
OT-emergency 242.2 242.2 242.2 242.2 242.2
OT-elective 373.4 415.3 406.3 399.2 385.4
No. patients rejectedryr
Ward 535.6 535.6 535.6 535.6 535.6
A & E 162.1 162.1 162.1 162.1 162.1
OT-emergency 8.3 8.3 8.3 8.3 8.3
They are strictly concave by the principle of dimin-ishing marginal utility. These curves summarize tradeoffs that an administrator would be willing to accept between the criteria. The problem is to deter-mine a point on the efficient frontier that also sits on the lowest of the indifference curves. This is the point of tangency between the two curves.
Any alternative resulting in a number of cancelled surgeries and an average waiting time that yields a point that lies above the efficient frontier is a domi-nated alternative. Thus, Strategy 5, which opens the reserved beds to OT-emergency patients throughout the week, is dominated. The accompanying implica-tion, however, is that there is some efficient strategy that we have not explored here that would improve on that dominated alternative. For example, we might consider opening up the reserved beds to OT-emer-gency patients only on Friday, or opening up the reserved beds to A & E and OT-emergency patients on Friday and Saturday. When no pure strategy can be found that improves on the ‘‘open-to-OT-emer-gency patients’’ alternative, the latter is still easily shown to be a dominated alternative. To show this we need only draw the line connecting the dots for pure Strategies 1 and 4.
Comparing the numbers in Tables 6 and 8 reveals that all the DICU alternatives are dominated by some FBA scheme. The efficient frontier provides the administrator with a basis for evaluating any and all of the alternative FBA schemes. The latter might include some that involve additional costs, such as adding one bed to the unit, while still holding three in reserve for ES patients. Is that additional cost worth the gain from reaching a point below the efficient frontier? This question must be answered at the higher levels in the managerial hierarchy. The patient-care data to help management make that de-cision are provided in Table 10. The associated efficient frontier is provided in Fig. 6.
With 14 beds, Strategy 4 is dominated. This is seen from the straight line connecting the dots for Strategies 3 and 5, which falls below the dot for Strategy 4. Comparing the data in Table 10 with their counterparts in Table 8 shows that the addi-tional bed only slightly reduces the overall bed-utili-zation rate and that all patients benefit from that bed. Under the current system, for example, the ES pa-tients benefit in that cancelled surgeries are almost
halved. Other patients benefit in that the average waiting time is more than halved. Under Strategy 2 the additional bed in the non-reserved-bed section reduces cancelled surgeries by 44% and cuts almost an hour off the average queuing time. At a mini-mum, these data provide management food for thought.
4.2. SensitiÕity analysis
A major advantage of FBA over a DICU in ameliorating the cancelled-surgery problem is its flexibility in that the number of reserved beds and the allocation scheme are readily altered without additional cost. An alteration can be implemented in a minimum of time and in response to such environ-mental changes as the patient mix and demand. One possible source of change that immediately leaps to mind is seasonal differences in the arrival rates from the different sources. As seen in Fig. 7, however, the
2-yr data from the hospital’s log book do not reveal any pronounced seasonal factor that affects overall demands. The comparable data for each of the four sources of referrals examined individually were equally unrevealing.
We conducted sensitivity analyses to evaluate the impacts of the changes in patient arrival rates on the performance of FBA, increasing the patient arrival rates by 10% increments up to a 40% increase. By way of illustration, Table 11 presents the results for a 40% increase. While all numbers increased com-pared to the levels of Table 8, one standout result is that the impact on waiting time is largest for Strategy 2 and smallest for Strategy 5. The impact on can-celled surgeries is unchanged in that the proportions for the different methods are not affected by the change in arrival rates. This is shown by the graphs of Fig. 8. The bed-sharing FBA system, Strategy 5, is the most flexible of those considered here. This implies that greater flexibility improves performance when increased demand tightens the capacity con-straint.
5. Conclusions
Managing the beds in an ICU is a difficult prob-lem that lacks a single solution to please everybody. New demands for ICU care and the service times required by its current residents are stochastic, which makes it impossible to guarantee admission to all deserving patients. When no beds are unoccupied, the administrator takes the path of least resistance. That path exploits the fact that there are some pa-tients whose admission can be postponed. The latter patients are those scheduled for elective surgery. In their case the surgery is cancelled, which inconve-niences the surgeon and the attending staff, to say nothing of the patient. It is therefore incumbent upon the administrator to make the most effective use of the extant bed capacity. One suggestion for achiev-ing this goal at minimal cost is to reserve some beds for the exclusive use of the elective-surgery patients. In dealing with this suggestion, the administrator faces two major issues. First, it is necessary to evaluate the various proffered bed-reservation schemes on any number of performance criteria, which creates a multiple-objective decision-making
problem. Second, it is necessary to communicate the results, and the reasons for either rejecting those schemes or for putting one in place, to those higher up in the managerial hierarchy, as well as to the operating surgeons and the ICU physicians.
We have used a validated computer-simulation model to demonstrate that there is no dominant solution to the bed-allocation problem. A solution that dominates along one dimension will be domi-nated along some other dimension. More critically, we have also used the model to identify the tradeoffs between objectives that are implied by changes from the current system to two types of bed-reservation systems: the dependency unit and flexible bed alloca-tion. We have shown how to develop an efficient frontier that provides a standard for evaluating any alternative. The frontier provides the administrator with both a readily derived multiple-objective deci-sion aid and a readily comprehended graphic device for explaining the rationale for the preferred alterna-tive.
An important general result is establishing the merits of some form of FBA for resolving the can-celled-surgery problem, as opposed to creating a DICU. We have shown its dominance in terms of cost, scheduling flexibility, and resource utilization. This is critical for the hospitals in the third-world countries that often cannot afford multiple forms of an ICU.
The success of any FBA will depend upon the administrator’s strict enforcement of the reservation policy. We recognize the rule of expediency under which the physicians may be tempted to use the reserved beds for a more urgent patient from other sources. In such cases the physicians must deal with the situation as if the ICU is full and there are no empty beds. The physicians must do what they are currently doing when the ICU is full: either seek an expedited discharge or reject the referral. Through a constant-cost bed reallocation, we can only succeed in easing, but not entirely eliminating, the effects of the capacity constraint.
Acknowledgements
References
Bailey, N.T.J., 1954. Queuing for medical care. Applied Statistics
Ž .
III 3 , 137–154.
Baker, K.R., 1974. Introduction to Sequencing and Scheduling. Wiley, New York.
Banker, R.D., Conrad, R.F., Strauss, R.P., 1986. A comparative application of data envelopment analysis and translog meth-ods: an illustrative study of hospital production. Management
Ž .
Science 32 1 , 30–44.
Bein, T., Frohlich, D., Frey, A., Metz, C., Hansen, E., Taeger, K., 1995. Is the transfusion requirement predictable in critically ill patients after admission to the intensive care unit?
Infusions-Ž .
therapie und Transfusionsmedizin 22 2 , 91–96.
Blewett, F., Grove, D.M., Marinas, J.D., Norman, J.D., Southern, K.M., 1972. Computer simulation models for a multi-specialty
Ž .
ward. Operational Research Quarterly 23 2 , 139–149. Butler, T.W., Leong, G.K., Everett, L.N., 1996. The operations
management role in hospital strategic planning. Journal of
Ž .
Operations Management 14 2 , 137–156.
Cooper, J.K., Corcoran, T.M., 1974. Estimating bed needs by means of queuing theory. New England Journal of Medicine
Ž .
291 22 , 404–405.
De, P., Ghosh, J.B., Wells, C.E., 1992. Heuristic estimation of the efficient frontier for a bi-criteria scheduling problem. Decision
Ž .
Sciences 23 3 , 596–609.
Dumas, M.B., 1984. Simulation modeling for hospital bed
plan-Ž .
ning. Simulation 43 2 , 69–78.
Dumas, M.B., 1985. Hospital bed utilization: an implemented simulation approach to adjusting and maintaining appropriate
Ž .
levels. Health Services Research 20 1 , 43–61.
Goldman, J., Knappenberger, H.A., Eller, J.C., 1968. Evaluating bed allocation policy with computer simulation. Health
Ser-Ž .
vices Research 3 1 , 119–129.
Gollinger, T.L., Morgan, J.B., 1993. Calculation of an efficient frontier for a commercial loan portfolio. Journal of Portfolio
Ž .
Management 19 2 , 39–46.
Gonzalez, C.J., Gonzalez, M., Rios, N.M., 1997. Improving the quality of service in an emergency room using simulation-animation and total quality management. Computers and
In-Ž .
dustrial Engineering 33 1–2 , 97–100.
Hashimoto, F., Bell, S., Marshment, S., 1987. A computer simula-tion program to facilitate budgeting and staffing decisions in
Ž .
an intensive care unit. Critical Care Medicine 15 3 , 256–259. Herrick, R.C., 1997. Exploring the efficient frontier: global risk
Ž .
management strategies. Risk Management 44 8 , 23–25. Hibiki, N., Sueyoshi, T., 1999. DEA sensitivity analysis by
chang-ing a reference set: regional contribution to Japanese industrial
Ž .
development. Omega 27 2 , 139–153.
Horsky, D., Nelson, P., 1996. Evaluation of salesforce size and productivity through efficient frontier benchmarking.
Market-Ž .
ing Science 15 4 , 301–320.
Kao, E.P.C., Tung, G.G., 1981. Bed allocation in a public health
Ž .
care delivery system. Management Science 27 5 , 507–520. Kim, S.C., Horowitz, I., Young, K.K., Buckley, T.A., 1999.
Analysis of capacity management of the intensive care unit in
Ž .
a hospital. European Journal of Operational Research 115 1 , 36–46.
Klassen, K.J., Rohleder, T.R., 1996. Scheduling outpatient ap-pointments in a dynamic environment. Journal of Operations
Ž .
Management 14 2 , 83–101.
Kuzdrall, P.J., Kwak, N.K., Schmitz, H., 1974. The Monte Carlo simulation of operating room and recovery room usage.
Opera-Ž .
tions Research 22 2 , 434–440.
Kwak, N.K., Kuzdrall, P.J., Schmitz, H., 1975. Simulating the use
Ž .
of space in a hospital surgical suite. Simulation 24 5 , 147– 152.
McAleer, W.E., Turner, J.A., Lismore, D., Naqvi, I.A., 1995. Simulation of a hospital’s theatre suite. Journal of
Manage-Ž .
ment in Medicine 9 5 , 14–26.
Morey, M.R., Morey, R.C., 1999. Mutual fund performance ap-praisals: a multi-horizon perspective with endogenous
bench-Ž .
marking. Omega 27 2 , 241–258.
Oh, T., Hutchinson, R., Short, S., 1993. Verification of the acute physiology and chronic health evaluation scoring system in a
Ž .
Hong Kong intensive care unit. Critical Care Medicine 21 5 , 698–705.
Park, B.U., Simar, L., 1994. Efficient semiparametric estimation in a stochastic frontier model. Journal of the American
Statisti-Ž .
cal Association 89 427 , 929–936.
Parry, R., Petroda, H., 1992. Planning surgical services using
Ž .
computer modelling. OR Insight 5 3 , 20–22.
Pritsker, A.A.B., 1986. Introduction to Simulation and Slam II. 3rd edn. Halstead Press, New York, NY.
Rakich, J.S., Kuzdrall, P.J., Klafehn, K.A., Krigline, A.G., 1991. Simulation in the hospital setting: implications for managerial decision making and management development. Journal of
Ž .
Management Development 10 4 , 31–37.
Ridge, J.C., Jones, S.K., Nielsen, M.S., Shahani, A.K., 1998. Capacity planning for intensive care units. European Journal
Ž .
of Operational Research 105 2 , 346–355.
Snedecor, G.W., Cochran, W.G., 1980. Statistical Methods. 7th edn. The Iowa State Univ. Press, Ames, IW.
Sueyoshi, T., Hasebe, T., Ito, F., Sakai, J., Ozawa, W., 1998. DEA-bilateral performance comparison: an application to Japan
Ž . Ž .
agricultural co-operatives Nokyo . Omega 26 2 , 233–248. Tamiz, M., Mirrazavi, S.K., Jones, D.F., 1999. Extensions of
Pareto efficiency analysis to integer goal programming. Omega
Ž .
27 2 , 179–188.
Teres, D., 1993. Civilian triage in the intensive care unit: the ritual
Ž .
of the last bed. Critical Care Medicine 21 4 , 598–606. Teres, D., Avrunin, J.S., Lemeshow, S., 1991. Severity of illness
Ž .
modeling. In: Rippe, J. Ed. , Intensive Care Medicine. 2nd Ed. Little Brown, Boston, pp. 1953–1962.
Thanassoulis, E., Boussofiane, A., Dyson, R.G., 1996. A compari-son of data envelopment analysis and ratio analysis as tools
Ž .
for performance assessment. Omega 24 3 , 229–244. Wharton, F., 1996. On the risk of premature transfer from
coro-Ž .
nary care units. Omega 24 4 , 413–423.
Williams, S.V., 1983. How many intensive care beds are enough?
Ž .
Critical Care Medicine 11 6 , 412–416.
Winston, W.L., Albright, S.C., 1997. Practical Management Sci-ence. Duxbury Press, Belmont, CA.