Representation of Electronic Control Unit Impedances in the Simulation
of RF Current Absorption by a Vehicle Wiring Harness
ABSTRACT: The papaer describes the measurement of the circuit impedance looking in to the pins of a automotive electronic control unit (ECU). The pins are categorised for circuit function as being inputs or outputs, with the ECU powered up or powered down and resulting data for each of the four categoris converted into a passive RLC equivalent form. These generalised end impedances are then used as part of a transmision line modl of the vehicle wiring system, in order to predict its absorbtion of radio frequency (RF) curent when illuminated by a radiated elctromagnetic field. It is found that the majority of impedances can be represented by RC models, with significant differences between the cases of ECU powered uo and powered down.
Introduction
Road vehicles are becoming more sophisticated and utilise electronic controls for most major systems. The immunity of uch systems to externally-generated electromagnetic interference is an area witch has been acknowledged as being amn important topic in research, vehicle development and legislation. The electromagnetic modelling of the vehicle wiing harness is one way of predicting its absorbtion of externally-generated RF fields and the size of the resulting induced current. In order to do this, the impedances at each end of the wires need to be represented in the model. In the cas of a passive sensor or acuaor, this model is usually a straightforward combination of passive R, L, C components. When the case of an Ecu is considered as a harness termination, it can be difficult to use the same simple representation because of the number and active nature of components involved. In other published work, a network analyser has been used to caracterise radio freqvency heating systems in industry (1), but there is little work in the caracterisation of complex ECUs. Two methods of obtaining these impedances values seen at ECU pins are:
1. to carry aut a detailed circuit level simulation of the ECU to give models adequate for the highest frequency of interest.
2. by measurement of the impedances looking into the Ecu pins.
From a consideration of circuit schematic diagrams of different ECUs, it was noted that similar circuit topologies were commonly applied for inputs and outputs. It was felt that there were insufficient „power supply” pins on the ECU to be satistically representative and „ground” pins were likely to be low impedance. If it could be shown that the impedances of a standard input and a standard output adequately represented all inputs and all outputs respectively, then these generic models could be used for future wiring harness simulations.
A measurement approach was used here, with the intention of being able to produce generic inputa and output impedance models. These generic models, oance validated, could then be used to represent pin impedances for similar ECUs.
The final application of the impedance value in this case was M-HARNESS, a transmission line model used to represent the vehicle wiring harness which used lumped parameter representations of the end impedances of a individual wires in the harness. The generic models were thus converted into lumped R, L, C equivalents in order to be used with M-HARNESS.
Impedance Mesurement Method
The VNA carries aut a reflection measurment and uses the complex reflection coefficient ρ to calculate the unknown impedance , ZL, as given in the following formula. Zo represents the system characteristic impedance of 50 Ω:
ρ
The real and imaginary terms ofmesured impedance were measured for each pin and for frequencies between 1 MHz and 100 MHz.
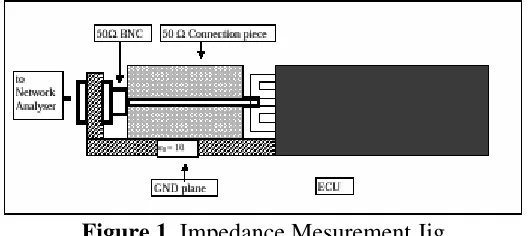
In order to carry aut the measurement, a jig (Figure 1) was needed to form the link between the connector of the VNA and the pins of the ECU. The ground connection was realised with a large ground plane. The use of asuitable calibration procedure secured the reduction ofpossible errors.
Figure 1. Impedance Mesurement Jig
An Open-Short-Load (OSL) calibration was applied, with an unconnected pin on the ECU used the Open Standard. A ground was used as Short standard and finally the Load standard was applied. A port extension measurement (compensating for the effects of the jig) concluded the calibration procedure.
Once the equipment had been calibrated, the measurements of each ECUs pin impedance were taken twice, once with and once without 12 V applied to the ECUs normal power supply pins.
Conversion
The results of the VNA measurement were formatted as:
imaginar al
F
N
Z
Z
Z
,=
Re+
(2)Where Zreal is the resistive part and Zimaginary the reactive part of the impedance of pin n, at frequency f. Measurements were made over the frequency range 1 MHz to 100 MHz in 500KHz steps.
In order to more easily compare impedance results, the individual Zn,f values were converted to a passive equivalent circuit for each pin. The passive circuit equivalent was chosen from a consideration of the typical circuit topology employed within the ECU.
At integrated circuit level, the IBIS (I/0 Buffer Information Specification) modelling approach (3) can be used to represent the Impedances at the pins of an I.C. package. The same generic model is used, regardless of the individual circuit arrangement within a particular I.C. A similar approach one level of integration higher was used here to represent the ECU I/0.
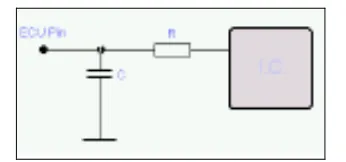
An inspection of the typical design circuitry associated with the pins of the ECU (one level of integration higher than the IC) showed that most had a discrete capacitor connected between ECU pin and RF ground with a series resistor, in order to decouple RF Interference.
Figure 2. Typical ECU input/output circuit
Ultimately, though only certain types of circuit were capable of being represented by the chosen simulation package, M-HARNESS. That necessity meant that although the circuit was characterised as RLC, the resulting model could only be represented as RC or RL (all three elements could not be present together). ZR and ZI represent the real and imaginary parts of the impedance of the RLC circuit (Equations 3 and 4) as shown in Figure 3.
2
The question remains as to whether the impedance for small signal inputs (Implying that semiconductor junctions were not forced into conduction) would offer from the large signal equivalent, although work carried out previously (4) on a whole vehicle had suggested this effect was not visible in the RF induced currents. The two cases of ECU_powered_up and
ECU_powered_down were treated separately here, as both conditions can exist on an operating vehicle (for example. a security system ECU may be powered down when the vehicle is being driven).
Figure 3. Equivalent RLC Circuit employed
Results
Impedance measurements were made on a total of 53 pins (categorised as input or
output pins) on a sing1e ECU, with initially 12V power applied to the ECU and then with the ECU powered down. The real and imaginary components were used to derive best-fit equivalent R,L,C values for the equations (3) and (4) above. A typical graph of measured real impedance value for one pin, compared to the fitted value is shown in Figure 4.
The best fit equivalent R,L,C values recorded for all ECU pins are summarised in Figures 6,7,8 and 9.It can be seen from the Figures 6,7,8 and 9:
1. there appeared to be sub-groups of pins within each category, for example
2. Overall, RC behaviour was much more common than RL or RLC behaviour. This meant that M-HARNESS’ with its limited set of end termination models, could be used to represent the ECU.
Analysing the significance of Parallel Resistor/Capacitor circuit groupings
In order to analyse the significance of the groupings identified above. It is necessary to look at the application of these impedance values to a vehicle wiring system. The impedances from the first part of this work were used to predict RF current pickup on one wire of a simulated vehicle wiring system using the M-HARNESS program.
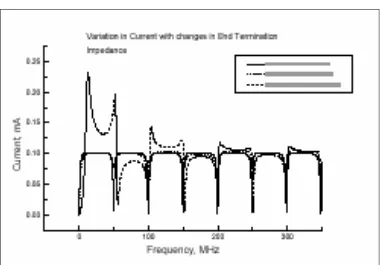
The results described here are based on a simple model with typical geometry of a 3 metre long single conductor above a ground-plane. terminated with a 50Σ resistive load at one end (representing a sensor or actuator) and an RC equivalent circuit terminating the other (representing the impedance of one pin of the ECU). The propagation of the interfering radiation was modelled as occurring from directly above the wire, and was polarised in the direction of the wire’s lenght. The current monitoring point in these experiments was at the end of the wire with the RC termination (at the simulated ECU). The analysis used 50000 timesteps of 0.1ns, and 6cm elements. over a frequency range of 0 to 300MHz.
A total of 120 combinations of R and C values were evaluated, covering the range of values seen from the measurements. For each RC combination, a plot of RF current versus frequency was produced. It was noted that the overall shape of these plots was similar, exhibiting periodic behaviour governed by the resonant length of the wire. In order to obtain a measure of the degree of similarity between plots, a simple measure of area difference between each plot and a designated reference plot was used.
The absolute difference in current is defined here as being equivalent to the total area between the reference trace and the one being tested. The units have a dimension of Amps x Hz.
The results were plotted as a contour map of relative difference in current for selected values of R and C Figure 11 shows the results for l20 values of R and C end termination, with a wire to ground capacitance of 6,6pF/m.
Several contour maps were computed, for 3 different wire/ground capacitances and 3 directions of propogation and polarisation of the incident wave. All showed a similar shape to the above. It can be seen from Figure 11 that for a substantial area of the RC plane, the current is largely insensitive to changes in RC values RC impedances occurring in the high resistance/low capacitance’ corner of the RC plane however will cause marked differences in induced current.
Conclusions
The measurement, characterization and modeling of the impedance values of a typical ECU has been described. The work has given an indication that the circuit function of the pin (input or output)leads to it beining characterized differently and that the impedance values with the ECU powered up differ from those when is powered down. Statistical distributions of values have been described for the cases (input, output / power-up, power-down), which will allow future simulations of harness current absorption to be made.
Figure 4. Typical Measured vs. Modelled impedance
Figure 5. Absolute Difference in Current for various R and C values
References
1. R.I. Nephhytou, A.C. Metaxas, “Caracterisation of frequency heating systems in industry using a network analyzer”, IEE Proc. Sci. Meas. Tecnol., vol.144, No.5, September 1997
2. Hewllett Packard, Application Note 346-33, “Effective Impedance Measurement using Open/Short/Load correction”
3. Syed B. Huq, National Semiconductor Corporation, Appllcation Note 1111, “An Introduction to IBIS S ( I/O Buffer Information Specifcation) Modeling”, June 1998.
4. Paul Jennings, “Achieving Correlation beetween System Level and Whole - Vehicle Radiated Susceptibility Tests”, MPhil Thesis, University of Warwick, February 1992.