www.elsevier.com / locate / livprodsci
Responses to restricted index selection and genetic parameters for
fat androstenone level and sexual maturity status of young boars
a ,
*
a a b cP. Sellier
, P. Le Roy , M.N. Fouilloux , J. Gruand , M. Bonneau
a
´ ´ ´
Institut National de la Recherche Agronomique, Station de Genetique Quantitative et Appliquee, 78350 Jouy-en-Josas, Cedex, France
b
´ ´ ´
Station Experimentale de Selection Porcine, 86480 Rouille, France
c
Station de Recherches Porcines, 35590 L’Hermitage, France
Received 14 December 1998; received in revised form 20 May 1999; accepted 15 June 1999
Abstract
A restricted index selection experiment was conducted over four generations in order to investigate whether it is possible to reduce fat androstenone (AND) level with no adverse effect on sexual maturity status in young boars. Fat AND level was measured on a biopsy sample of backfat taken at 118 kg live weight. Sexual maturity status was assessed by bulbo-urethral gland (BUG) thickness measured by echotomography at 99 kg live weight. The experimental design included a control and a select line having a Large White–Landrace genetic background, and both lines were intended to comprise five sires at each generation. A total of 949 boars were recorded for both index traits throughout the experiment. The pattern of direct responses to this ‘antagonistic’ selection differed from expectation, and consisted of no response in fat AND level and a significant positive genetic trend in BUG development. The reasons for this discrepancy are discussed in terms of selection differential being achieved for each index trait (‘index in retrospect’) and deviations of the estimated (by REML) genetic parameters from the expected ones. Heritability estimates were close to 0.50 for fat AND level and 0.60 for BUG development whereas the genetic correlation among them amounted to about 0.65. Moreover, a significant genetic correlation of 0.30–0.40 was found between the sexual maturation of boars and that of related gilts. 2000 Elsevier Science B.V. All rights reserved.
Keywords: Pig; Intact male; Fat androstenone level; Sexual maturity; Selection experiment
1. Introduction by a third and decreased by a fifth, respectively, in
intact compared to castrated males (Noblet et al., The adverse effects of castration of male pigs 1994). Castration of male piglets may also cause upon growth performance, carcass merit and nitrogen concern in terms of animal welfare. However, raising output have been thoroughly investigated. Lean and intact males for pork production is discouraged in fat tissue growth rates are approximately increased most countries, especially in those having heavier
slaughter weights of market pigs.
The reason is that unpleasant off odors (boar taint) *Corresponding author. Tel.:133-13-465-2189; fax:1
33-13-occur during cooking of meat from a proportion of 465-2210.
E-mail address: [email protected] (P. Sellier) intact males, which makes it unacceptable to many
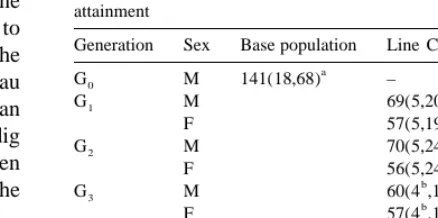
Table 1 ¨
consumers of fresh pork (Malmfors and Lundstrom,
Distribution by line and generation of the boars recorded for both 1983; Diestre et al., 1990; Bonneau et al., 1992).
selection index traits and of the gilts recorded for puberty Along with skatole (3-methylindole), the pheromone attainment
androstenone (5a-androst-16-en-3-one) is known to
Generation Sex Base population Line C Line S be a major chemical compound responsible for the
a
G M 141(18,68) – –
development of boar taint, as reviewed by Bonneau 0
G1 M 69(5,20) 124(5,51)
(1998). This lipophilic C19D16 steroid, having an F 57(5,19) 58(5,40) intense urine-like odor, is synthetized by the Leydig G M 70(5,24) 143(5,57)
2
cells of the testis of sexually mature boars, then F 56(5,24) 60(5,52)
b
released into the blood, and finally stored in the G3 M 60(4 ,16) 130(5,36)
b
F 57(4 ,19) 54(5,36)
adipose tissue (Brooks and Pearson, 1986).
G4 M 69(5,33) 143(5,48)
It was shown by Willeke et al. (1987) and Sellier
F 56(5,33) 57(5,45)
and Bonneau (1988) that downward selection on fat
a
Between brackets, numbers of sires and dams, respectively. androstenone (AND) level in boars can be effective. b
Reproductive failure of one boar. A restricted index selection experiment has been
carried out in order to investigate whether it is
possible to reduce fat AND levels with no unfavor- A particular feature of this experiment lies in the able effect on the sexual maturity status in young mating policy used. In each generation, the selected boars. The development of accessory sex glands sires from both lines were put at the INRA AI center
´
being under the direct control of androgen and in Rouille during a six-week period (March–April), estrogens (Joshi and Raeside, 1973; Booth, 1980), and semen from these boars was utilized at random sexual maturity status was appraised by the bulbo- for insemination of F sows kept in about 15 herds1 urethral gland (BUG) size measured on the live depending on a single breeding scheme. Each sire of animal at a fixed body weight. This article reports on the lines S and C was intended to produce 8–12 and responses to selection and genetic parameters for 4–6 litters, respectively. In each generation, 210– AND and BUG, which were the two component 230 male and 120–130 female offspring, born from traits of the selection index, and for a number of F1 sows in commercial herds, were put on test other male and female traits. contemporarily in the INRA-SESP fattening facilities. So, only the sire-son pathway of gene transmission was exploited for selection, with an
2. Materials and methods expected intensity of selection (i ) close to 2.2 at each
generation in the line S (proportion selected was 5 2.1. Experimental design out of around 135 candidate boars). Due to mating boars to an unselected dam population, the expected A selection experiment was conducted over four cumulative intensity of selection after n generations
n
generations (G –G ) at the INRA-SESP experimen-1 4 was in52i(121 / 2 ) for the sire-son pathway. The tal farm in connection with the INRA-SEIA artificial realized cumulative intensity of selection after four
´
insemination center (Rouille, Vienne, France). From generations amounted to 3.6 for the sire-son path-a foundpath-ation stock (G ), consisting of 141 Lpath-arge0 way, and was therefore slightly less than the ex-White 3 Landrace (F ) intact males sired by 181 pected value of 4.1.
different boars, two lines of boars were established,
namely one line kept as control (C) and one select 2.2. Selection index line (S). Each line was intended to comprise five
sires in each generation (Table 1), with one boar The criterion of selection used in the line S was an generation per year. In the line C, replacement boars index combining the following two traits:
were randomly chosen (one son per sire). In the line
99.162.7 kg body weight (BW). Average age at biopsy of backfat was taken at 99.162.7 kg BW for measurement was 162 days. The phenotypic determination of fat AND level (AND1). The boars correlation of that live thickness measurement not kept for breeding were slaughtered in a commer-with the BUG weight recorded after slaughter a cial abattoir at 122.763.8 kg BW (average age was few days later was 0.86 in a sample of 175 boars 194 days). Male genital tract was removed on the (Sellier et al., 1993). slaughter line for further dissection according to 2. the AND level (AND2) of a small biopsy sample Bonneau and Russeil (1985). Total weight of backfat taken in the neck region at 117.662.4 (WBUG2) and the average length (LBUG2) of kg BW (average age was 185 days). The radioim- bulbo-urethral glands and the total weight of testes munoassay procedure described by Bonneau and (WTES2) were recorded.
Russeil (1985) was used for determination of In female offspring (54–60 gilts per line and AND2 (as mg / g ether extract). A logarithmic generation, Table 1), the daily detection of first transformation was applied owing to the marked oestrus began at 140 days of age and continued until skewness of the frequency distribution of raw they reached either puberty or 115 kg BW. Puberty AND2 data, and the variable included in the was defined as the occurrence of a standing response
2
selection index was LAND25log(AND2310 ). to a teaser boar. Puberal gilts (n5115) were slaug-htered within the 10 days following the first heat in The selection index used in this experiment (I5 order to check the presence of ovarian corpora lutea, 100143TBUG12633LAND2) was constructed and their genital tract was removed on the slaughter with the objective of reducing LAND2 while main- line and then dissected as described by Legault taining a normal sexual maturity status of young (1969). Corpora lutea were counted for assessing boars, i.e. no expected genetic change in weight of ovulation rate. The gilts having not expressed puber-bulbo-urethral glands. A set of phenotypic and ty (n5340) were slaughtered at 116.863.2 kg genetic parameters was derived from earlier studies (average age was 201 days), and were submitted to (Bonneau and Sellier, 1986; Sellier and Bonneau, the same genital tract measurements as the puberal 1988), and it was assumed that heritability was 0.4 gilts. Postmortem examination of ovaries showed for TBUG1 and 0.6 for LAND2, and phenotypic and that neither silent nor false first heats occurred in the genetic correlations between the two traits were 0.5. course of the experiment.
As shown in Table 1, a total of 949 boars, from 57 In an attempt to ascertain whether a non-puberal sires and 353 dams, were recorded for both index gilt was near to her first oestrus, a linear function (L ) traits through the generations G –G .0 4 of four genital tract records (total weight and average length of uterine horns, total weight of ovaries and 2.3. Traits weight of vagina1uterine cervix), which made it possible to completely discriminate puberal and non-Beside TBUG1 and LAND2, a number of traits puberal gilts, was developed by using the procedure were recorded at generations G –G in males and / or1 4 CANDISC of SAS (1989). On the basis of individual females from both lines. Male and female offspring L values, the non-puberal gilts were divided into
entered the INRA-SESP farm at about 25 kg BW. three classes, and an ordered categorical variable They were raised in single-sex pens of ten animals, (GPUBS, ‘gilt puberty status’) was defined as fol-with boars and gilts housed in different open-fronted lows: 1,2,35gilts assumed to be far from, rather buildings. Animals were given ad libitum access to a close to or very close to the first oestrus (25% lower, pelleted grower diet in self-feeders, and average 50% medium or 25% higher L values, respectively), daily gain (ADG) was recorded as the daily BW gain and 45puberal gilts.
from 31.5 to 98.9 kg. Live backfat thickness (BFAT)
was recorded at 98.962.5 kg BW as the average 2.4. Statistical analysis value of six ultrasonic measurements taken on either
calculated from the weighted selection differentials achieved for each of the index traits, the weighting factor being the number of sons recorded per sire.
Direct and correlated responses to selection for male traits, ADG and BFAT were estimated by using the procedure GLM of SAS (1989). The model included the fixed effects of line, generation (year) and line3generation interaction, as well as the fixed effects of sex and sex3line interaction for ADG and BFAT, and a covariate as appropriate (weight on test for ADG and weight at measurement for BFAT and male traits). Data on the proportion of puberal gilts at 116.8 kg BW and the categorical GPUBS variable were analyzed according to Grizzle et al. (1969). Analysis was based on logits using the maximum likelihood method available in the procedure CAT-MOD of SAS (1989).
Variance-covariance components were estimated by using a restricted maximum likelihood (REML) procedure applied to a multivariate individual animal model. The model varied depending on the trait as
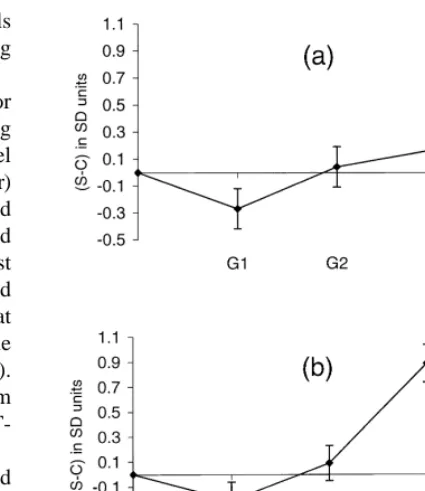
mentioned above, but the basic mixed model in- Fig. 1. Line differences (select–control) across generations in the cluded the fixed effect of generation (year) and the two component traits of the selection index: (a) fat androstenone random effects of litter of birth and additive genetic level at 117.6 kg BW (LAND2); (b) bulbo-urethral gland thick-ness at 99.1 kg BW (TBUG1). Vertical bar5difference6SE; value of the animal. Suitable Box–Cox power
trans-***5P,0.001. formations were performed for fat AND data
(BCAND1 and BCAND2) using the following for-p mula (MacLean et al., 1976): y5(r /p)[(x /r11) 2
1] where y and x are transformed and raw values, and TBUG1. There was no significant change across respectively, r510 and p5 219.3. generations in the difference between select and A series of three- or four-trait analyses were control lines in fat AND level at 117.6 kg BW. In performed using the version 4.2 of theVCEsoftware contrast, a significant increase in the difference package (Neumaier and Groeneveld, 1998). All VCE between select and control lines in average BUG runs comprised the traits TBUG1 and BCAND2 in thickness at 99.1 kg BW occurred, mainly from the order to account for the effects of the selection being third generation of selection. The pattern of direct achieved on these traits (see Hofer, 1998) There responses to selection clearly differed from that were 1935 animals in the pedigree file going back to intended when defining the breeding goal, i.e. reduc-the parents of reduc-the foundation population. Approxi- ing LAND2 while holding TBUG1 constant. One of mate standard errors of estimated genetic parameters the reasons contributing to this unexpected result lies were obtained from an approximation of the Hessian in that the ‘index-in-retrospect’ actually applied in matrix when convergence was reached. each generation (except the first one) gave a higher weighting to TBUG1 than intended, as shown in Table 2. Over the four generations of selection, the
3. Results average realized relative weight of TBUG1
Table 2 Table 4
Coefficients of the ‘indexes in retrospect’ in generations G –G1 4 Line differences across generations in percentage of gilts having
a
(traits expressed in phenotypic SD units) attained puberty prior to 116.8 kg BW
Generation w (TBUG1)1 w (LAND2)2 RRW1 Generation Control Select Significance of the line line line difference
aRRW1 is the realized relative weighting for TBUG1 (absolute 4
value of the ratio of w to w ). The relative weighting for TBUG11 2 **5P,0.01. in the ‘intended’ selection index was 0.76.
2
response to selection was observed for fat AND level in Table 5 for heritabilities (h ) and common litter 2
at 99.1 kg BW (LAND1). A significant positive trend environment effects (c ), and in Table 6 for pheno-occurred in line S for BUG weight at 122.7 kg BW typic (r ) and genetic (r ) correlations.P A
(WBUG2), and was similar to that displayed by The traits BCAND2 and TBUG1 showed similar BUG size at 99.1 kg BW (TBUG1). Weight of testes heritabilities, a positive phenotypic correlation, and a 2 at 122.7 kg BW (WTES2) was consistently greater in close genetic correlation of 0.6660.06. The h the select than in the control line through the estimate for BCAND1 did not differ from that for generations G –G , but the line difference was1 4 BCAND2, and the two traits were closely correlated significant only at generation G .3 both at the phenotypic and genetic levels. Similarly,
The overall proportion of gilts having shown first
oestrus prior to 116.8 kg BW was 0.25 in this Table 5
2
experiment. The proportion of puberal gilts was Estimates of heritabilities (h ) and common litter environment
2
higher whatever the generation in line S compared to effects (c ) for fat androstenone levels (BCAND1, BCAND2), male genital tract measurements (TBUG1, LBUG2, WBUG2, line C (0.35 vs. 0.16, on average), and the line
WTES2), gilt puberty status (GPUBS), average daily gain (ADG) difference in this trait was significant at generations
and backfat thickness (BFAT) G and G (Table 4). Regarding the ovulation rate at2 3
2 2
Trait No. of records h6SE c6SE the pubertal oestrus, line S (14.260.3, n579) did
a
not significantly differ from line C (14.760.4, n5 BCAND1 845 0.4960.06 0.0860.02 BCAND2 949 0.5560.05 0.0260.01 36) whatever the generation.
TBUG1 999 0.6360.06 0.0460.02 There were no significant correlated responses to a
LBUG2 746 0.3360.04 0.1260.01 selection in ADG and BFAT (results not shown). a
WBUG2 746 0.5560.04 0.0460.01
a
WTES2 743 0.6160.04 0.0460.01 3.2. Estimated genetic parameters GPUBS 455 0.5360.10 0.0760.06 ADG 1454 0.3460.04 0.1760.03 nine traits recorded in this experiment are presented 0
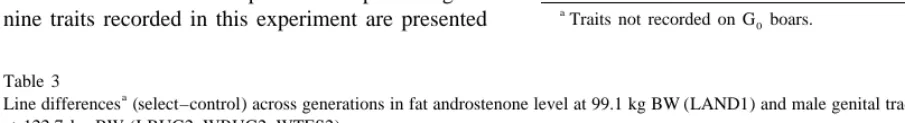
Table 3
a
Line differences (select–control) across generations in fat androstenone level at 99.1 kg BW (LAND1) and male genital tract measurements at 122.7 kg BW (LBUG2, WBUG2, WTES2)
Generation LAND1 LBUG2 WBUG2 WTES2
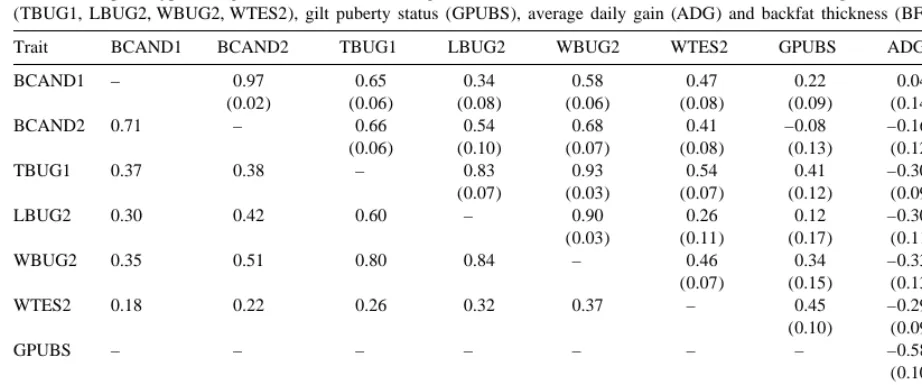
Table 6
a
Estimates of phenotypic and genetic correlations among fat androstenone levels (BCAND1, BCAND2), male genital tract measurements (TBUG1, LBUG2, WBUG2, WTES2), gilt puberty status (GPUBS), average daily gain (ADG) and backfat thickness (BFAT)
Trait BCAND1 BCAND2 TBUG1 LBUG2 WBUG2 WTES2 GPUBS ADG BFAT
BCAND1 – 0.97 0.65 0.34 0.58 0.47 0.22 0.04 0.11
(0.02) (0.06) (0.08) (0.06) (0.08) (0.09) (0.14) (0.12)
BCAND2 0.71 – 0.66 0.54 0.68 0.41 –0.08 –0.16 0.11
(0.06) (0.10) (0.07) (0.08) (0.13) (0.12) (0.09)
TBUG1 0.37 0.38 – 0.83 0.93 0.54 0.41 –0.30 –0.07
(0.07) (0.03) (0.07) (0.12) (0.09) (0.08)
LBUG2 0.30 0.42 0.60 – 0.90 0.26 0.12 –0.30 –0.23
(0.03) (0.11) (0.17) (0.11) (0.15)
WBUG2 0.35 0.51 0.80 0.84 – 0.46 0.34 –0.33 –0.14
(0.07) (0.15) (0.13) (0.13)
WTES2 0.18 0.22 0.26 0.32 0.37 – 0.45 –0.29 –0.34
(0.10) (0.09) (0.11)
GPUBS – – – – – – – –0.58 0.02
(0.10) (0.09)
ADG 0.13 20.06 20.16 20.15 20.22 20.13 20.16 – –0.16
(0.12)
BFAT 0.12 0.18 20.19 20.10 20.13 20.12 0.04 0.29 –
a
Phenotypic correlations below the diagonal, genetic correlations (SE between brackets) above the diagonal.
2
the h estimates for WBUG2 and TBUG1 were of ment comprised a control line, a line selected for low the same order and the two traits were highly fat AND level and small testis size (‘agonistic’ correlated. Heritability of testes weight (WTES2) selection), and a line selected for low fat AND level was similar to that of WBUG2, whereas the genetic and large testis size (‘antagonistic’ selection). The association of WTES2 with BUG size measurements responses found in the latter line, i.e. a significant was of medium magnitude. The genetic correlation decline of fat AND level and no genetic change in of fat AND level (BCAND1 or BCAND2) with weights of testes and bulbo-urethral glands, sug-BUG size (Tsug-BUG1 or Wsug-BUG2) was of the same gested that it would be feasible by breeding to reduce order whatever the respective stages of measurement fat AND level without adversely affecting sexual
2
of the two traits. The h estimate for gilt puberty maturity status in boars. The study reported here was status (GPUBS) was about 0.50, and this trait designed for confirming this finding over a greater showed positive genetic correlations with TBUG1, number of generations of selection while replacing WBUG2 and WTES2. There was a significant nega- testis size by the development of accessory sex tive genetic relationship between GPUBS and ADG. glands (BUG) for appraising the stage of sexual The phenotypic and genetic correlations of fat AND maturation attained by young boars at a fixed body levels with ADG and BFAT were of small mag- weight.
nitude. The two latter traits showed moderate
nega-tive genetic correlations with male genital tract 4.1. Responses to selection measurements.
4.1.1. Direct responses
Using a restricted selection index has resulted in
4. Discussion realized genetic trends for each component trait
showed both significant changes in the trait selected with Large White purebred boars. This has resulted for and no or little change in the restricted trait (e.g. in a relatively small selection pressure on this trait, Atchley et al., 1997). However, there are several except in the first generation.
studies in which unintended responses in the
com-ponent traits of the restricted selection index 4.1.2. Correlated responses
occurred (for references, see Eisen, 1992). The The trends found in the select line for fat andros-present experiment exemplifies a typical case, i.e. the tenone level and bulbo-urethral gland development trait selected downward (AND) did not noticeably were similar for both stages of measurement, in change while the restricted trait (BUG size) showed agreement with the very high genetic correlations a significant positive response to selection. between homologous traits. The correlated response Restricted index selection appears to be very observed in females of the select line, i.e. an sensitive to the degree of accordance of expected increased percentage of gilts showing first oestrus with true genetic parameters involved in the selection prior to 116.8 kg BW, is in line with the earlier index. Here, the genetic parameters as estimated by a sexual maturity of the males of this line (as demon-REML analysis of data from the whole experiment strated by the greater development of BUG). This somewhat differed from those inferred for construct- suggests that, provided that the weightings of ing the selection index. In particular, the REML- TBUG1 and LAND2 are correctly balanced in the estimated heritability of TBUG1 was noticeably selection index (see above), it is probably possible to
2
higher than the expected one (h 50.63 vs. 0.40), reduce fat androstenone levels with no adverse effect which has ‘favoured’ the response in this trait in on sexual maturity of both males and females by comparison with LAND2. In addition, the two index using BUG development as an estimate of sexual traits were revealed as exhibiting a slightly closer maturity status. On the contrary, selection against genetic correlation than expected (0.66 vs. 0.50). androstenone with no consideration of sexual de-This discrepancy between expected and true values velopment (Willeke et al., 1987) or using testes of genetic correlation is likely to have reduced the development as an estimate of sexual maturity status negative response in LAND2 due to a larger than (Sellier and Bonneau, 1988) resulted in a delay in expected counteracting effect of the upward selection the sexual maturity of related females.
pressure achieved on TBUG1. Given the
REML-estimated genetic parameters of the two index traits, 4.2. Genetic parameters the selection index to be used should have put less
emphasis on TBUG1 for having an effective restric- 4.2.1. Fat androstenone level
tion of zero genetic gain in bulbo-urethral gland Regarding fat AND level, the genetic parameters development. estimated in the present study are in general agree-As already mentioned, another factor which has ment with those published earlier (Jonsson and probably contributed to the unexpected responses in Andresen, 1979; Bonneau and Sellier, 1986; Willeke the index traits refers to the realized selection et al., 1987; Sellier and Bonneau, 1988; Willeke and
2
4.2.2. Sexual maturity of boars androgens and oestrogens, the latter two being Among the genital tract measurements utilized for responsible for the development of bulbo-urethral assessing sexual maturation in young boars, testis glands (Joshi and Raeside, 1973; Booth, 1980). size has been by far the most studied on genetic
grounds (e.g. Legault et al., 1979; Toelle et al., 1984; 4.2.4. Puberty in females 2
Sellier and Bonneau, 1988; Johnson et al., 1994). The current h estimate of 0.53 for the gilt puberty 2 Our heritability estimate for testes weight falls within status variable is in the range of the h values the range of values previously published for various previously found for the age at puberty of gilts, traits pertaining to testicular development at fixed while being noticeably higher than the average body weights or, most often, at fixed ages. It is, literature value of 0.33 quoted by Rothschild and however, well above the average literature values of Bidanel (1998). It should however be noted that 0.33–0.44 quoted by Rothschild and Bidanel (1998) heritability was higher for weight than for age at for heritability of testis width, length or weight. The puberty (0.51 vs. 0.29) in the study of Bidanel et al. same authors concluded from their literature review (1996). A close negative genetic correlation was that a positive genetic correlation of about 0.50 found in the present study between ADG and exists between ADG and testis size when the latter GPUBS. This result agrees with the finding by trait is measured at constant age, whereas available Bidanel et al. (1996) of a moderate positive genetic results are more discordant when testis size is association of growth rate with weight at puberty in measured at constant weight. In the present study, all gilts. The genetic independence found here between male genital tract measurements (performed at fixed backfat thickness and gilt puberty status is in line BW) exhibited a moderate negative genetic associa- with average literature results (Rothschild and tion with ADG. Sexual maturation of the young boar Bidanel, 1998).
therefore appears to be differently associated with
growth rate depending on whether it is assessed at 4.2.5. Genetic association of male with female constant age or at constant weight. Regarding the puberty traits
genetic relationship of testis size with backfat thick- Fat AND levels in boars were poorly genetically ness, our study showed a moderate negative correla- linked with gilt puberty status in the present study. tion between the two traits. This result is in line with As already mentioned, the studies of Willeke et al. that of Toelle et al. (1984), but not with the very low (1987) and Sellier and Bonneau (1988) concurred to or slightly positive genetic correlations reported by show a markedly positive genetic association among Young et al. (1986), Lubritz et al. (1991) and the fat AND level in young boars and sexual Johnson et al. (1994). precocity in gilts. The genetic relationship between sexes for attainment of puberty was found to be near 4.2.3. Association of fat androstenone level with zero in some studies (Schinckel et al., 1983; Sellier
sexual maturity of boars and Bonneau, 1988; Johnson et al., 1994), but it was
The close genetic relationship found here between positive in other studies (Bates et al., 1986; Young et fat AND level and BUG or testis size confirms the al., 1986). The present experiment shows a signifi-previous findings of Bonneau and Sellier (1986) and cant genetic correlation of 0.30–0.40 between sexual Sellier and Bonneau (1988). One may put forward maturation of males, as assessed by the development that the genetic correlation of fat AND level with the of testes and accessory sex glands at constant BW, sexual maturity status of the boar is equal or superior and sexual maturation of females, as assessed by the to 0.50. Highly significant phenotypic correlations, categorical ‘gilt puberty status’ variable.
ranging from 0.30 to 0.70, have been repeatedly reported among the same traits (e.g. Forland et al.,
1980; Bonneau and Russeil, 1985; Xue et al., 1996; 5. Conclusion
Andersson et al., 1997). These correlations result
Bonneau, M., Russeil, P., 1985. The use of Cowper’s (bulbo-development of bulbo-urethral glands. The latter trait
urethral) glands as an estimate of boar taint on the slaughter showed a higher heritability value than that assumed
line. Livest. Prod. Sci. 13, 169–178.
for constructing the restricted selection index used Bonneau, M., Sellier, P., 1986. Fat androstenone content and throughout the experiment. This feature partly ex- development of genital system in young Large White boars:
genetic aspects. World Rev. Anim. Prod. 22, 27–30. plains that the pattern of direct responses to selection
Bonneau, M., Le Denmat, M., Vaudelet, J.C., Veloso-Nunes, J.R., differed from expectation. Another reason lies in that
Mortensen, A.B., Mortensen, H.P., 1992. Contributions of fat the average weighting given to bulbo-urethral gland androstenone and skatole to boar taint. I. Sensory attributes of development in the selection actually performed was fat and pork meat. Livest. Prod. Sci. 32, 63–80.
higher than expected. Moreover, the present study Booth, W.D., 1980. A study of some major testicular steroids in the pig in relation to their effect on the development of male gave evidence for a significant genetic relationship
characteristics in the prepubertally castrated boar. J. Reprod. between sexes with respect to sexual maturation, as
Fert. 59, 155–162.
shown by the REML estimate of genetic correlation Brooks, R.I., Pearson, A.M., 1986. Steroid hormone pathways in and the similar genetic trends for sexual maturity the pig, with special emphasis on boar odor: a review. J. Anim. status of boars and gilts. Sci. 62, 632–645.
Diestre, A., Oliver, M.A., Gispert, M., Arpa, I., Arnau, J., 1990. Consumer responses to fresh meat and meat products from barrows and boars with different levels of boar taint. Anim.
Acknowledgements Prod. 50, 519–530.
Eisen, E.J., 1992. Restricted index selection in mice designed to change body fat without changing body weight: direct re-The authors express sincere thanks to M.
Bernar-sponses. Theoret. Appl. Genet. 83, 973–980. din and H. Bernardin (INRA-SESP), F. Bariteau and
¨
Forland, D.M., Lundstrom, K., Andresen, O., 1980. Relationship `
J. Bussiere (INRA-SEIA), J. Portanguen and F. between androstenone content in fat, intensity of boar taint and Giovanni (INRA-SRP), and M. Burnet and H. size of accessory sex glands in boars. Nord. Vet.-Med. 32, Lagant (INRA-SGQA) for their efficient contribution 201–206.
Grizzle, J.E., Starmer, C.F., Koch, G.G., 1969. Analysis of to the study. This experiment was supported by
categorical data by linear models. Biometrics 25, 489–504. ´ ´ ´
grants from AIP ‘Constitution de lignees
genetique-Hofer, A., 1998. Variance component estimation in animal breed-´
ment interessantes’ and INRA ‘Direction Scientifique ing: a review. J. Anim. Breed. Genet. 115, 247–265. des Productions Animales’. Referees are acknowl- Johnson, R.K., Eckardt, G.R., Rathje, T.A., Drudik, D.K., 1994. edged for their valuable comments. Ten generations of selection for predicted weight of testes in swine: direct response and correlated response in body weight, backfat, age at puberty and ovulation rate. J. Anim. Sci. 72, 1978–1988.
References Jonsson, P., Andresen, O., 1979. Experience during two
genera-tions of within lines performance testing, using 5a -androst-16-¨
Andersson, K., Hullberg, A., Malmgrem, L., Lundstrom, K., ene-3-one (5a-androstenone) and an olfactory judgement of ´ ´ ´
Squires, J., Rydhmer, L., 1997. Relations between boar taint boar taint. Ann. Genet. Sel. Anim. 11, 241–250. ¨
and puberty in entire male pigs. In: Bonneau, M., Lundstrom, Joshi, H.S., Raeside, J.I., 1973. Synergistic effects of testosterone K., Malmfors, B. (Eds.), Boar Taint in Entire Male Pigs. EAAP and oestrogens on accessory sex glands and sexual behaviour Publication No. 92, pp. 70–73. of the boar. J. Reprod. Fert. 33, 411–423.
´ ´ `
Atchley, W.R., Xu, S., Cowley, D.E., 1997. Altering developmen- Legault, C., 1969. Aspects genetiques de l’aptitude a la reproduc-´
tal trajectories in mice by restricted index selection. Genetics tion des jeunes truies. Journees Rech. Porcine en France 1,
146, 629–640. 13–17.
´ ˆ Bates, R.O., Buchanan, D.S., Johnson, R.K., Wettemann, R.P., Legault, C., Gruand, J., Oulion, F., 1979. Mise au point et interet
´ ´ ´ ´
Fent, R.W., Hutchens, L.K., 1986. Genetic parameter estimates genetique d’une methode d’appreciation sur le vivant du poids ´
for reproductive traits of male and female littermate swine. J. des testicules chez le jeune verrat. Journees Rech. Porcine en
Anim. Sci. 63, 377–385. France 11, 313–322.
Berger, P.J., Harvey, W.R., 1975. Realized genetic parameters Lubritz, D., Johnson, B., Robison, O.W., 1991. Genetic parameters from index selection in mice. J. Anim. Sci. 40, 38–47. for testosterone production in boars. J. Anim. Sci. 69, 3220– Bidanel, J.P., Gruand, J., Legault, C., 1996. Genetic variability of 3224.
age and weight at puberty, ovulation rate and embryo survival MacLean, C.J., Morton, N.E., Elston, R.C., Yee, S., 1976. Skew-in gilts and relations with production traits. Genet. Sel. Evol. ness in commingled distributions. Biometrics 32, 695–699.
¨
28, 103–115. Malmfors, B., Lundstrom, K., 1983. Consumer reactions to boar Bonneau, M., 1998. Use of entire males for pig meat in the meat: a review. Livest. Prod. Sci. 10, 187–196.
likeli-hood estimation of covariances in sparse linear models. Genet. selection experiment based on an index associating fat andros-Sel. Evol. 30, 3–26. tenone level and bulbo-urethral gland size. In: Bonneau, M. Noblet, J., Karege, C., Dubois, S., 1994. Prise en compte de la (Ed.), Measurement and Prevention of Boar Taint in Entire
´ ´
variabilite de la composition corporelle pour la prevision du Male Pigs. INRA Editions, Paris, France, pp. 173–178, Les
´ ´ ´
besoin energetique et de l’efficacite alimentaire chez le porc en Colloques No. 60. ´
croissance. Journees Rech. Porcine en France 26, 267–276. Toelle, V.D., Johnson, B.H., Robison, O.W., 1984. Genetic parame-Rothschild, M.F., Bidanel, J.P., 1998. Biology and genetics of ters for testes traits in swine. J. Anim. Sci. 59, 967–973.
¨
reproduction. In: Rothschild, M.F., Ruvinski, A. (Eds.), The Willeke, H., Claus, R., Muller, E., Pirchner, F., Karg, H., 1987. Genetics of the Pig. CAB International, Wallingford, Oxon, Selection for high and low level of 5a-androst-16-en-3-one in UK, pp. 313–343. boars. I. Direct and correlated response of endocrinological
SAS, 1989. SAS / STAT User’s Guide, Version 6, 4th ed. SAS traits. J. Anim. Breed. Genet. 104, 64–76.
Institute Inc., Cary, NC, USA. Willeke, H., Pirchner, F., 1989. Selection for high and low level of Schinckel, A., Johnson, R.K., Pumfrey, R.A., Zimmerman, D.R., 5a-androst-16-en-3-one in boars. II. Correlations between 1983. Testicular growth in boars of different genetic lines and growth traits and 5a-androstenone. J. Anim. Breed. Genet. 106, its relationship to reproductive performance. J. Anim. Sci. 56, 312–317.
1065–1076. Xue, J.L., Dial, G.D., Holton, E.E., Vickers, Z., Squires, E.J., Lou, Sellier, P., 1998. Genetics of meat and carcass traits. In: Y., Godbout, D., Morel, N., 1996. Breed differences in boar Rothschild, M.F., Ruvinsky, A. (Eds.), The Genetics of the Pig. taint: relationship between tissue levels of boar taint com-CAB International, Wallingford, Oxon, UK, pp. 463–510. pounds and sensory analysis of taint. J. Anim. Sci. 74, 2170– Sellier, P., Bonneau, M., 1988. Genetic relationships between fat 2177.