National Risk
and
Vulnerability Assessment
2007/8
A proile of Afghanistan
European
Union
“This publication has been produced with the assistance of the European Union. The contents of this publication is the sole responsibility of ICON-INSTITUTE and can in no way be taken to reflect the views of the European Union.” For further information please contact the Delegation of the European Commission to Afghanistan, or
ICON-INSTITUTE www.icon-institute.de [email protected]
Designed by: Mohammad Ashraf Abdullah COPHEN ADVERTISING
www.cophenadvertising.af
Acknowledgement
The National Risk and Vulnerability Assessment (NRVA), financially supported by the European Commission (EC) by the National Surveillance System (NSS) project, spanned almost 5 years in which two publications were released; NRVA 2005 and now this NRVA 2007/8. Although both surveys were managed by the same project team, over time people and conditions changed compared to the set-up as referred to in the NRVA 2005 publication’s acknowledgements.
It is indisputable that without the European Commission’s sustainable financial support for the Technical Assistance component, the food security monitor initially set in 2003 up by the World Food Programme (WFP) and the Ministry of Rural Rehabilitation and Development (MRRD) would not have developed into the NRVA as it stands today. Due to the unanticipated additional request from the Afghan government and other stakeholders to give the survey a 12 months rolling format, the project needed extension buy one year, which was also generously financed by the EC. In addition, the EC has taken a major share in financing the actual field data collection to which also UN’s WFP, UNICEF, the World Bank (WB), the Asia Development Bank (ADB) and UK’s Department of International Development (DFID) contributed.
The NRVA 2007/8, in contrast to its predecessors, developed into the only nation-wide (year round monthly rotating) multi-purpose household survey, enabling the calculation of practically all expected and reasonable cross cutting indicators. This unique (one off) survey format has also been far more expensive than initially budgeted for. Without the generous contributions of these donors, that would not have been possible.
In addition where required, valuable advice, technical assistance and specific training was provided by the WB. In particular, its considerable analytical and methodological contribution helping to design the harmonised poverty estimations and food security indicators has been greatly appreciated.
The NSS/NRVA project team consisted of a “joint venture” between the Vulnerability Analysis Unit (VAU) within the Ministry of Rehabilitation and Rural Development and the Central Statistics Organisation (CSO), completed by two national consultants (Mr. Amanullah Assil and Mr. Tariq Wardak), without whom this long lasting and ground-braking project would hardly have been possible. The project team was supervised by an international team leader.
Over the almost 5-year period, staff turnover, both national and international, has been inevitable. With joint efforts and full support of MRRD, CSO and the EC as contracting authority, these drawbacks have been adequately compensated and resolved. In particular, a large part of the project’s success can be attributed to those national team members that did not leave the project. With their experience gained over time, they have become the trainers of the “newcomers” and proven that sustainable capacity building, one of the project objectives, pays out. Due to their commitment and determination could also another main project objective be accomplished; the production of this NRVA 2007/8 publication,
A project of this nature and magnitude is hardly possible without qualified international consultants and fortunately, have there been many. They deserve praise for their sustainable support and commitment often under very difficult circumstances; security, work conditions and climate wise. Nevertheless, hardly any of our international team members has seen this as a motive to leave the project, which is highly appreciated by the national team members.
This project and Afghanistan can be particular proud of the team of enumerators, supervisors and regional coordinators. Thanks to their creativity did they manage to get access to practically all selected households and stay out of the hands of insurgents and other violent situations, while collecting high quality data for which they deserve every respect. Unfortunately, this could not prevent a kidnapping (with a happy end), various looting, frostbite and a fatal road accidents.
Although nobody is irreplaceable, without all 21,000 households there would not be a NRVA 2007/8 publication. Without exception they have kindly hosted the enumerators and dedicated hours of their time to fill in the extensive and exhaustive questionnaires,.
Finally, a special word of thanks must be addressed to Mr. Christian Boese, former managing director of ASA-Institut, the company responsible for the TA component of the NRVA 2007/8 project who has been during most of the project the driving force behind it.
From this place, we as ASA wish to the Afghan nation all the best and hope that the results of this project will provide the government of Afghanistan the tools to adequately develop and evaluate policies that enhance the living conditions of the Afghan people in the coming years.
Kabul, October, 2009
Peter Pauli, Team leader NSS/NRVA 2007/8
Key indicators
A. MDG Indicators
1Goal 1: Eradicate extreme poverty and hunger
1.2 Poverty gap ratio 7.9
1.3 Share of poorest quintile in national consumption 9.1
1.5 Employment-to-population ratio; (male, female), both sexes (79.8, 43.2) 61.9
1.7 Proportion of own-account and contributing family workers in total employment
2
; (male, female), both sexes
(67.3, 95.2) 76.9
Goal 2: Achieve universal primary education
2.1 Net enrolment ratio in primary education; (boys, girls), both sexes (60.4, 42.1) 51.7
2.3 Literacy rate of 15-24 year-olds; (male, female), both sexes (52.9, 23.9) 39.0
Goal 3: Promote gender equality and empower women
3.1 Ratios of girls to boys in primary, secondary and tertiary education 69.0, 48.8, 28.0
3.2 Share of women in wage employment in the non-agricultural sector 8.0
10 The ratio of literate women to men, 15–24 years old; (urban, rural, Kuchi), national (70.9, 30.8, 39.1) 45.1
Goal 4: Reduce child mortality
4.1 Under-five mortality rate 161
4.2 Infant mortality rate 111
4.3 Proportion of 1 year-old children immunised against measles; (urban, rural, Kuchi), national (73.1, 54.4, 23.9) 55.9
Goal 5: Improve maternal health
5.2 Proportion of births attended by skilled health personnel; (urban, rural, Kuchi), national (69.3, 14.5, 8.0) 23.9
5.3 Contraceptive prevalence rate (modern and traditional methods) 22.8
5.4 Adolescent birth rate 122
5.5 Antenatal care coverage (at least one visit); (urban, rural, Kuchi), national (71.0, 29.9, 17.5) 36.5
Total Fertility Rate; (urban, rural, Kuchi), national (5.25, 6.49, 7.28) 6.27
Goal 7: Ensure environmental sustainability
29 Proportion of population using solid fuels; (urban, rural, Kuchi), national (32.0, 95.7, 98.5) 83.2
7.8 Proportion of population using an improved drinking water source;(urban, rural, Kuchi), national (58.1, 19.8, 15.7) 27.2
7.9 Proportion of population using an improved sanitation facility; (urban, rural, Kuchi), national (20.8, 1.3, 0.0) 5.1
7.10 Proportion of urban population living in slums 92.8
32 Proportion of households with secure tenure 56.2
Goal 8: Develop a global partnership for development
8.14 Telephone lines per 100 population; (urban, rural, Kuchi), national (0.5, 0.0, 0.0) 0.1
8.15 Cellular subscribers per 100 population; (urban, rural, Kuchi), national (16.5, 3.3, 2.4) 5.8
8.16 Internet users per 100 population; (urban, rural, Kuchi), national (1.1, 0.1, 0.0) 0.3
_________________________________________________________
1 The Millennium Development Goals and targets come from the Millennium Declaration, signed by 189 countries, including 147 heads of State and Government,
in September 2000 and from further agreement by member states at the 2005 World Summit (Resolution adopted by the General Assembly - A/RES/60/1).
2 The figure would be 99 percent if day labourers are included in addition to own-account and contributing family workers. These would qualify for the purpose of
B. Other Indicators
Demography
Percentage of population under 15; (urban, rural, Kuchi), national (43.7, 49.7, 51.1) 48.6
Sex ratio; (urban, rural, Kuchi), national (102, 105, 109) 105
Total Fertility Rate; (urban, rural, Kuchi), national (5.25 , 6.49, 7.28, 6.27) 6.27
Dependency ratio; (urban, rural, Kuchi), national (96, 118, 126) 113
Mean age at first marriage, women 17.9
Labour force
Labour force participation rate (male, female), both sexes (85.7, 46.7) 66.6
Unemployment rate (male, female), both sexes (6.9, 7.4) 7.1
Percentage of children performing child labour (boys, girls), both sexes (16.9, 9.1) 13.2
Agriculture
Proportion of households with access to land; (urban, rural, Kuchi), national (10.0, 69.2, 19.2) 54.6 Proportion of households with access to irrigated land; (urban, rural, Kuchi), national (4.4, 52.1, 12.2) 40.4 Proportion of households with access to rain-fed land; (urban, rural, Kuchi), national (1.9, 21.9, 7.8) 17.2 Proportion of households with garden plot; (urban, rural, Kuchi), national (2.8, 13.5, 3.5) 10.8 Proportion of households with livestock; (urban, rural, Kuchi), national (17.8, 79.1, 94.2) 67.8 Proportion of households with major livestock; (urban, rural, Kuchi), national (47.8, 93.8, 98.9) 91.8 Proportion of households with poultry; (urban, rural, Kuchi), national (77.9, 77.2, 60.1) 75.9
Poverty and equality
Poverty headcount rate; (urban, rural, Kuchi), national (29.1, 36.4, 54.3) 36.0
Gini Index 29
National average poverty line (in Afs. per person per month) 1,255
Education
Literacy rate, population aged 15 years and over; (male, female), both sexes (39.3, 12.5) 26.2
Net secondary enrolment ratio; (boys, girls), both sexes (21.5, 10.3) 16.2
Health
Proportion of population within one hour walking distance from a public health facility; (urban, rural, Kuchi),
national (78.5, 53.8, 37.1) 57.4
Proportion of children aged 12-23 months with full immunization; (urban, rural, Kuchi), national (62.8, 33.3, 13.0) 37.2 Contraceptive prevalence rate (modern methods only); (urban, rural, Kuchi), national (28.3, 13.0, 4.8) 15.2
Disability prevalence; (male, female), both sexes (1.9, 1.4) 1.6
Infrastructure
Table of contents
Acknowledgements i
Key indicators iii
Table of contents v
List of tables viii
List of figures xii
List of text boxes xiv
Abbreviations xvi
Executive summary xviii
1 Introduction 1
2 Methodological backgrounds of NRVA 2007/8 3
2.1 Lead-up to the NRVA 2007/8 3
2.2 NRVA 2007/8 methodology 4
2.2.1 Stakeholder involvement and questionnaire design 4
2.2.2 Sampling design 4
2.2.3 Questionnaire contents and interviews 4
2.2.4 Comparability of NRVA 2007/8 with previous rounds 5
2.2.5 Data limitations 7
3 Population structure and change 9
3.1 Introduction 9
3.2 Population and distribution 10
3.2.1 General population characteristics 10
3.2.2 Geographic distribution 11
3.3 Household structure and marriage patterns 12
3.3.1 Household structure 12
3.3.2 Marriage patterns 13
3.4 Fertility and mortality 15
3.4.1 Total Fertility Rate 15
3.4.2 Child mortality estimates 17
3.5 Migration 19
3.5.1 General migration 19
3.5.2 Security and returnees 21
3.6 Conclusions 23
4 Labour force characteristics 25
4.1 Introduction 25
4.2 Labour force, employment and unemployment 25
4.2.1 Labour force participation 26
4.2.2 Employment and unemployment 28
4.3 Characteristics of employment 31
4.3.1 Status in employment 31
4.3.2 Industry and occupation 32
4.3.3 Working hours 33
4.4 Children and work 33
4.5.1 In-migration 35
4.5.2 Out-migration 36
4.5.3 Seasonal migration 37
4.6 Conclusions 38
5 The agricultural sector 40
5.1 Introduction 40
5.2 Access to land 41
5.2.1 Irrigated land 42
5.2.2 Rain-fed land 44
5.2.3 Garden plots 45
5.3 Agricultural production 46
5.3.1 Crop production 46
5.3.2 Livestock 47
5.4 Agriculture inputs 50
5.4.1 Traction for cultivating land 50
5.4.2 Use of fertilizers and pesticides 50
5.5 Agriculture constraints 51
5.5.1 Reasons for not cultivating land 51
5.5.2 Use of extension services 52
5.5.3 Community accessibility 52
5.6 Conclusions 53
6 Poverty incidence and poverty profiling 54
6.1 Introduction 54
6.2 Conceptualization of poverty 55
6.3 Poverty across space and time 55
6.4 Equality in consumption expenditure 57
6.5 Profiling the poor 58
6.5.1 Household size and composition 58
6.5.2 Characteristics of the head of household 59
6.5.3 Characteristics of household members 61
6.5.4 Access to land and services 63
6.6 Conclusions 64
7 Education 65
7.1 Introduction 65
7.2 Literacy 65
7.3 Participation in school 68
7.4 Educational attainment 71
7.5 Conclusions 71
8 Health 73
8.1 Introduction 73
8.2 Access to health services 73
8.2.1 Travel time and travel costs 74
8.2.2 Impeded access for women 76
8.3 Child health 77
8.3.1 Supplementation of micro-nutrients 77
8.3.3 Child feeding patterns 80
8.4 Reproductive health 82
8.4.1 Current use of family planning methods 83
8.4.2 Access to maternal health care 84
8.4.3 Fertility and pregnancy patterns 85
8.5 Disability 87
8.5.1 Conceptualisation and analysis of disability 87
8.5.2 The distribution of the disabled population 88
8.5.3 Causes and consequences of disability 88
8.6 Conclusions 90
9 Housing 92
9.1 Introduction 92
9.2 Housing ownership and characteristics 92
9.2.1 Housing type and ownership 92
9.2.2 Housing characteristics 94
9.3 Housing facilities 95
9.3.1 Water and sanitation 95
9.3.2 Other facilities 97
9.4 Conclusions 98
10 Position of women 99
10.1 Introduction 99
10.2 The position of women in decision making 100
10.2.1 Household decision making 100
10.2.2 Community decision making 102
10.3 Women in Afghan society 103
10.3.1 The face of women in population and marriage 103
10.3.2 Women on the labour market 105
10.3.3 Educational disparities 106
10.3.4 Health conditions 106
10.3.5 Decision-making 107
10.4 Conclusions 107
11 Household shocks and community preferences 109
11.1 Introduction 109
11.2 Household shocks and coping strategies 109
11.3 Community preferences 113
11.4 Conclusions 114
Annexes
Annex I List of NRVA staff 117
Annex II Sampling methodology 118
Annex III Estimation of Total Fertility Rate 126
Annex IV Estimation of infant- and under-five mortality rates 129
Annex V Measurement of poverty 134
Annex VI Methodological issues in the estimation of reproductive and child health indicators 150
Glossary 152
List of tables
Table 2.1 Sections and section topics of the NRVA 2007/8 questionnaire 5
Table 2.2 Male and female Shura questionnaire topics 5
Table 2.3 Comparison of NRVA 2003, 2005 and 2007/8 6
Table 3.1 Population, by sex, and by age; also stating sex ratio, by age 11
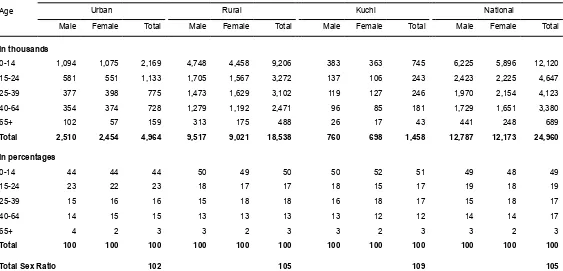
Table 3.2 Population, by residence, sex, and by age; also stating total sex ratio 11
Table 3.3 Household structure indicators, by residence 12
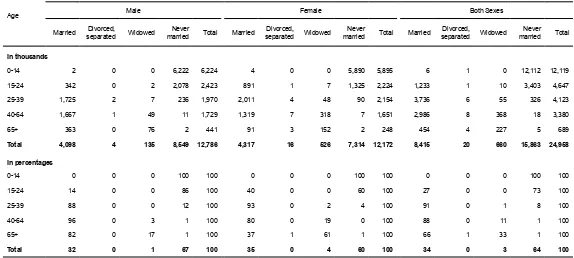
Table 3.4 Population, by sex, marital status, and by age 14
Table 3.5 Fertility estimates 16
Table 3.6 Total Fertility Rate, by a. residence, b. educational level of mother 17
Table 3.7 Child mortality estimates, by sex 18
Table 3.8 Households, by migration status during past five years, and by current residence 19
Table 3.9 Population, by migration experience during past five years, and by sex 19
Table 3.10 Place of origin of in-migrants and place of destination of out-migrants 20
Table 3.11 Percentage distribution of population, by migration experience, and by sex, age 21
Table 3.12 Households returned from displacement, by current residence 22
Table 3.13 Households with in-migrants (past 5 years) and out-migrants (past year) respectively, who left for reasons of security/protection
22
Table 3.14 Place of origin/destination of security seekers 23
Table 4.1 Working-age population, by residence, sex, and by activity status, age 26
Table 4.2 Employment-to-population ratio and unemployment rate, by sex, and by residence 29
Table 4.3 Population 16 years of age and over, by residence, sex, and by status in employment 32
Table 4.4 Children 6-17 years of age, by residence, sex, and by age, working status 35
Table 4.5 Place of origin of labour in-migrants and place of destination of labour out-migrants 36
Table 4.6 Age distribution of labour migrants, by sex 37
Table 5.1 Percentage of households with access to land, by NRVA assessment, and by residence 41
Table 5.2 Households, by residence, and by access to irrigated land, size of land (in percentages) 43
Table 5.3 Sources of irrigation in summer and winter (in percentages) 44
Table 5.4 Households, by residence, and by access to rain-fed land, size of owned land (in percentages) 44
Table 5.5 Households, by residence, and by access to garden plot, size of garden plot (in percentages) 46
Table 5.6 Afghanistan food balance sheet 2009 47
Table 5.7 Afghanistan, cereal production 2002-2009 (in thousand tons) 47
Table 5.8 Households producing crops on (a) irrigated land in summer, (b) irrigated land in winter (c) rain-fed land, and (d) garden plots, by importance of crop, and by three most frequently mentioned crops (percentage mentioned between brackets)
48
Table 5.9 Households, by residence, and by livestock-owning status, type of livestock (in percentages); also stating mean and median number of livestock
49
Table 5.11 Households cultivating in last summer season, by residence, and by DAP/Urea use, level of DAP/Urea need fulfillment (in percentages)
50
Table 5.12 Households with access to farming land, by information on agricultural production received, reason for not obtaining information (in percentages)
52
Table 5.13 Households with livestock, by veterinary information received, reason for not using veterinary services (in percentages)
52
Table 6.1 Poverty measures 56
Table 6.2 Mean per-capita monthly real consumption expenditure and share in consumption, by (a) population quintile, (b) poverty status
58
Table 6.3 Percentage poor households, by (a) activity status of household head and (b) Industry of working household head
61
Table 6.4 Net enrolment ratios, by household poverty status, and by education level 62
Table 7.1 Literacy rates of population 15 years and over, by residence, and by sex (in percentages) 66
Table 7.2 Net enrolment ratio, by sex, and by level of education 69
Table 7.3 School-age children not attending school, by sex, school age, and by residence, reason for non-attendance (in percentages)
70
Table 7.4 Population age 25 years and over, by sex, residence, and by highest educational attendance 71
Table 8.1 Population, by residence, type of health facility, and by travel time and travel costs to reach the nearest health facility, means of transportation (in percentages)
74
Table 8.2 Percentage of female staff among total health staff, by residence, and by type of health facility, type of staff (Shura assessment)
76
Table 8.3 Children 6 to 59 months, by vitamin A supplementation in the last 6 months, and by (a) residence, (b) educational attainment of mother (in percentages)
77
Table 8.4 Percentage of vaccinated children 12-23 month old, by (a) residence, (b) educational attainment of mother
78
Table 8.5 Percentage of women who received TT vaccination, by (a) residence, (b) educational attainment, (c) age at delivery
80
Table 8.6 Percentage of last born children who were reported exclusively breastfed, by supplementation of additional liquids in first three days after birth, and by (a) residence, (b) highest educational attainment of the mother
81
Table 8.7 Percentage of 6-9-month-olds receiving complementary feeding, by (a) residence, (b) highest educational attainment of mother
82
Table 8.8 Percentage pregnant women among all women and currently married women, by a. marital status, residence, b. marital status, age
86
Table 8.9 Percentage distribution of birth intervals, by birth interval order 87
Table 8.10 Disability, by sex, and by cause of disability 89
Table 8.11 Net-attendance rates of the school-age population, by sex, school age, and by disability status 89
Table 9.1 Households, by type of dwelling, and by residence (in percentages) 92
Table 9.2 Household dwellings, by residence, and by dwelling part, construction material (in percentages) 94
Table 9.3 Dwellings, (a) by residence, and by number of rooms (in percentages); (b) average number of occupants, by residence, and by number of rooms
95
Table 9.4 Percentage of the total population with access to (a) safe drinking water, (b) improved sanitation, and by residence
95
Table 10.1 Primary female household member’s report on the usual decision maker in selected choice situations (in percentages)
Table 10.2 Females 10 years and over with self-generated income, by primary decision maker on spending the income, and by (a) age, (b) marital status (in percentages)
102
Table 10.3 Percentage of communities having representative bodies, by residence, and by type of body 103
Table 10.4 Selected development indicators, by sex, residence and related gender gap 104
Table 11.1 Incidence of households shocks in the 12 months before the survey, by type of shock, and by survey, residence
110
Table 11.2 Prevalence of coping strategies applied, by, residence (in percentages) 112
Table 11.3 Priorities for support to development of (a) male Shuras and (b) female Shuras, by residence (percentage mentioned as first priority between brackets)
Annex tables
Table A.II.1 Areas not enumerated for pre-census household listing 119
Table A.II.2 Analytical domain structure for NRVA 2005 and 2007 119
Table A.II.3 Number of households in the most urban populated provinces 120
Table A.II.4 List of the number of PSU’s per districts selected for the summer and winter Kuchi sample 124
Table A.III.1 Total Fertility Rate calculated directly from recent deliveries, adjusted for under-reporting of
children who later died, for August 2005 to September 2008 126
Table A.III.2 Parity levels, by women’s age, from data on children ever born 127
Table A.III.3 Indirect adjustments to ‘direct’ fertility rate, using cumulative period fertility rates, estimated parity
equivalents, and the P/F ratio 128
Table A.IV.1 Mortality estimates from the Brass method, using West model life tables 129
Table A.IV.2 Number of children ever born (CEB) and children died, by women’s age group, and by sex 131
Table A.IV.3 Unweighted observed and expected women, dead girls and dead boys, by parity 131
Table A.IV.4 Estimation of the number of ‘missing’ girls and the number of these dead, under varying assumptions
of the proportion girls dead 132
Table A.IV.5 Boy-girl mortality differentials from West Model Life Table 133
Table A.IV.6 Final child mortality estimates, by sex 133
Table A.V.1 PSUs missing female household information 135
Table A.V.2 Share of consumption expenditure by real PCE quintile (in percentages) 136
Table A.V.3 Shares of food group to total food consumption by PCE quintile (in percentages) 137
Table A.V.4 Food items by group 138
Table A.V.5 Rationales for proxy price 139
Table A.V.6 Description of a typical house 141
Table A.V.7 Comparison of medians of reported and predicted housing value (in Afghanis) 142
Table A.V.8 Predicted rents by total discount rates 142
Table A.V.9 Rent in urban areas from CPI data in February 2009 143
Table A.V.10 Price index region 143
Table A.V.11 List of regions and provinces 144
Table A.V.12 Temporal deflator for non-food 145
Table A.V.13 Sample size (households) for estimation of poverty line 146
List of figures
Figure 2.1 Survey accessibility, by quarter (panels a-d), and by district 8
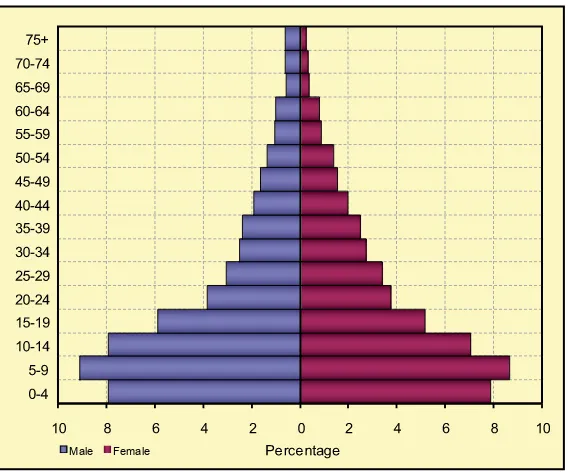
Figure 3.1 Population, by age and sex (in percentages) 10
Figure 3.2 Households and population, by household size 13
Figure 3.3 Population, by age, and by marital status, for a. males and b. females (in percentages) 14
Figure 3.4 Spousal age difference, by current age of wife (percentage distribution) 15
Figure 3.5 Percent male among out-migrants, by type of move 21
Figure 4.1 Labour force participation rate, by residence and by sex 27
Figure 4.2 Labour force participation rate, by sex and age 27
Figure 4.3 Unemployment rate, by season and by residence 29
Figure 4.4 Unemployment rates for 1-hour and 8-hours work criteria, by residence and sex 30
Figure 4.5 Percentage poor, by employment status, and by working hours for those employed 31
Figure 4.6 Distribution of the employed population 16 years of age and over across economic sectors and residence (in percentages)
32
Figure 4.7 Average number of weekly working hours by the employed population, by residence, and by sex 33
Figure 4.8 Highest level of education attended by returning labour migrants, by residence (in percentages) 36
Figure 4.9 Place of stay during absence for seasonal work, by current residence (percentage distribution) 37
Figure 5.1 Percentage of rural households with access to land, by province 42
Figure 5.2 Households engaged in agriculture who own or manage irrigated land, by NRVA assessment, and by residence (in percentages)
43
Figure 5.3 Households engaged in agriculture who own or manage rain-fed land, by NRVA assessment, and by residence (in percentages)
45
Figure 5.4 Households engaged in agriculture who own or manage garden plots, by NRVA assessment, and by residence (in percentages)
46
Figure 5.5 Percentage of households cultivating opium, by province 49
Figure 5.6 Main reason for leaving fallow land (a) irrigated land, (b) rain-fed land (in percentages) 51
Figure 6.1 Poverty headcount rate, by residence and major region 56
Figure 6.2 Poverty headcount rate, by season 57
Figure 6.3 Gini index, by residence and region, and for selected countries 57
Figure 6.4 Percentage of poor households, by household size 59
Figure 6.5 Percentage of poor households, by number of children under 15 and adults aged 15-59 59
Figure 6.6 Percentage of poor households, by selected attributes of household head 60
Figure 6.7 Percentage of poor households, by selected attributes of household members 62
Figure 6.8 Percentage of poor households, by access to land and selected services 63
Figure 7.1a Male literacy rates, by province 67
Figure 7.1b Female literacy rates, by province 67
Figure 7.2 Literacy indicators, by age and sex 68
Figure 7.3 Age-specific school attendance rates, by sex 69
Figure 8.1 Percentage of population with access to nearest health facility within one hour by any means of transport, by province
Figure 8.2 Percentage of children aged 12-23 months who received full immunization, by province 79
Figure 8.3 Percentage women up to age 49 currently using modern contraceptives 83
Figure 8.4 Percentage of women using skilled birth attendants, by province 85
Figure 8.5 Number of disabled people (in thousands) and disability prevalence, by age 88
Figure 8.6 Labour force participation rates and unemployment rates, by disability status, sex 90
Figure 9.1 Households, by tenancy status, and by residence (in percentages) 93
Figure 9.2 Percentage of the total population with access to safe drinking water, by province 96
Figure 11.1 Incidence of households shocks in the past 12 months due to influx of refugees and IDPs, by province (in percentages)
111
Figure 11.2 Incidence of households shocks in the past 12 month due to water-related problems, by province (in percentages)
112
Annex figures
Figure A.IV.1 Sensitivity analysis of a. IMR and b. U5MR, including ‘missing’ girls at various proportions dead 133
Figure A.V.1 Price index for food expenditures 145
Figure A.V.2 Trends in food and non-food CPI 145
Figure A.V.3 Per capita calorie consumption 146
List of text boxes
Chapter 3 – Population structure and change 10
Quality of age reporting 10
Total Fertility Rate 16
Infant- and Under-five Mortality Rate 17
MDG Indicators 4.1 – Under-five Mortality Rate – and 4.2 – Infant Mortality Rate 18
Migration definitions 19
Chapter 4 – Labour force characteristics 25
Decent work 25
MDG Indicator 1.7: Proportion of own-account and contributing family workers in total employment 31
MDG Indicator 3.2: share of women in wage employment in the non-agricultural sector 32
Child labour 34
Labour migration 35
Chapter 5 – The agricultural sector 40
Access to land 41
Chapter 6 – Poverty incidence and poverty profiling 54
Poverty measures 55
MDG Indicator 1.2: Poverty gap ratio 56
Gini Index 57
Chapter 7 - Education 65
Self-reported literacy rate 65
MDG Indicator 2.3: Literacy rate of the 15-24 year-olds, women and men 66
MDG Indicator (10): The ratio of literate women to men, 15–24 years old 68
MDG Indicator 2.1: Net enrolment in primary education 69
MDG Indicator 3.1: Ratio of girls to boys in primary, secondary and tertiary education 71
Chapter 8 - Health 73
MDG Indicator 4.3: Proportion of 1 year-old children immunized against measles 78
Contraceptive methods: modern and traditional 83
MDG Indicator 5.3: Contraceptive prevalence rate 84
MDG Indicator 5.2: Proportion of births attended by skilled health personnel 84
MDG Indicator 5.5: Antenatal care coverage (at least one visit) 84
MDG Indicator 5.4: Adolescent birth rate, per 1,000 women 86
Chapter 9 - Housing 92 MDG Indicator 7.10: Proportion of urban population living in slums; MDG Indicator 32: Proportion of households with
secure tenure 93
MDG Indicator 7.8: Proportion of population with sustainable access to an improved water source, urban and
rural 97
MDG Indicator 7.9: Proportion of population with access to improved sanitation, urban and rural 97
MDG Indicator (29): Proportion of population using solid fuels 97
MDG Indicator 8.14 and 8.15: Telephone lines and cellular subscribers per 100 population 98
MDG Indicator 8.16: Internet users per 100 population 98
Chapter 10 – Position of women 99
Shuras and Community Development Councils 102
Measurement of the gender gap 105
Chapter 11 - Household shocks and community preferences 109
Abbreviations
ADB - Asian Development Bank
ANDS - Afghanistan National Development Strategy AHS - Afghan Health Survey
ANC - Antenatal Care
BCG - Bacillus Calmette-Guérin (Tuberculosis) BPHS - Basic Package of Health Services CBN - Cost of Basic Needs
CDC - Community Development Council CEB - Children Ever Born
CEDAW - UN Convention on the Elimination of Discrimination against Women CHW - Community Health Workers
CPI - Consumer Price Index
CPR - Contraceptive Prevalence Rate CSO - Central Statistics Organization DAP - Di-Ammonium Phosphate (fertilizer)
DFID - UK Department for International Development DHS - Demographic and Health Survey
DPS - District Price Survey
DTP - Diphtheria, Pertussis Tetanus EC - European Commission
EPI - Expanded Program on Immunization FEI - Food Energy Intake
FAO - Food and Agriculture Organization FP - Family Planning
GDP - Gross Domestic Product GoA - Government of Afghanistan HCI - Head Count Index
ICF - International Classification of Functioning, Disability and Health IEC - Information, Education and Communication
ILO - International Labour Organization IMR - Infant Mortality Rate
ICSE - International Classification of Status in Employment LFPR - Labour Force Participation Rate
LFS - Labour Force Survey LAD - Least Absolute Deviations
MAIL - Ministry of Agriculture, Irrigation and Livestock MDGs - Millennium Development Goals
MICS - Multiple Indicator Cluster Survey MMR - Maternal Mortality Rate
MoWA - Ministry of Women’s Affairs
MRRD - Ministry of Rural Rehabilitation and Development NAPWA - National Action Plan for the Women of Afghanistan NDSA - National Disability Survey in Afghanistan
NMAK - National Multi-sectoral Assessment on Kuchi NRVA - National Risk and Vulnerability Assessment NSP - National Solidarity Programme
NSS - National Surveillance System OLS - Ordinary Least Squares OPV - Oral Polio Vaccine PCE - Per Capita Expenditure
PRSP - Poverty Reduction Strategy Paper PSU - Primary Sampling Unit
TBA - Traditional Birth Attendant TFR - Total Fertility Rate TT - Tetanus Toxoid
U5MR - Under-five Mortality Rate
UNAMA - United Nations Assistance Mission in Afghanistan UNFPA - United Nations Fund for Population Activities UNICEF - United Nations Children’s Fund
UXO - Unexploded Ordonances
VAU - Vulnerability Analysis Unit, MRRD WB - World Bank
Executive Summary
The National Risk and Vulnerability Assessment 2007/8 is a nationally representative multi-purpose survey. The main objectives of the survey are to provide up-to-date information for assessing the situation of the people of Afghanistan and to furnish data needed for monitoring progress toward development goals. Results pertain to the period August 2007 to August 2008.
Population structure
•
Afghanistan has an exceptionally high share of children under 15 – 49 percent – and a very small proportion of elderly aged 65 and over – 3 percent. The overall dependency ratio is 133.
•
The country’s sex ratio is 105 males per 100 females.Demographic indicators
•
The Total Fertility Rate is estimated at 6.3 over the three years preceding the survey. Fertility is lowest in the urban population (5.3) and very high among Kuchis (7.3), with the rural population in between (6.5). The finding that the present TFR is nearly one live birth below the fertility level experienced by women aged 40-49 suggests a modest fertility decline.
•
NRVA data indicate that the infant mortality rate was 111 per 1,000 live births and the under-five mortality rate was 161 per 1,000 live births around 2004. Comparison with earlier estimates of mortality suggests that infant mortality is declining.
Household structure
•
The average household size is 7.3 persons per household, with on average 3.5 children residing in the household. Close to one-third of all Afghans live in households with 10 or more people and less than three percent do so in households with three or fewer people.
•
Only 2 percent of households – around 70 thousand – are female-headed. Around 11 percent of households (380 thousand) are headed by either heads aged 65 and over or under-20.
Marriage patterns
•
Marriage is almost universal in Afghanistan: less than one percent of the population of 35 and over remained unmarried.
•
The mean age at first marriage of women is 17.9 years. Nine percent of women aged 20-49 were married before reaching age 15. This proportion has declined to three percent for those currently aged 15-19.
•
Afghanistan has 526 thousand widows and 135 thousand widowers. The large age difference between spouses, especially in the older cohorts, is an important contributing factor to the overrepresentation of women among the widowed.
Migration
•
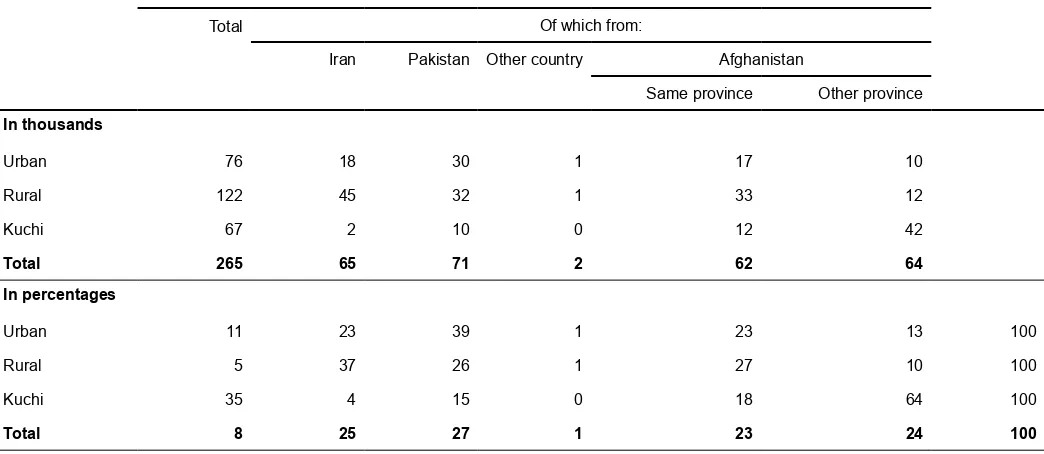
Thirteen percent of households has members who were living elsewhere sometime during the five years preceding the survey. Fifty-four percent of these migrants migrated within Afghanistan. Of the remaining international migrants, the largest share had returned from Iran.
•
The percentage of households who saw a household member leave during the past year is 7 percent. Here, the large majority consists of international migrants, with Iran as the main country of destination. Out-migration is under-estimated to the extent that complete households have moved away, which probably more affects internal out-migration than emigration.
Labour force
•
The labour force participation rate of the population aged 16 and over is 67 percent, but reveals a large difference between men (86 percent) and women (47 percent). The share of the currently active population is highest among Kuchis – 78 percent for both sexes combined – and lowest for the urban population – 49 percent. Labour force participation among the rural population takes an intermediate position: 71 percent.
•
The overwhelming majority of 93 percent of the labour force is employed for at least one hour a week. The corresponding unemployment rate is a modest 7 percent. These figures should be interpreted in the sense that in the dire economic conditions of Afghanistan, very few can afford not to work, even if it is in unproductive work and for few hours per week. In addition to the 7 percent who cannot even find one hour work, many who are employed find only few hours work and/or can insufficiently provide income.
•
Pockets of high unemployment are found among youth under 25 (12 percent) and educated women (18 percent).
•
Most employed people (77 percent) have insecure jobs as own-account workers or unpaid family workers. Almost all women and Kuchi (95 and 90 percent, respectively) are in vulnerable employment.
•
In the situation of Afghanistan the concept of unemployment is inadequate to assess the degree to which the labour market is able to provide sufficient and adequate employment. Measures of underemployment will provide information that is much more relevant to assess the situation and to develop employment policies.
•
Agriculture and livestock represent the dominant economic sector of employment in Afghanistan. Overall, 59 percent of the employed population is engaged here; for the rural and Kuchi populations, the respective shares are 67 and 87 percent.
•
Of all children aged 6-17, 21 percent (1.9 million) are working. Of these, at least 1.2 million children (13 percent) can be classified as child labourers. The proportion of working children not attending school is twice as high as the corresponding proportion of children not working.
•
Labour migration is a frequent livelihood strategy in Afghanistan. Seven percent of all households have a labour in-migrant, 6 have a labour out-migrant and 14 percent have seasonal labour migrants. Iran is by far the most important country for international labour migration.
Agriculture
•
Agricultural activities are the main livelihood strategies for the Afghan population: 55 percent of households are engaged in farming and 68 percent have any type of livestock.
•
Around 40 percent of households have access to irrigated land (on average 7 Jerib), 17 percent have access to rain-fed land (on average 14 Jerib) and 11 percent grow vegetables and fruits on garden plots.
•
Wheat is by far the most important crop: 77 percent of households farming on irrigated land in summer and 94 percent farming on rain-fed land grow wheat.
•
The main reason for leaving fallow land is shortage of water. Rehabilitation of irrigation systems is the first priority of rural communities.
•
Some 10 percent of households engaged in agriculture grow opium. The production is concentrated in six provinces. In Urozgan and Helmand, respectively 82 and 67 percent of households produce opium.
•
Nationally, the average number of major livestock – cattle, oxen, horses, donkeys, camels, goats or sheep – per household with any livestock is 13. With 63 major livestock Kuchi households have considerably larger herds.
Poverty and inequality
•
Poverty is widespread in Afghanistan. The percentage of Afghans that is not able to meet their basic needs is 36 percent. Even higher poverty incidences are found among the Kuchi population (54 percent) and in South, West-Central and East regions of the country (more than 44 percent).
•
The national average poverty line is 1,255 Afs. per person per month, representing the typical cost of attaining 2,100 calories per person per day and of meeting some basic non-food needs.
•
The poverty gap ratio is a considerable 8 percent. Poverty among the Kuchi’s is not only more widespread, poor Kuchi’s are also significantly poorer that the rural and urban poor. The total consumption shortfall is about 28.4 billion Afs., approximately 570 million USD.
•
Factors that significantly correlate with poverty are household size and number of children in the household, sex of the household head, the head’s educational attainment, employment status and industry of work, child labour, seasonal migration, net primary and secondary enrolment, access to land, and access to basic services like safe drinking water, improved sanitation and electricity.
•
Although the national Gini index of 29 is low in international perspective, substantial inequality exists in shares of consumption: the richest quintile of the population has a share of 39 percent of total consumption, the poorest quintile has only 9 percent.
Education
•
The large majority – 74 percent – of the population aged 15 years and over is illiterate. Male illiteracy is at a level of 61 percent and female illiteracy at 88 percent. For the urban, rural and Kuchi populations, the corresponding illiteracy figures are 52, 79 and 94 percent, respectively.
•
The sharp rise in literacy from 26 percent among the 20-29 years old to 46 percent for the 15-19 years old, suggest a considerable improvement of the education system in recent years.
•
Around 52 percent of primary-school age children (42 percent for girls and 60 percent for boys) are attending primary school, leaving some 2.3 million children not in primary school. The figure implies a significant improvement compared to the net primary enrolment rate of 37 in 2005.
General health
•
On most internationally comparable health indicators, Afghanistan is among the worst performing countries. Despite the still weak state of the health system, its reconstruction becomes visible in improving several health-related indicators.
•
Further improvement of health facilities ranks among the top priorities for community development.
•
Access to any public health facility within one hour walking is possible for 57 percent of the population. The corresponding figure for the rural population is 54 percent, for urban dwellers 79 percent and for Kuchis only 37 percent.
•
There are 406 thousand disabled persons in Afghanistan, implying a disability prevalence of 1.6 percent. School attendance of disabled children and labour force participation of people of working age are only half of that of their non-disabled counterparts.
Child health
•
Full immunization with the eight recommended vaccinations is received by 37 percent of children aged 12-23 months; 15 percent have never been vaccinated. Vaccination rates for BCG, OPV3, DTP3 and measles were, respectively, 74, 71, 43 and 56 percent.
•
Sixty-nine percent of children aged 6-59 months received vitamin-A supplements against infections and 61 percent of households used iodized salt.
•
Exclusive breastfeeding occurs for 35 percent of children aged 0-6 months.
Reproductive health
•
Current use of modern contraception was reported by 23 percent of women married or in union, an increase from 10 percent reported in 2003. One in four currently married women are currently pregnant. For women under age 25 this figure is one in three.
•
Twenty-four percent of women receive skilled birth attendance and 36 percent receive some type of antenatal care. In 2003 only 16 percent of women were assisted by skilled health personnel.
•
Nearly one third of women had a birth interval of less than 18 months and more than half of the women had an interval of less than 24 months, the minimum recommended by the WHO.
Housing
•
One-third (34 percent) of Afghan households can be considered overcrowded, in the sense that on average more than three people share one room.
•
Some 23 percent of households cannot prove the ownership of their dwelling (44 percent in urban areas). Especially in view of returning refugees and IDPs this becomes a relevant issue.
•
Around 4.4 million urban dwellers (93 percent) live in conditions of insecurity and physical and environmental deprivation.
Basic facilities
•
Overall, 27 percent of the population use an improved source of drinking water, but the variation between the urban, rural and Kuchi populations is wide (58, 20 and 16 percent, respectively).
•
Nearly the entire population lives in households lacking improved sanitation facilities. In urban areas 21 percent is lacking improved sanitation; among rural and Kuchi households it is virtually non-existent.
•
Twenty percent of households is connected to the electric grid.
•
For cooking and heating, the large majority of households use solid fuels (83 and 98 percent, respectively).
Gender aspects in decision making
•
Women’s decision-making power in the household is small. In most fields, the husband or father is the primary decision maker. Only in typical family affairs – marriage of children, care of the elderly and somewhat less, education of children – is the representation of women more felt, although even here decision making is usually together with the spouse.
•
Marrying at very young age and marrying a spouse who is much older tends to imply high levels of dependency. Women’s influence in household decision making increases with age.
•
Representation of women at community level in Shuras and Community Development Councils is low – 20 and 36 percent, respectively, against 70 and 68 percent for men.
Gender inequality
•
In every development field women are disadvantaged compared to men. This situation is generally less pronounced in urban areas.
•
Women participate less in economic activities, for fewer hours and predominantly in vulnerable employment.
•
Literacy of women is less than one-third of that of men, and large gaps exist in school enrolment rates.
•
In recent years the literacy and school enrolment gaps are narrowing.
Household shocks
•
More than two-thirds (71 percent) of Afghan households experienced in the year before the survey at least one household shock – a negative effect of events that is beyond their control.
•
The most frequently mentioned household shock was the influx of refugees and IDPs (60 percent), followed by any natural disaster (39 percent), agriculture and livestock problems (22 percent) and drinking water problems (18 percent).
Aid programmes
•
450 thousand or one in seven households participated in cash-for-work, food-for-work or food aid programmes. For a large share of these households this participation improved their food situation.
Community preferences
1 Introduction
Afghanistan is facing fundamental economic and social change. To measure progress in social and economic development, as well as in poverty reduction, it is imperative that the Government of Afghanistan (GoA) has access to information on the social and economic situation of the population. This information will serve to assist the government to adapt policy to changing socio-economic conditions, and allow it to monitor the impact of such policies on the more vulnerable groups in the country.
The National Surveillance System (NSS) Project was designed to assist the Government of Afghanistan in addressing its acute and multiple data needs to inform and prioritise the reconstruction and development efforts, and to contribute to data collection in the areas of poverty alleviation, food security, livelihood and vulnerability. The NSS Project is implemented within the Vulnerability Analysis Unit (VAU) of the Ministry of Rural Rehabilitation and Development (MRRD) and the NSS Unit at the Central Statistics Organisation (CSO). The NSS Unit is responsible for the design and implementation of regular data collection, data processing, standard data analysis, as well as wider data dissemination. MRRD’s Vulnerability Analysis Unit is responsible for addressing the needs for data, analysis and interpretation according to the specific priorities of the MRRD senior management, its advisors, as well as the MRRD programmes.
The key component of the NSS Project is the National Risk and Vulnerability Assessment (NRVA), the basis of this report. The NRVA as it stands today is the only comprehensive nation-wide multi-purpose household survey in Afghanistan enabling cross-section analyses. The present 2007/8 NRVA is the third of three successive rounds of surveys, following NRVA 2003 and 2005. The NRVA 2003 survey was carried out with co-operation of the World Food Programme (WFP) and supported by the Vulnerability Analysis Unit (VAU) of the Ministry of Rural Rehabilitation and Development. The second NRVA survey was launched in 2005, with CSO and MRRD as the implementing agencies. This NRVA 2005 was a significant improvement in terms of sample design and coverage.
As a follow-up to the first two surveys, the third NRVA survey was launched in 2007, jointly by MRRD and CSO, and with co-operation from the European Commission. The NRVA 2007/8 was based on a smaller sample of 20,576 households, but with further improvements in the questionnaire, sample design and coverage. It was designed to provide governments and other agencies with more robust and up-to-date socio-economic data. A comparison of coverage and methodology of the three surveys is given in Chapter 2.
The aim of this report is to provide key indicators of socio-economic development in Afghanistan, including 25 MDG indicators. These development indicators and additional information will support the Afghan PRSP (ANDS) and provide unique insights for policy makers, as well as for a broader audience. The present report does not only seek to fill in numerous data gaps, but also to put findings into a broader perspective by establishing trends with NRVA 2005 and other surveys, paying special attention to gender aspects, providing more detailed and cross-sectional analysis, and by translation into policy recommendations. The gained understanding of poverty and vulnerability in the context of social change in Afghanistan should justify the tremendous survey efforts of the past two years.
The subsequent Chapter 2 describes the main methodological characteristics of the NRVA 2007/8 survey, including brief descriptions of the sampling design, survey questionnaires, data collection and processing, data constraints, and comparison with the 2003 and 2005 NRVA surveys.
Population structure and change are addressed in the first subject-matter chapter (Chapter 3), as these factors permeate into every development aspect of the remaining report sections. Afghanistan’s population composition by age and sex is analysed, as well as the underlying dynamics of fertility, child mortality and migration. In addition, household and marriage patterns are examined. Chapter 4 provides an analysis of the structure of Afghanistan’s labour market and covers various labour force indicators, including employment, unemployment, working hours, vulnerable employment, and differentiation by age and sex. Special attention is also paid to working children and labour migration.
The twin Chapters 7 and 8 are dedicated to the social sectors of education and health, and to the changes occurring in these sectors. The former analyses literacy rates, school enrolment and educational attainment, whereas the latter covers access to health facilities, reproductive and child health, and disability.
The housing situation is described in Chapter 9, with a view on house ownership, building characteristics and housing facilities, like electricity, drinking water and sanitation. Chapter 10 has a cross-cutting focus on the position of women and contains two main sections: one on the role of women in decision making (in the household and in the community) and one that largely summarises the findings from all chapters, specifically from a women’s development perspective. Household shocks and coping strategies, as well as community preferences for interventions are outlined and analysed in chapter 11.
2 Methodological backgrounds of NRVA 2007/8
2.1 Lead-up to the NRVA 2007/8
In 2002, the World Food Programme (WFP) and other stakeholders conducted a countrywide assessment in Afghanistan, with the main focus on food aid needs for reasons of geographical targeting. In addition, the assessment provided baseline information on livelihoods. The Government of Afghanistan initiated a review of the methodology for the 2003 annual assessment, which proved useful in not only improving the methodology, but also, and more importantly, in involving a larger group of stakeholders in the national assessment process. Although at the time this review was not seen as a potential component of a larger information system, the timing was right. The government was just starting to implement its social protection programmes and the upcoming National Risk and Vulnerability Assessment (NRVA) presented an opportunity to incorporate its information needs into a new survey design.
The NRVA was an amalgamation of both emergency and development methodologies and various specific needs of stakeholders. While engaging with a wide audience in a collaborative process improved the usefulness of the information, it also presented challenges, for instance by trying to integrate the wide range of stakeholder needs into the questionnaire. As there was no national household sampling frame available – Afghanistan’s first and only census to date took place in 1978 – the selection of communities (rural only) was stratified by both problems and agro-ecological zones. The list of villages and their population was incomplete at that time, inevitably producing a bias against those living in smaller undocumented villages. Within the villages, household selection was stratified by wealth groups, generated through a community focus-group wealth-ranking process. These methodological modifications marked a change from the previous community-based WFP methodology to surveys primarily based upon household responses. The first NRVA survey was carried out between July and September 2003 in co-operation with the WFP and supported by the Vulnerability Analysis Unit (VAU) of the Ministry of Rural Rehabilitation and Development (MRRD).
By the end of 2004, the second NRVA was under design, to be conducted in the summer of 2005. The survey was launched in 2005 jointly by the Central Statistics Organisation (CSO) and the Ministry of Rural Rehabilitation and Development. It received support from the European Commission (EC) through the National Surveillance System Project, based in both MRRD and CSO.
Building on the lessons learnt from 2003, a methodology was developed through a consultative stakeholder process, including the line ministries, World Bank, WFP and UNICEF. The assessment incorporated quantity of food consumed – allowing comparison to the NRVA 2003 – and dietary diversity. In the absence of other national data for the estimation of poverty and poverty analysis, the NRVA 2005 took on added importance by including questions that provided the empirical basis for consumption-based poverty estimates. This had special relevance to the development of the Afghan National Development Strategy (ANDS, Afghanistan’s PRSP). The questionnaire scope was furthermore extended by including additional modules on remittances and reproductive and child health.
The NRVA 2005 was designed to produce representative estimates for the rural population and the nomadic Kuchi, and for the first time also for 10 large urban centres. By then a sample frame was available for most of the country through the pre-listing of households that CSO collected in preparation for the national census.1 This sample frame to a large part
removed any bias away from small rural settlements in remote areas. The survey in total enumerated 30,822 households from 34 provinces.
Another significant improvement of the NRVA 2005 in terms of coverage, related to the collection of data best answered by women with female interviewers. This was facilitated by mobilising male-female survey teams for almost all parts of the country, except where security dictated the team should be male only or, in rare cases, where areas were not enumerated at all. One of the main limitations of the 2005 survey was considered the limitation of data collection to the summer period June-August, during or immediately after harvest. As this is a time of the year where high consumption patterns were expected, the analysis inevitably produced seasonally biased results and poverty estimates that are low compared to the annual average and several other months.
The NRVA 2005 data has been used by many government and non-governmental organizations for their policies and programmes, but importantly, it has become the Afghan Government’s tool for establishing baselines and monitoring progress against the MDG’s and ANDS’s goals and targets.
2.2 NRVA 2007/8 methodology
2.2.1 Stakeholder involvement and questionnaire design
The NRVA 2007/8 is in many ways similar to the NRVA 2005, and intentionally so. As in the preparation to the NRVA 2005, a process of stakeholder consultation provided input into the survey design and especially the development of the questionnaire. To facilitate the stakeholder consultation, two workshops were held in January and March 2007. The draft questionnaires were tested twice in the field and a pilot test of the questionnaires took place in five regions for further and final improvements. The questionnaires were translated into Dari and Pashto. The questionnaire format was designed in Teleform (software that extracts data from paper questionnaires) to allow data scanning instead of manual data entry. Around 1.6 million questionnaire pages were completed and scanned. The fieldwork started in mid-August 2007 and lasted up to the end of August 2008.
2.2.2 Sampling design
The sampling design of the NRVA 2007/8 built upon the experiences from the NRVA 2005 and the same sampling approach was maintained, with representative statistics generated for 34 provinces, 11 instead of 10 urban centres, and the nomadic pastoralists. Based on the CSO pre-census household listing data, a geographically ordered list of all of the primary sampling units (PSUs) (rural settlements and urban blocks) was created with their estimated number of households. The resulting sample is a total of 2,441 PSUs and 20,576 households (19,528 from the settled urban and rural population and 131 (1,048 households) from the Kuchi population
The use of a random start and a pre-determined sampling interval provided each household with an equal chance of being selected. Once individual households had been selected, seven other households were selected within the same PSU. Consequently, in every PSU, eight households were interviewed. To avoid the problem of household replacements in the field, the 2007/8 sample design was improved by randomly selecting four households that were kept as reserve in case the household had moved away.
A major difference with the 2005 assessment is the removal of the seasonality bias by conducting the survey year-round during all 12 months. The main considerations for moving from data collection in summer only to the year-year-round strategy were:
•
to capture the seasonality of consumption and other dimensions of welfare;•
to improve the quality of the collected data;•
to field a smaller group of carefully selected, well trained and properly supervised interviewers;•
to permit higher quality field and data validation procedures, through avoiding a concentration of the sample into just two months;•
to be consistent with international standards for obtaining seasonally biased estimates.2.2.3 Questionnaire contents and interviews
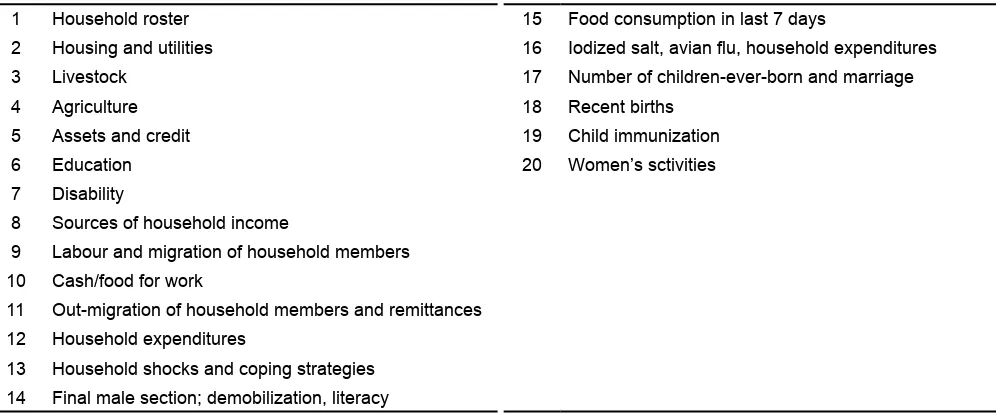
The core of NRVA 2007/8 survey is a household questionnaire consisting of 20 sections, 14 administered by male interviewers and answered by the male head of household, and six asked by female interviewers from female respondents (Table 2.1). On average the time required to answer the household questionnaire was around two hours.
_________________________________________________________
Table 2.1 Sections and section topics of the NRVA 2007/8 questionnaire
Men’s questionnaire sections Women’s questionnaire sections
1 Household roster 15 Food consumption in last 7 days
2 Housing and utilities 16 Iodized salt, avian flu, household expenditures
3 Livestock 17 Number of children-ever-born and marriage
4 Agriculture 18 Recent births
5 Assets and credit 19 Child immunization
6 Education 20 Women’s sctivities
7 Disability
8 Sources of household income
9 Labour and migration of household members
10 Cash/food for work
11 Out-migration of household members and remittances
12 Household expenditures
13 Household shocks and coping strategies 14 Final male section; demobilization, literacy
[image:30.612.63.561.109.316.2]Additional to the household data collection, information was gathered at community level through two community questionnaires – one male and one female Shura questionnaire – addressing the topics presented in Table 2.2.
Table 2.2 Male and Female Shura questionnaire topics
Male Shura questionnaire Female Shura questionnaire
Community information and shura participants Shura participants
Access to infrastructure and wages Access to health facilities
Markets access Community roles and governance
Access to health facilities Community priorities
Access to education facilities
Community roles and governance Programme activities in the community
Community priorities
2.2.4 Comparability of NRVA 2007/8 with previous rounds
Table 2.3 Comparison of NRVA 2003, 2005 and 2007/8
NRVA 2003 NRVA 2005 NRVA 2007/ 08
Sampling
Sample frame not available; relied on WFP village lists. Expected to be biased for larger rural settlements.
Sample frame available from CSO pre-census household listing. Sampling proportional to population, except in the smaller provinces and urban centres where over-sampling insured enumeration of sufficient number of households.
Sample frame from updated CSO pre-census household listing. Proportional to population, with over-sampling of smaller provinces and urban centres.
Sample selection was not fully random; stratified by different agro-ecological zones.
Sample selection based on random selection from geographically ordered PSUs, to give a random spread that represented the spatial distribution of the population.
Sample selection based on random start method to have a better geographic distribution of the sample.
Household selection was not random within the key issue, but randomly selected within wealth groups. 6-7 households have been assessed within each village.
Household selection based on the random start method within villages. 12 households were assessed in each selected village.
Household within selected villages was randomly selected from CSO household listing. 8 households in each village selected for assessment.
Data collection
Four levels of data collection: • District level
• Community Shura level • Wealth group level • Household level
Three levels of data collection: • District level
• Community Shura level • Household level
Three levels of data collection: • District level
• Community Shura level • Household level
Much data collection at the community or district level.
Data collection mainly at individual and household level.
Data collection mainly at individual and household level.
Female interviewers not involved in the south and most eastern areas.
Female interviewers participated in all provinces except Zabul.
Female interviewers participated in all provinces except Urozgan.
Only rural areas and Kuchi population Rural and urban areas and Kuchi population Rural and urban areas and Kuchi population
Representing one season, survey conducted within 3 months
Representing one season, survey conducted within 3 months
Representing all seasons, survey conducted within 12 months
Poor female coverage Good female coverage Good female coverage • 32 provinces
• 368 districts • 1,853 villages • 5,559 wealth groups • 11,757 rural households • 85,577 persons
• 34 provinces • 392 districts • 2,597 clusters • No wealth groups • 30,822 households • 221,586 persons
• 34 provinces • 395 districts • 2,572 clusters • No wealth groups • 20,576 households • 152,262 persons Questionnaire contents and design; data processing
Partial stakeholder participation in questionnaire design.
Full stakeholder participation in questionnaire design.
Full stakeholder participation in questionnaire design.
Information on basic demographics, health, housing, household assets, migration, risk exposure and response, livestock ownership, agricultural activities and household food consumption.
Added information on remittances, HIV/ AIDS, maternal and child health, household non-food consumption.
Added information on disabilities, labour market participation, migration, infant- and under-five mortality, women’s position. More details on household food and non-food consumption. Dropped information on HIV/AIDS.
Common questionnaire format Teleform scannable questionnaires Teleform scannable questionnaires
Some data manually entered; other data transcribed into Teleform format and scanned.
Teleform scanning software used for data capture with appropriate Visual Basic on SQL data quality routines built-in.
NRVA 2003 NRVA 2005 NRVA 2007/ 08
Staff and training
Several trainers involved in training of interviewers, resulting in variation in interviewer performance.
Uniform training by 2 trainers involved for the whole country.
Uniform training in one training session for all field staff for the whole country. More detail and longer (17 days) training.
Large number of part-time interviewers. More than 500 field staff were part-time employed.
156 field staff selected. More transparent method of staff selection (short listing, test and interview from 12 thousand applicants).
Management and funding
Managed by WFP/VAM Managed by Government (CSO-MRRD) Managed by Government (CSO-MRRD)
Funded by: • Swiss Government • VAM Headquarters • WFP
Funded by:
• EC/NSS (main donor) • WFP
• UNICEF
Funded by:
• EC/NSS (main donor) • WFP
• DFID • ADB • UNICEF • WB
2.2.5 Data limitations
Even though the lessons learnt during design, implementation and analysis of NRVA 2003 and 2005 were integrated in the design of the NRVA 2007/8 survey, there are still some constraints and limitations in the data, especially with regard to information on women and children:
•
Out of the 396 sampled districts, there were five that have not been accessible for security or other reasons in any time of the year. Figure 2.1 provides the accessibility information by fieldwork quarter.•
Due to security problems there were no female interviewers in Urozgan province to administer female questionnaire sections. This especially had consequences for the information on reproductive health, child health and fertility and mortality information. Only the food consumption part of female questionnaire sections was collected by male enumerators interviewing male respondents.•
After the second month of fieldwork, the worsening security situation prohibited the female interviewers to continue data collection in Nooristan province. Considering the local culture of the province, male enumerators were able to ask the female questionnaire directly to the female respondents.Me
th
o
d
o
lo
g
ic
a
l b
a
c
k
g
ro
u
n
d
s
o
f
N
R
V
A
2
0
0
7
[image:33.612.55.718.68.557.2]/8
Figure 2.1 Survey accessibility, by quarter (panels a-d), and by district
a. First quarter (September-November 2007) b. Second quarter (December 2007-Feb