NRVA 2007/08 Sampling Design
Contents
APPROACH AND COMPARISON TO SAMPLING PROCEDURE FOR NRVA 2005 1 SAMPLE FRAME CHANGES SINCE NRVA 2005 1
CLUSTER SIZE 2
ANALYTICAL DOMAINS 2 URBAN ANALYTICAL DOMAINS 2
Household listing for PSUs without household listing data 4 Household identification for PSUs with household listing 5 REPLACEMENT HOUSEHOLDS-WITHIN-CLUSTER 5
REPLACEMENT CLUSTERS-WITHIN-DOMAIN 5
Strategy for dealing with PSUs that are temporarily or permanently inaccessible 5 PROPOSED STRATEGY FOR THE SELECTION OF SUMMER KUCHI 6
Selection of Kuchi communities within districts 7
Procedure for determining number and identity of within district Kuchi community sample when there is no telephone reception 7
Selection of tents within a Kuchi community when there is no mobile telephone reception 7 Tent selection example 7
Selection of tents within a Kuchi community when there is mobile telephone reception in the community or close to it. 8
Calculation of Kuchi weights - May 10, 2008 8 ANNEX 1 TABLE FOR SELECTING SAMPLING INTERVAL 11
Approach and comparison to sampling procedure for NRVA 2005
The sampling design of the NRVA 2007-2008 was built on experience from the NRVA 2005. Most features and approaches of the sampling used in the NRVA 2005 are maintained. The biggest improvement in the design of the survey is the extension of the survey period from two months in the summer season to a full 12 month survey to ensure that seasonality is fully accounted for. The resulting sample is a total of 20, 576 households; 2,441 PSU’s selected creating a household sample of 19,528 from the settled urban and rural population and 131 PSUs (1,048 households) from the Kuchi (nomadic) population.
The NRVA 2007-08 design improvements help to:
• Fully capture seasonality of consumption and other dimensions of welfare
• Improve the quality of the collected data, by giving greater specificity of household selection within PSUs.
• Reduce the number of interviewers needed, which thereby allows for more careful selection, and better training and supervision.
• Generate effective quality control procedures and iterative quality feedback to the survey teams. • Produce national-level sample sufficient for a poverty estimate figures after the first few months of
fieldwork, but this will be seasonally biased.
• Be consistent with recommended international standards.
The other main differences between NRVA 2005 and 2007-08 are that the NRVA 2007-08 sampling will: • Use an updated sample frame
• Pre-select households in each selected PSU, with head of household name and size of household taken from household listing forms, except where there is no household listing data available.
• PSU sample randomly allocated into 12 monthly sub-samples
NRVA 2007-08 Sample frame
frame. As this FAO data came from a livestock census, it was recognized that the urban areas would not be fully represented, (see inclusion of urban Helmand to analytical domains in section below).
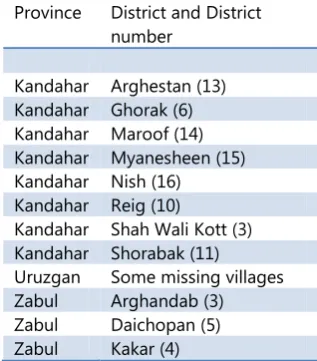
The household listing continued after the 2005 NRVA sample was drawn and the full listing was completed by early 2006. However, as a result of security concerns, eight (of 16) districts in Kandahar and three (of 11) districts in Zabul were not enumerated at all and there are some missing villages from various locations in Uruzgan (Table 1) when the pre-census household listing enumeration finished in 2006. For these unlisted areas, CSO conducted interviews with village Shura to get estimates of the total number of
households and population, and introduced them into the sample frame, and it is this combined frame that was used for the NRVA2007-08 frame.
The NRVA 2007-08 survey aims to enumerate a sample covering the whole country, as was attempted with NRVA 2005. Poor security prevented enumeration in 11 districts in NRVA 2005, and some districts with poor security prevented female enumerators going, and in those situations, the consumption module of the female questionnaire was enumerated by men and the remaining modules were not used.
Cluster size
The number of households enumerated per cluster has been reduced from 12 to 8, as standard errors from NRVA 2005 suggested that this would produce an economy of survey resources with little reduction in precision of the standard errors.
Analytical domains, Stratification of the Frame
The analytical domains (or, the strata, areas at which we wish the data to be statistically representative) were 45 in total in NRVA 2005, and this was increased to 46 in 2007-08 (Table 2).
Table 2 Analytical domain structure for NRVA 2005 and 2007
NRVA 2005 NRVA 2007
Provincial analytical domains
34 domains for each 34 provinces of rural or small urban populations
34 domains for each 34 provinces of rural or small urban populations
Urban analytical domains 10 urban domains from 10 provinces with the highest urban populations.
11 urban domains from 11 provinces with the highest provincial centre urban populations. Nomadic pastoralists
In both 2005 and 2007-08, the NRVA sample design stratified on each of the provinces, and then further stratified by urban and rural several of the more populous provinces. The design for both 2005 and 2007-08 entailed sorting provinces by the total number of urban households in the province. In 2005, the ten provinces with the greatest number of urban households were then stratified into urban and rural areas. At this time, there was no data available on the urban population for Helmand, and it was therefore not stratified by an urban and rural split. Since then, Helmand was enumerated, and for the 2007-08 design, it was determined that Helmand has a level of urban population that warrants its own urban analytical domain. The primary change made in the 2007-08 design then is that 11 provinces (the 10 from 2005 plus Helmand) are stratified by urban and rural areas, resulting in 22 strata. The stratification in both designs was based on the CSO definition of urban from the 2003-05 household listing. Table 3 lists each of the provinces that have urban and rural strata.
Table 3 Number of households in the most urban populated provinces
Province Urban HHs Centre Urban HHs Urban domains 2005 Urban domains 2007
KABUL 313,680 313,136 √ √
HIRAT 76,423 66,760 √ √
BALKH 71,151 61,227 √ √
KANDAHAR 54,378 54,378 √ √
Table 1 Areas not enumerated for pre-census household listing
Province District and District number
Kandahar Arghestan (13) Kandahar Ghorak (6) Kandahar Maroof (14) Kandahar Myanesheen (15) Kandahar Nish (16) Kandahar Reig (10)
NANGARHAR 31,800 31,289 √ √
BAGHLAN 23,727 16,532 √ √
KUNDUZ 25,685 16,219 √ √
JAWZJAN 19,187 14,379 √ √
HELMAND 13,907 12,859 √
FARYAB 16,870 11,235 √ √
TAKHAR 17,201 10,508 √ √
Source: CSO/UNFPA pre-census household listing 2003-2005
The remaining 23 provinces, with the lowest population of urban households, were not stratified by urban and rural areas. Each of these provinces is a separate stratum, resulting in 23 more strata. There are households that are classified as urban in the CSO household listing in the other remaining 23 provinces, but they do not belong to there own urban stratum. For the purposes of sampling, households in these 23 provinces are neither classified as urban or rural, just as belonging to the province stratum. These urban households are in small districts or provincial centres and are not thought to be representative of a typical urban lifestyle that is significantly different from that of rural settled households.1
Two-stage selection process
Within each of the 45 strata, households were selected following a two-stage design. In the first stage, CSO enumeration areas, the primary sampling units (PSUs), were selected with probability proportional to the estimated number of households (ratio of number of households in PSU to number of households in the stratum). Then in the second stage, 8 households were selected as the ultimate sampling units from each PSU (each selected with probability equal to 8 over the number of households in the PSU). The overall probability of household selection then is the product of the probability from the first stage and the second stage. In the second stage, there was no follow up listing procedure, so the product is a constant within each stratum. Random selection was based on a fixed-interval, random-start point procedure.
The number of PSU’s per stratum was chosen to ensure robust representativeness for the smaller provinces. No stratum has fewer than 240 households, the largest stratum has 1,344 households. The resulting sample is a total of 2,441 PSU’s selected creating a household sample of 19,528 from the settled urban and rural population for which there are 32 PSU’s selected that do not have complete household listing (i.e. PSU’s selected in the non-listed areas as detailed in Table 1). In addition to this, an estimated 131 PSUs (1,048 households) will be sampled in three waves starting from late summer 2007 through early summer 2008 to capture the Kuchi (nomadic) population.
PSUs selected in those areas that were not enumerated in the household listing may still be in areas of poor security for some of the survey period. However, security is fluid, and to simply exclude PSU’s in these areas with no household listing enumeration at the outset would be undesirable given the objective to obtain nationally representative estimates. The security situation at the time of planning the sample does not necessarily mean that the security situation will not improve at some point in 12 months survey period. Therefore the sample will assume that there is the potential to enumerate all areas and create a relatively flexible system for giving maximum opportunity for insecure areas to be enumerated at some point in the 12 month survey.
1 The NRVA data files allow the analyst to decide whether to identify these households as rural or urban. The data file
Calculation of weights, probability of selection and post-stratification
The expansion factor used at the household level, Whsq, expands the sample to the population of households. Similarly,
the expansion factor whsq, is for use in household-level files and expands the sample to the population of individuals. The
factors are estimated as:
Whsq= [prob(PSU)*prob(USU)] * [0.25*POPs,2008] / ∑hsq HHSIZEhsq
whsq= Whsq * HHSIZEhsq
where h identifies the household, s identifies the stratum, and q identifies the calendar quarter. The term in the first square brackets is the product of the probabilities of selection in each of the two stages. The term in the second square brackets is the CSO population estimate for 2008 based on the 2003-05 pre-census household listing and CSO
projections. This is part of an post-stratification adjustment to the probability of selection, ensuring that sample-based population estimates correspond to CSO population estimates. Population is divided by 4 to uniformly allocate the population to each quarter of the year (assuming away seasonal international migration). The denominator, HHSIZEhsq is
the size of household h in stratum s sampled in quarter q. The denominator gives the total number of sample, non-Kuchi individuals in each stratum by quarter. The adjustment term in the numerator gives the population of individuals for each stratum by quarter as estimated by CSO household listing of the non-Kuchi population.2
Household listing for PSUs without household listing data
The PSU’s that do not have a household listing include those areas that were too insecure during households listing to be enumerated, and Kuchi (nomad) communities. For PSUs sampled where there is no household listing information, then the household listing is not available and households cannot be drawn ex-ante from the sample frame.
There will be two separate methodologies followed: one for the areas that were insecure during the household listings, and one for the Kuchi communities.
For areas that were insecure in the household listings:
The fact that the PSUs without the household listing still tend to be in the insecure areas is part of the reason for adopting the simple method outlined below of developing a random start with sample interval for selecting households within PSUs (rather than an in-situ listing which takes time and draws unwanted attention to the survey teams in the village).
The procedure of developing a sample of random households from PSUs without a listing is outlined below.
Obtain as reliable as possible, and estimate of the number of occupied dwellings in the village. This can be cross referenced with the estimates previously provided by Shura members to CSO. Numbers are not expected to be exactly the same, but of a similar order of magnitude. If there is a huge difference between the two, further probing to try and understand the differences in the two numbers could be valuable in ensuring that the current estimate of the number of occupied households is realistic.
Once the estimate of occupied households has been determined, refer to Annex 1 table row below with the appropriate household number to determine maximum random start and sampling interval.
Randomly select a start number between 1 and the max start number indicated in the right-hand column. To do this use random number generator on a calculator to produce a number between zero and one, and then multiply this by the maximum start number. This provides the starting household number. Use the sampling interval on the same row and then select seven other households.
2
If the number of households in the rural village is greater than 1000, then calculate the maximum start number and the interval by dividing the total number of households by 8. For example 1324/8=165.5 = 8*165 + 4. Therefore the maximum start number equals 165+4 = 169.
If a household is empty, or the household members do not wish to be interviewed, go to the next nearest house and conduct the household questionnaire there.
For Kuchi communities:
For Kuchi communities we will first determine the number of communities in a district from the District Authorities, and then randomly select the communities to be enumerated. Once in the selected communities we will draw up a list of the household from speaking with the head of the community, then randomly select the households to interview.
This process is described in detail later in this document.
Household identification for PSUs with household listing
Eight households are randomly selected per cluster based upon the household population for each selected PSU from the household listing based sample. The households are selected in a similar way to the procedure for PSUs without a listing, with a random start within the sample interval range, but using the total number of households as recorded in the household listing database. The number of the household is pre-printed on the tracking sheet for the PSU, then CSO staff find the appropriate hard-copy of the listing forms and write the name of the head of household to facilitate specific house identification in the PSU. (The household number but not the household head name was entered in the listing database, so looking manually at the listing sheets is required to get the correct household head name.) This improves upon procedures in the NRVA 2005, where a database with the head of household names was not available as the household listing was still underway.
Replacement households-within-cluster
Four reserve households are also drawn at the same time and printed on the cluster tracking form Every time a reserve household is used, the reason for not using the original household sample has to be fully described on the cluster tracking sheet. Random checks of enumeration areas and reasons for not sampling selected households will be conducted by survey supervisors.
Replacement clusters-within-domain
Of the 2,441 non-Kuchi PSUs in the sample design, only 68 were replacement PSUs (less than 3% replacement). The majority of these replacements were due to reasons of insecurity. Replacement PSUs were almost always PSUs in the nearest secure district. Accepted reasons for replacing a cluster within the domain:
Persistent poor security preventing enumerator access.
Prolonged lack of access due to very long term winter conditions (unlikely occurrence).
Change of use of most of the households in the cluster to non-residential purposes, i.e. businesses, shops, etc. Surveyors not granted permission by village elders to conduct the survey despite district supervisor making a second visit for further explanation of the purpose of the survey.
Of the four reasons above for a PSU not being able to be surveyed, the change of use is the only one that justified an immediate replacement PSU without further investigation or opportunity for sampling at another point within the survey schedule.
Strategy for dealing with PSUs that are temporarily or permanently inaccessible
The low replacement rate for PSUs was in part due to a flexible strategy for dealing with lack of access due to security or weather issues. Both of these causes are unpredictable and variable as to when and where they will prevent access to PSUs, although both have times of year when it is more likely. Therefore a strategy was followed that provided the maximum opportunity for these PSUs to be sampled at some point in the survey calendar. In the best case scenario, the factors that make a PSU inaccessible are not permanent, and most, if not all these PSUs will become available at some point during the year survey period. The simplest sampling strategy with PSUs that are inaccessible at the time they are meant to be enumerated would be to skip them, and hope that they become available at some point during the year-long survey.
representativeness and seasonal sampling balance within an analytical domain. Within a three month period, the procedures for accommodating inaccessible PSUs would be the following:
• If a PSU is not accessible at the scheduled time, skip that PSU and move onto enumerate the next PSU in the schedule. Record this information.
• Monitor the conditions that prevented the initial visit to the PSU taking place, and should they change to the extent that it is now possible to enumerate the PSU that you have skipped within this same quarter, go back and enumerate that PSU as soon as conditions allow. This will ensure that the time delay between the scheduled and the actual enumeration time is minimised wherever possible. • At the end of the fieldwork quarter, any PSUs that remained inaccessible until the end of the quarter,
will be considered as to whether they are likely to continue to be inaccessible or that conditions will change to permit them to be enumerated in the next quarter.
• Those PSUs that are now accessible for the next quarter of survey should be reintroduced to the schedule. They should be enumerated towards the beginning of the next quarter because this will reduce the delay between the original schedule and actual enumeration.
• If there are PSUs for which it is considered that will not be accessible at the very least in the next quarter, replacement PSUs should be drawn, adhering to the principle to maintain the
representativeness and balance of the analytical domain and season effects within the national sample. • Replacement PSUs should be drawn randomly from within the same district (for rural populations)and
urban district-nahia for urban populations. These replacement PSU’s should be drawn from the shadow sample which is created in the same way as the original sample, but with a different seed random start.
The benefits of such a scheme are that:
• The flexible strategy allows for enumeration of inaccessible PSUs as soon as they become accessible. • Replacement PSUs are distributed relatively evenly across seasons for all analytical domains where they
are required.
• The shadow sampling scheme maintains the appropriate number of PSUs per district or nahia.
Strategy for the selection of Kuchi communities
Due to their nomadic nature, sampling Kuchi communities during their annual migrations is not practical. However, there are two times in the year when the locations of the Kuchi communities are most stable; winter, probably the most predictable time for finding Kuchi communities; and summer, when most communities have reached their final summer grazing location. Therefore the NRVA 2007-08 samples Kuchi communities both in winter and in summer locations during the 12 months survey, dividing into three waves. As the surveys started in late summer 2007, the summer sample will be split between late summer 2007 and early summer 2008, with a full winter sample taken in the winter 2007-08. That is, half of the Kuchi sample was interviewed in the winter while a quarter in summer 2007 and summer 2008 respectively. This sampling design follows the procedure developed during the NRVA 2005; but it was extended to accommodate the year-round nature of the NRVA 2007-08.
The sampling design of for NRVA Kuchi communities was based on the 2004 National Multi-sectoral Assessment on Kuchi (NMAK). It gives an indication of how many Kuchi communities are in each district during the summer and winter. Migratory patterns change according to climate and land conflicts. Therefore rather than trying to draw a sample based upon the predicted number of Kuchi communities per district, and run the risk that this information is not accurate, we use the sample frame to draw a list of PSUs. The sampling strategy intended to sample 70 PSUs in the summer and 70 PSUs in winter to provide sufficient households to have a representative sample further nomadic Kuchi analytical domain. The actual number of Kuchi PSUs is 131, yielding an effective sample size of more than 1,000 households.
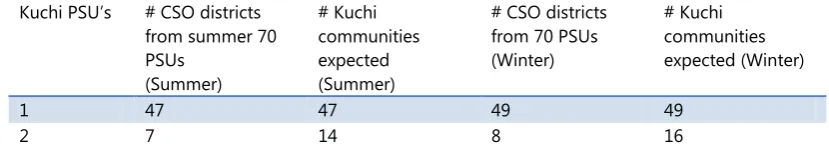
The Kuchi community sample was selected as follow. (1) a sample of 70 PSUs in the summer and 70 PSUs in winter was drawn from the NMAK sampling frame. Table 4 indicates for both summer & winter, the number of districts where it was expected to find the 70 randomly selected PSUs. (2) Districts to visit were determined from the selected Kuchi community PSUs. The summer sample of 70 PSUs was drawn, and found to be in 57 separate districts, while the winter sample of 70 PSU’s was drawn from 58 separate districts (Table 4). It is important to note that the combined summer and winter location sample frame is ordered in terms of either winter or summer location districts for the respective winter or summer sample to be drawn. This is to ensure that the sampling interval moves through the population in the geographically ordered way that is applied in the sample procedures for other analytical domains of the settled population.
Table 4 List of the number of PSU’s per districts selected for the summer & winter Kuchi sample Kuchi PSU’s # CSO districts
3 3 9 0 0
4 0 0 0 0
5 0 0 1 5
Total 57 70 58 70
It is not expected that the number of PSU’s as predicted by of the 2004 NMAK sample frame will be encountered. Therefore, after visiting the district, it was determined how many Kuchi communities are actually present before a decision is made on the number of Kuchi communities to sample in that district. The strategy to split late summer 07 and early summer 08 provided an opportunity to modify the second sampling depending upon the number of communities encountered in the 1st summer round. The list of 57 districts chosen for would-be enumeration of the Kuchi summer component has been randomly split into two parts, with the intention of visiting one half of the districts in the summer of 2007 and the other half in the summer of 2008. The lists of the Kuchi districts expected to be sampled are presented in Table 5.
A second list of 70 PSU’s drawn from the sample frame with the unique districts was drawn for the winter sample.
Selection of Kuchi communities within districts
Upon their arrival into a district, fieldworkers wrote up a list of all Kuchi communities in the district, using Form KUCHI-1. Once the team felt the information on the name and number of Kuchi communities in the district was complete, the called in the information by phone to the Kabul headquarters survey coordinator. The list was drawn up in consultation with knowledgeable officials in the district center and any Kuchi Shura representatives. This process does not require travel within the district. If there are no Kuchi communities at all in the district, there is no alternative sampling proposed.
Although the order of the communities in the list is immaterial, it is good practice to ask fieldworkers to draw the list in a certain systematic way. It was proposed to record the Kuchi communities within the district in increasing distance from the district center. During the telephone call to headquarters, the Kabul office selected one or more Kuchi communities in the district, and then these selections were communicated to the fieldworkers immediately.
Procedure for determining number and identity of within district Kuchi community sample when there is no telephone reception
• Number the Kuchi communities in the list with serial numbers from 1 to N.
• If N is less than or equal to 15, then select a random integer between 1 and N. If N is greater than 15, then select a random integer between 1 and 15. Call R the random integer so selected.
• Select Kuchi Community Number R:
• If R+15 is less or equal N, select a 2nd Kuchi Community Number R+15.
• If R+30 is less or equal N, Select a 3rd at Kuchi Community Number R+30, and so forth.
The expectation from the information on the summer location of Kuchi communities from the 2004 NAMAK sample frame is that this selection procedure should give a sample size of 35 communities in each half summer sampling round, i.e. late summer 2007 and early summer 2008.
Selection of tents within a Kuchi community when there is no mobile telephone reception
Fieldworkers will draw up the list of all tents (households) in the selected communities using Form KUCHI-2. It is expected that this list can be drawn in consultation with knowledgeable persons in the community. It does not require visiting all the tents in the community. Fieldworkers then selected the eight tents to be interviewed as follows:
• Number the tents in the list with serial numbers from 1 to N.
• Divide N by 8, and keep one decimal. Call the result “the sampling step” (S). • Select a random integer between 1 and S. Call this number “the random start” (R). • Compute numbers R, R+S, R+2S, …, R+7S, keeping one decimal.
• The numbers of the selected tents are the integer of the above numbers.
Tent selection example
• There are 90 tents in the community, N=90 • S=N/8 =90/8 = 11.25 =11.3 to 1 decimal place
Selection of tents within a Kuchi community when there is mobile telephone reception in the community or close to it.
Fieldworkers will draw-up the list of all tents (households) in the selected communities using Form KUCHI-2. It is expected that this list can be drawn in consultation with knowledgeable persons in the community. It does not require visiting all the tents in the community. After construction of the list, the Kabul office was telephoned, who then provided the identities of the households to be surveyed. An Excel program that would generate the random selection of
communities within district and households within Kuchi community has been written, and this was used when the surveyor's phone in from the district for the number and identity of Kuchi communities to be enumerated, and also when they phone in from the actual Kuchi community for the identity of the households to be enumerated. Surveyors were encouraged to use the telephone procedure over the manual procedure wherever possible. For example, if mobile telephone reception was not available in the community but was available nearby, the surveyors were encouraged to call Kabul for selections.
Calculation of Kuchi weights -
For Kuchi households we simply post-stratify to ensure that sample-estimates match the NMAK-based population estimates. By design, the Kuchi selection process is meant to be self-weighting (uniform weights across the Kuchi sample), and under the assumption that the process succeeded in a self-weighted design, our expansion factors are estimated as:
Whw= [α * POPNMAK] / ∑hw HHSIZEht (household expansion factor, hh_weight)
where POPNMAK is the Kuchi population estimate from the National Multi-sectoral Assessment on Kuchi (NMAK) in 2004,
Table 5 Districts to be sampled for Kuchi in late summer 2007 and early summer 2008 Late summer of 2007
District
Early summer of 2008 District
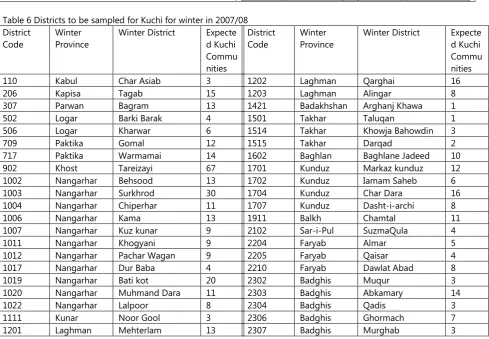
Table 6 Districts to be sampled for Kuchi for winter in 2007/08 District
1004 Nangarhar Chiperhar 11
1006 Nangarhar Kama 13
1421 Badakhshan Arghanj Khawa 1
1501 Takhar Taluqan 1
1514 Takhar Khowja Bahowdin 3
1515 Takhar Darqad 2
1602 Baghlan Baghlane Jadeed 10
District Code
Winter Province
Winter District Expecte d Kuchi Commu nities
2402 Hirat Enjil 6
2406 Hirat Kushk 11
2411 Hirat Adraskan 41
2416 Hirat Kishk-i-Kahna 15
2501 Farah Farah 7
2504 Farah Anar Dara 4
2509 Farah Bala Blook 8
2604 Nimroz Chakhansoor 5
2703 Hilmand Nad Ali 4
District Code
Winter Province
Winter District Expecte d Kuchi Commu nities
2708 Hilmand Bughran 3
2710 Hilmand Naw zad 12
2806 Kandahar Ghorak 2
2812 Kandahar Espeen Boldak 9
2902 Zabul Shah Joi 9
2908 Zabul Shinkay 5
11
Annex 1 Table for selecting sampling interval