60 Information Systems Research 3 : 1
Information Systems Success: The Quest for the
Dependent Variable
William H. DeLone Department of Management
The American University Washington, D.C. 20016
Ephraim R. McLean Computer Information Systems
Georgia Stale University Atlanta. Georgia 30302-4015
A large number of studies have been conducted during the last decade and a half attempting to identify those factors that contribute to information systems success. However, the dependent variable in these studies—I/S success —has been an elusive one to define. Dilferent researchers have addressed different aspects of success, making comparisons difficult and the prospect of building a cumulative tradition for I/S research similarly elusive. To organize this diverse research, as well as to present a more integrated view of the concept of I/S success, a comprehensive taxonomy is introduced. This taxonomy posits six major dimensions or categories of I/S success—SYSTEM QUALITY, INFORMATION QUALITY, USE, USER SATISFACTION, INDIVIDUAL IMPACT, and ORGANIZATIONAL IMPACT. Using these dimensions, both conceptual and empirical studies are then reviewed (a total of 180 articles are cited) and organized according to the dimensions of the taxonomy. Finally, the many aspects of I/S success are drawn together into a descriptive model and its implications for future I/S research are discussed.
Information systems success—Information systems assessment—Measurement
Introduction
t the first meeting of the International Conference on Information System (1CIS) in 1980, Peter Keen identified five issues which he felt needed to be resolved in order for the field of management information systems to establish itself as a coherent research area. These issues were:
A
(1) What are the reference disciplines for MIS? (2) What is the dependent variable?
(3) How does MIS establish a cumulative tradition?
(4) What is the relationship of MIS research to computer technology and to MIS practice?
(5) Where should MIS researchers publish their findings?
Information Systems Success
March 1992 6!
Of the five, the second item, the dependent variable in MIS research, is a particularly important issue. If information systems research is to make a contribution to the world of practice, a well-defined outcome measure (or measures) is essential. It does little good to measure various independent or input variables, such as the extent of user participation or the level of I/S investment, if the dependent or output variable —I/S success or MIS
effectiveness—cannot be measured with a similar degree of accuracy.
The importance of defining the I/S dependent variable cannot be overemphasized. The evaluation of I/S practice, policies, and procedures requires an I/S success measure against which various strategies can be tested. Without a well-defined dependent variable, much of I/S research is purely speculative.
In recognition of this importance, this paper explores the research that has been done involving MIS success since Keen first issued his challenge to the field and attempts to synthesize this research into a more coherent body of knowledge. It covers the formative period 1981-87 and reviews all those empirical studies that have attempted to measure some aspects of “MIS success” and which have appeared in one of the seven leading publications in the I/S field. In addition, a number of other articles are included, some dating back to 1949, that make a theoretical or conceptual contribution even though they may not contain any empirical data. Taken together, these 180 references provide a representative review of the work that has been done and provide the basis for formulating a more comprehensive model of I/S success than has been attempted in the past.
A Taxonomy of Information Systems Success
Unfortunately, in searching for an I/S success measure, rather than finding none, there are nearly as many measures as there are studies. The reason for this is understandable when one considers that “information,” as the output of an information system or the message in a communication system, can be measured at different levels, including the technical level, the semantic level, and the effectiveness level. In their pioneering work on communications. Shannon and Weaver (1949) defined the technical level as the accuracy and efficiency of the system which produces the information, the semantic level as the success of the information in conveying the intended meaning, and the effectiveness level as the effect of the
information on the receiver.
Building on this. Mason (1978) relabeled “effectiveness” as “influence” and defined the influence level of information to be a “hierarchy of events which take place at the receiving end of an information system which may be used to identify the various approaches that might be used to measure output at the influence level” (Mason 1978, p. 227). This series of influence events includes the receipt of the information, an evaluation of the information, and the application of the information, leading to a change in recipient behavior and a change in system performance.
Information Systems Success
March 1992 6!
to the measurement of information systems suggests therefore that there may need to be separate success measures for each of the levels of information.
In Figure 1, the three levels of information of Shannon and Weaver are shown, together with Mason’s expansion of the effectiveness or influence level, to yield six distinct categories or aspects of information systems. They are SYSTEM QUALITY, INFORMATION
QUALITY, USE, USER SATISFACTION, INDIVIDUAL IMPACT, and ORGANIZATIONAL IMPACT.
Looking at the first of these categories, some I/S researchers have chosen to focus on the desired characteristics of the information system itself which produces the information {SYSTEM QUALITY). Others have chosen to study the information product for desired characteristics such as accuracy, meaningfulness, and timeliness (INFORMATION QUALITY). In the influence level, some researchers have analyzed the interaction of the information product with its recipients, the users and/or decision makers, by measuring USE or USER SATISFACTION. Still other researchers have been interested in the influence which the information product has on management decisions (INDIVIDUAL IMPACT). Finally, some I/S researchers, and to a larger extent I/S practitioners, have been concerned with the effect of the information product on organizational performance
(ORGANIZATIONAL IMPACT).
Once this expanded view ofl/S success is recognized, it is not surprising to find that there are so many different measures of this success in the literature, depending upon which aspect of I/S the researcher has focused his or her attention. Some of these measures have been merely identified, but never used empirically. Others have been used, but have employed different measurement instruments, making comparisons among studies difficult.
Two previous articles have made extensive reviews of the research literature and have reported on the measurement of MIS success that had been used in empirical studies up until that time. In a review of studies of user involvement, Ives and Olson (1984) adopted two classes of MIS outcome variables: system quality and system acceptance. The system acceptance category was defined to include system usage, system impact on user behavior, and information satisfaction. Half a decade earlier, in a review of studies of individual differences, Zmud (1979) considered three categories of MIS success: user performance, MIS usage, and user satisfaction.
Both of these literature reviews made a valuable contribution to an understanding of MIS success, but both were more concerned with investigating independent variables (i.e., user involvement in the case of Ives and Olson and individual differences in the case of Zmud) than with the dependent variable (i.e., MIS success). In contrast, this paper has the
Shannon and
Technical Semantic Effectiveness or Influence
Level Level Level
Weaver (1949)
Influence Influence
Mason Production Product Receipt on on
(1978) Recipent System
Categories of I/S Success
System
Quality Information Use User Quality Satisfaction Individual Impact
Organization al
Impact
Information Systems Success
March 1992 6!
measurement of the dependent variable as its primary focus. Also, over five years have passed since the Ives and Olson study was published and over ten years since Zmud’s article appeared. Much work has been done since these two studies, justifying an update of their findings.
To review this recent work and to put the earlier research into perspective, the six categories ofl/S success identified in Figure 1—SYSTEM QUALITY, INFORMATION QUALITY, INFORMATION USE. USER SATISFACTION, INDIVIDUAL IMPACT, AND ORGANIZATIONAL IMPACT—are used in the balance of this paper to organize the I/S research that has been done on 1/S success.
In each of the six sections which follow, both conceptual and empirical studies are cited. While the conceptual citations are intended to be comprehensive, the empirical studies are intended to be representative, not exhaustive. Seven publications, from the period January 1981 to January 1988, were selected as reflecting the mainstream of I/S research during this formative period. Additional studies, from other publications, as well as studies from the last couple of years, could have been included; but after reviewing a number of them, it became apparent that they merely reinforced rather than modified the basic taxonomy of this paper.
In choosing the seven publications to be surveyed, five (Management Science. MIS Quarterly, Communications of the ACM, Decision Sciences, and In formation & Mam agement) were drawn from the top six journals cited by Hamilton and Ives (1983) in their study of the journals most respected by MIS researchers. (Their sixth journal. Transactions on Database Systems, was omitted fromthisstudy because ofits specialized character.) To these five were added the Journal of MIS, a relatively new but important journal, and the I CIS Proceedings, which is not a journal per se but represents the published output of the central academic conference in the 1/S field. A total of 100 empirical studies are included from these seven sources.
As with any attempt to organize past research, a certain degree of arbitrariness occurs. Some studies do not fit neatly into any one category and others fit into several. In the former case, every effort was made to make as close a match as possible in order to retain a fairly parsimonious framework. In the latter case, where several measures were used which span more than one category (e.g., measures of information quality and extent of use and user satisfaction), these studies are discussed in each of these categories. One consequence of this multiple listing is that there appear to be more studies involving I/S success than there actually are.
To decide which empirical studies should be included, and which measures fit in which categories, one of the authors of this paper and a doctoral student (at another university) reviewed each of the studies and made their judgments independently. The interrater
agreement was over 90%. Conflicts over selection and measure assignment were resolved by the second author.
Del,one • McLean
5 Information Systems Research 3 : I
are somewhat arbitrary, as is true of almost all attempts to organize an extensive body of research on a retrospective basis.
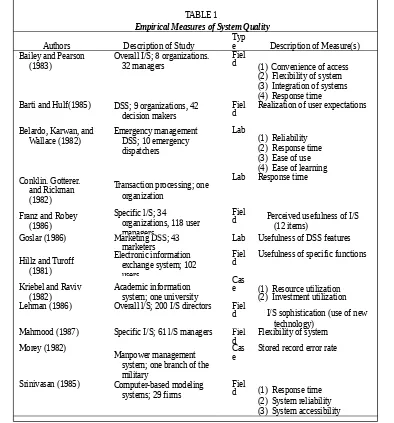
System Quality: Measures of the Information Processing System Itself
In evaluating the contribution of information systems to the organization, some I/S researchers have studied the processing system itself. Kriebel and Raviv (1980, 1982) created and tested a productivity model for computer systems, including such performance measures as resource utilization and investment utilization, Alloway (1980} developed 26 criteria for measuring the success of a data processing operation. The efficiency of hardware utilization was among Alloway’s system success criteria.
Other authors have developed multiple measures of system quality. Swanson (1974) used several system quality items to measure MIS appreciation among user managers. His items included the reliability of the computer system, on-line response time, the ease of terminal use, and so forth. Emery (1971) also suggested measuring system characteristics, such as the content of the data base, aggregation of details, human factors, response time, and system accuracy. Hamilton and Chervany (1981) proposed data currency, response time, turnaround time, data accuracy, reliability, completeness, system flexibility, and ease of use among others as part of a “formative evaluation” scheme to measure system quality.
In Table 1 are shown the empirical studies which had explicit measures of system quality. Twelve studies were found within the referenced journals, with a number of distinct measures identified. Not surprisingly, most of these measures are fairly straightforward, reflecting the more engineering-oriented performance characteristics of the systems in question.
Information Quality: Measures of Information System Output
Rather than measure the quality of the system performance, other I/S researchers have preferred to focus on the quality of the information system output, namely, the quality of the information that the system produces, primarily in the form of reports. Larcker and Lessig (1980) developed six questionnaire items to measure the perceived importance and usableness of information presented in reports. Bailey and Pearson (1983) proposed 39 system-related items for measuring user satisfaction. Among their ten most important items, in descending order of importance, were information accuracy, output timeliness, reliability, completeness, relevance, precision, and currency.
In an early study, Ahituv (1980) incorporated five information characteristics into a multi-attribute utility measure of information value: accuracy, timeliness, relevance, aggregation, and formatting. Gallagher (1974) developed a semantic differential instrument to measure the value of a group of I/S reports. That instrument included measures of relevance,
DeLone • McLean
6 Information Systems Research 3 : 1
composite measure of information value. The proposed information attributes included sufficiency, understandability, freedom from bias, reliability, decision relevance, comparability, and quantitativeness.
More recently, numerous information quality criteria have been included within the broad area of “User Information Satisfaction” (livari 1987; livari and Koskela 1987). The Iivari-Koskela satisfaction measure included three information quality constructs:
"informativeness” which consists of relevance, comprehensiveness, recentness, accuracy, and credibility; “accessibility” which consists of convenience, timeliness, and interpretability; and “adaptability.”
In Table 2, nine studies which included information quality measures are shown.
Understandably, most measures of information quality are from the perspective of the user of this information and are thus fairly subjective in character. Also, these measures, while shown
TABLE 1
Empirical Measures of System Quality
Authors Description of Study Type Description of Measure(s)
Bailey and Pearson (1983)
Overall I/S; 8 organizations. 32 managers
Fiel
d (1) Convenience of access (2) Flexibility of system (3) Integration of systems (4) Response time Barti and Hulf(1985) DSS; 9 organizations, 42
decision makers
Fiel
d Realization of user expectations
Belardo, Karwan, and
d Perceived usefulness of I/S (12 items)
Goslar (1986) Marketing DSS; 43
marketers Lab Usefulness of DSS features
Hillz and Turoff
d Usefulness of specific functions
Kriebel and Raviv
Lehman (1986) Overall l/S; 200 I/S directors Fiel
d I/S sophistication (use of new technology)
Mahmood (1987) Specific I/S; 61 l/S managers Fiel
d Flexibility of system Morey (1982)
Manpower management system; one branch of the military
Cas
e Stored record error rate
Srinivasan (1985) Computer-based modeling systems; 29 firms
Fiel
d (1) Response time
Information Systems Success
March 1992 7
here as separate entities, are often included as part of the measurers of user satisfaction. The Bailey and Pearson (1983) study is a good example of this cross linkage.
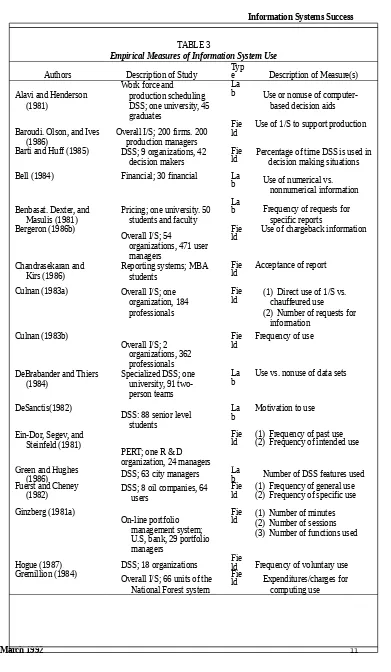
Information Use: Recipient Consumption of the Output of an Information System
The use of information system reports, or of management science/operations research models, is one of the most frequently reported measures of the success of an information system or an MS/OR model. Several researchers (Lucas 1973: Schultz and Slevin 1975; Ein-Dor and Segev 1978; Ives, Hamilton, and Davis 1980; Hamilton and Chervany 1981) have proposed I/S use as an MIS success measure in conceptual MIS articles. Ein-Dor and Segev claimed that different measures of computer success are mutually interdependent and so they chose system use as the primary criterion variable for their I/S research framework. “Use of system” was also an integral part of Lucas’s descriptive model of information systems in the context of organizations. Schultz and Slevin incorporated an item on the probability of MS/OR model use into their five-item instrument for measuring model success.
In addition to these conceptual studies, the use of an information system has often been the MIS success measure of choice in MIS empirical research (Zmud 1979). The broad concept of use can be considered or measured from several perspectives. It is clear that actual use, as a measure of I/S success, only makes sense for voluntary or discretionary users as opposed to captive users (Lucas 1978; Welke and Konsynski 1980). Recognizing this, Maish (1979) chose voluntary use of computer terminals and voluntary requests for additional reports as his measures of I/S success. Similarly, Kim and Lee (1986) measured voluntariness of use as part of their measure of success.
Some studies have computed actual use (as opposed to reported use) by managers through hardware monitors which have recorded the number of computer inquiries (Swanson 1974; Lucas 1973, 1978; King and Rodriguez 1978, 1981), or recorded the amount of user connect time (Lucas 1978; Ginzberg 1981a). Other objective measures of use were the number of computer functions utilized (Ginzberg 1981a), the number of client records processed (Robey 1979), or the actual charges for computer use (Gremillion 1984). Still other studies adopted a subjective or perceived measure of use by questioning managers about their use of an information system (Lucas 1973, 1975, 1978; Maish 1979; Fuerst and Cheney 1982; Raymond 1985; DeLone 1988).
Another issue concerning use of an information system is “Use by whom?” (Huys- mans 1970). In surveys of MIS success in small manufacturing firms, DeLone (1988) considered chief executive use of information systems white Raymond (1985) considered use by company controllers. In an earlier study, Culnan (1983a) considered both direct use and chaufFeured use (i.e., use through others).
DeLone • McLean
8 Information Systems Research 3 : 1
information not ordinarily provided in routine reports.” By this definition, specific use reflects a higher level of system utilization. Fuerst and Cheney (1982) adopted Schewe’s classification of general use and specific use in their study of decision support in the oil industry.
Bean etal. (1975); King and Rodriguez (1978, 1981), and DeBrabander and Thiers (1984) attempted to measure the nature of system use by comparing this use to the
TABLE 2
Empirical Measures of Information Quality
Authors Description of Study Typ
e Description of Measure(s)
(1984) Financial; one university.
16 MBA students
Lab Perceived usefulness of specific report items
d Perceived importance of each information item
King and Epstein (1983) Overall I/S; 2 firms, 76 managers
Mahmood (1987) Specific l/S; 61 I/S
managers Field (1) Report accuracy
(2) Report timeliness Mahmood and
Medewitz (1985)
DSS; 48 graduate students Lab Report usefulness
Miller and Doyle (1987) Overall I/S; 21 financial firms, 276 user managers
Fiel
d (1) Completeness of information (2) Accuracy of information (3) Relevance of reports (4) Timeliness of report Rivard and Huff(1985) User-developed l/S; 10
firms, 272 users
Fiel
d Usefulness of information
Srinivasan (1985) Computer-based modeling
DeLone • McLean
9 Information Systems Research 3 : I
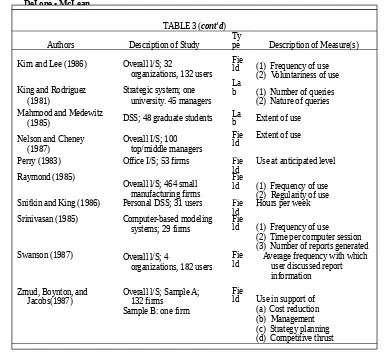
decision-making purpose for which the system was designed. Similarly, Iivari (1985) suggested appropriate use or acceptable use as a measure of MIS success. In a study by Robey and Zeller (1978), I/S success was equated to the adoption and extensive use of an information system.
After reviewing a number of empirical studies involving use, Trice and Treacy (1986) recommend three classes of utilization measures based on theories from reference disciplines: degree of MIS institutionalization, a binary measure of use vs. nonuse, and unobtrusive utilization measures such as connect time and frequency of computer access. The degree of institutionalization is to be determined by user dependence on the MIS, user feelings of system ownership, and the degree to which MIS is routinized into standard operating procedures.
Table 3 shows the 27 empirical studies which were found to employ system use as at least one of their measures of success. Of all the measures identified, the system use variable is probably the most objective and the easiest to quantify, at least conceptually. Assuming that the organization being studied is (1) regularly monitoring such usage patterns, and (2) willing to share these data with researchers, then usage is a fairly accessible measure of I/S success. However, as pointed out earlier, usage, either actual or perceived, is only pertinent when such use is voluntary.
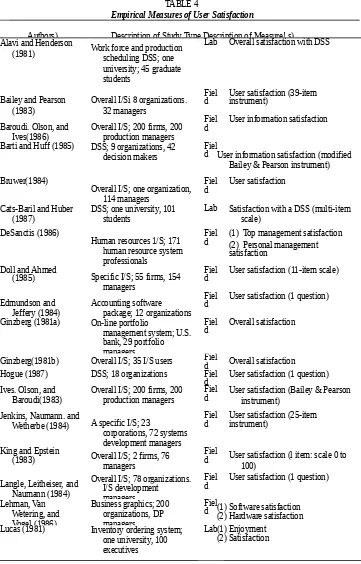
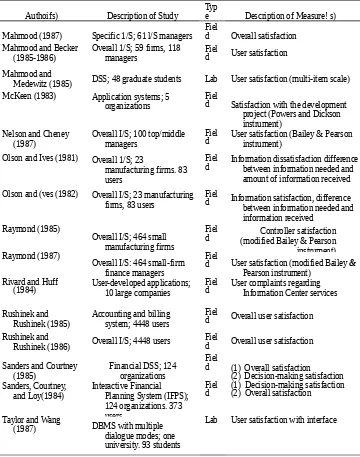
User Satisfaction: Recipient Response to the Use of the Output of an Information System
When the use of an information system is required, the preceding measures become less useful; and successful interaction by management with the information system can be measured in terms of user satisfaction. Several 1/S researchers have suggested user
satisfaction as a success measure for their empirical I/S research (Ein- Dor and Segev 1978; Hamilton and Chervany 1981). These researchers have found user satisfaction as especially appropriate when a specific information system was involved. Once again a key issue is
whose satisfaction should be measured. In attempting to determine the success of the overall MIS effort, McKinsey & Company (1968) measured chief executives’ satisfaction.
In two empirical studies on implementation success, Ginzberg (1981a, b) chose user satisfaction as his dependent variable. In one of those studies (1981a), he adopted both use and user satisfaction measures. In a study by Lucas (1978), sales representatives rated their satisfaction with a new computer system. Later, in a different study, executives were asked in a laboratory setting to rate their enjoyment and satisfaction with an information system which aided decisions relating to an inventory ordering problem (Lucas 1981).
In the Powers and Dickson study on MIS project success (1973). managers were asked how well their information needs were being satisfied. Then, in a study by King and Epstein (1983). I/S value was imputed based on managers’ satisfaction ratings. User satisfaction is also recommended as an appropriate success measure in experimental I/S research (Jarvenpaa, Dickson, and DeSanctis 1985) and for researching the effectiveness of group decision support systems (DeSanctis and Gallupe 1987).
Other researchers have developed multi-attribute satisfaction measures rather than relying on a single overall satisfaction rating. Swanson (1974) used 16 items to measure I/S
DeLone • McLean
10 Information Systems Research 3 : t
(DSS) success. Sanders’ overall success measure involves a number of measures of user and decisionmaking satisfaction.
Finally, studies have found that user satisfaction is associated with user attitudes toward computer systems (Igerhseim 1976; Lucas 1978) so that user-satisfaction measures may be biased by user computer attitudes. Therefore, studies which include user satisfaction as a success measure should ideally also include measures of user attitudes so that the potentially biasing effects of those attitudes can be controlled for in the analysis. Goodhue (1986) further suggests “information satisfactoriness” as an antecedent to and surrogate for user satisfaction. Information satisfactoriness is defined as the degree of match between task characteristics and I/S functionality.
As the numerous entries in Table 4 make clear, user satisfaction or user information satisfaction is probably the most widely used single measure of I/S success. The reasons for this are at least threefold. First, “satisfaction" has a high degree of face validity. It is hard to deny the success of a system which its users say that they like. Second, the development of the Bailey and Pearson instrument and its derivatives has provided a reliable tool for measuring satisfaction and for making comparisons among studies. The third reason for the appeal of satisfaction as a success measure is that most of the other measures are so poor; they are either conceptually weak or empirically difficult to obtain.
Individual Impact: The Effect of Information on the Behavior of the Recipient Of all the measures of I/S success, “impact" is probably the most difficult to define in a nonambiguous fashion. It is closely related to performance, and so “improving my—or my department’s—performance” is certainly evidence that the information system has had a positive impact. However, "impact” could also be an indication that an information system has given the user a better understanding of the decision context, has improved his or her decision-making productivity, has produced a change in user activity, or has changed the decision maker’s perception of the importance or usefulness of the information system. As discussed earlier. Mason (1978) proposed a hierarchy of impact (influence) levels from the receipt of the information, through the understanding of the information, the application of the information to a specific problem, and the change in decision behavior, to a resultant change in organizational performance. As Emery (1971, p. 1) states: “information has no intrinsic value; any value comes only through the influence it may have on physical events. Such influence is typically exerted through human decision makers.”
Information Systems Success
March 1992 11
TABLE 3
Empirical Measures of Information System Use
Authors Description of Study Type Description of Measure(s)
Alavi and Henderson (1981)
Work force and production scheduling DSS; one university, 45 graduates
La
b Use or nonuse of computer-based decision aids
Baroudi. Olson, and Ives (1986)
Overall I/S; 200 firms. 200 production managers
Fie
ld Use of 1/S to support production
Barti and Huff (1985) DSS; 9 organizations, 42 decision makers
Fie
ld Percentage of time DSS is used indecision making situations
Bell (1984) Financial; 30 financial La
b Use of numerical vs.
b Frequency of requests for specific reports
ld Use of chargeback information
Chandrasekaran and
Culnan (1983a) Overall I/S; one
organization, 184 professionals
Fie
ld (1) Direct use of 1/S vs. chauffeured use (2) Number of requests for
information
b Use vs. nonuse of data sets
DeSanctis(1982)
DSS: 88 senior level students
ld (1) Frequency of past use(2) Frequency of intended use
Green and Hughes
(1986) DSS; 63 city managers Lab Number of DSS features used
Fuerst and Cheney
(1982) DSS; 8 oil companies, 64 users Field (1) Frequency of general use(2) Frequency of specific use
Ginzberg (1981a)
On-line portfolio management system; U.S, bank, 29 portfolio managers
Fie
ld (1) Number of minutes(2) Number of sessions (3) Number of functions used
Hogue (1987) DSS; 18 organizations Field Frequency of voluntary use
Gremillion (1984)
Overall I/S; 66 units of the National Forest system
Fie
DeLone • McLean
12 Information Systems Research 3 : t
methodology using questionnaire items relating to resulting decision effectiveness. For example, one questionnaire item referred specifically to the subject's perception of the improvement in his or her decisions.
In the information system framework proposed by Chervany, Dickson, and Kozar (1972), which served as the model for the Minnesota Experiments (Dickson. Chervany, and Senn 1977), the dependent success variable was generally defined to be decision effectiveness. Within the context of laboratory experiments, decision effectiveness can take on numerous dimensions. Some of these dimensions which have been reported in laboratory studies include the average time to make a decision (Benbasat and Dexter 1979, 1985; Benbasat and Schroeder 1977; Chervany and Dickson 1974; Taylor 1975), the confidence in the decision made (Chervany and Dickson 1974; Taylor 1975), and the number of reports requested (Benbasat and Dexter 1979; Benbasat and Schroeder 1977). DeSanctis and Gallupe (1987) suggested member participation in decision making as a measure of decision effectiveness in group decision making.
In a study which sought to measure the success of user-developed applications, Rivard and Huff (1984) included increased user productivity in their measure of success. DeBrabander and Thiers (1984) used efficiency of task accomplishment (time required to find a correct answer) as the dependent variable in their laboratory
TABLE 3 (cont'd)
Authors Description of Study Type Description of Measure(s)
Kim and Lee (1986) Overall l/S; 32
organizations, 132 users Fie
ld (1) Frequency of use (2) Voluntariness of use
b (1) Number of queries (2) Nature of queries Mahmood and Medewitz
(1985) DSS; 48 graduate students Lab Extent of use
Nelson and Cheney
Perry (1983) Office I/S; 53 firms Fie
ld Use at anticipated level Raymond (1985)
Overall l/S; 464 small manufacturing firms
Fie
ld (1) Frequency of use (2) Regularity of use
Snitkin and King (1986) Personal DSS; 31 users Fie
ld Hours per week
Srinivasan (1985) Computer-based modeling
systems; 29 firms
Fie
ld (1) Frequency of use (2) Time per computer session (3) Number of reports generated
Swanson (1987) Overall l/S; 4
organizations, 182 users Fie
ld Average frequency with which user discussed report information
Zmud, Boynton, and Jacobs(1987)
Overall l/S; Sample A; 132 firms
Sample B: one firm
Fie
DeLone • McLean
13 Information Systems Research 3 : !
TABLE 4
Empirical Measures of User Satisfaction
Authors) Description of Study Type Description of Measure! s) Alavi and Henderson
(1981) Work force and production scheduling DSS; one university; 45 graduate students
Lab Overall satisfaction with DSS
Bailey and Pearson (1983)
Overall I/Si 8 organizations. 32 managers
Fiel
d User satisfaction (39-item instrument)
Baroudi. Olson, and Ives(1986)
Overall I/S; 200 firms, 200 production managers
Fiel
d User information satisfaction
Barti and Huff (1985) DSS; 9 organizations, 42 decision makers
Fiel
d User information satisfaction (modified Bailey & Pearson instrument)
DSS; one university, 101 students
Lab Satisfaction with a DSS (multi-item scale)
DeSanctis (1986)
Human resources 1/S; 171 human resource system professionals
Fiel
d (1) Top management satisfaction(2) Personal management satisfaction
Doll and Ahmed
(1985) Specific I/S; 55 firms, 154
managers
Fiel
d User satisfaction (11-item scale)
Edmundson and Jeffery (1984)
Accounting software package; 12 organizations
Fiel
d User satisfaction (1 question)
Ginzberg (1981a) On-line portfolio
management system; U.S. bank, 29 portfolio managers
Fiel
d Overall satisfaction
Ginzberg(1981b) Overall I/S; 35 I/S users Field Overall satisfaction
Hogue (1987) DSS; 18 organizations Fiel
d User satisfaction (1 question) Ives. Olson, and
Baroudi(1983)
Overall I/S; 200 firms, 200 production managers
Fiel
d User satisfaction (Bailey & Pearson instrument)
Jenkins, Naumann. and
Wetherbe (1984) A specific I/S; 23
corporations, 72 systems development managers
Fiel
d User satisfaction (25-item instrument)
King and Epstein
(1983) Overall I/S; 2 firms, 76
managers
Fiel
d User satisfaction (l item: scale 0 to 100)
d User satisfaction (1 question)
Lehman, Van
d (1) Software satisfaction(2) Hardware satisfaction
Lucas (1981) Inventory ordering system;
one university, 100 executives
experiment. Finally, Sanders and Courtney (1985) adopted the speed of decision analysis resulting from DSS as one item in their DSS success measurement instrument.
Mason (1978) has suggested that one method of measuring 1/S impact is to determine whether the output of the system causes the receiver (i.e., the decision maker) to change his or her behavior. Ein-Dor, Segev, and Steinfeld (1981) asked decision makers: “Did use of PERT [a specific information system] ever lead to a change in a decision or to a new decision?” Judd. Paddock, and Wetherbe (1981) measured whether a budget exception reporting system resulted in managers’ taking investigative action.
Another approach to the measurement of the impact of an information system is to ask user managers to estimate the value of the information system. Cerullo (1980) asked managers to rank the value of their computer-based MIS on a scale of one to ten. Ronen and Falk (1973) asked participants to rank the value of information received in an experimental decision context. Using success items developed by Schultz and Slevin
TABLE 4 (cant'd)
Authoifs) Description of Study Type Description of Measure! s)
Mahmood (1987) Specific 1/S; 61 l/S managers Field Overall satisfaction Mahmood and Becker
(1985-1986)
Overall 1/S; 59 firms, 118
managers Field User satisfaction
Mahmood and
Medewitz (1985) DSS; 48 graduate students Lab User satisfaction (multi-item scale)
McKeen (1983) Application systems; 5
organizations
Fiel
d Satisfaction with the development project (Powers and Dickson instrument)
Nelson and Cheney (1987)
Overall I/S; 100 top/middle managers
Fiel
d User satisfaction (Bailey & Pearson instrument)
Olson and Ives (1981) Overall 1/S; 23
manufacturing firms. 83 users
Fiel
d Information dissatisfaction differencebetween information needed and amount of information received Olson and (ves (1982) Overall I/S; 23 manufacturing
firms, 83 users
Fiel
d Information satisfaction, difference between information needed and information received
Raymond (1985)
Overall I/S; 464 small manufacturing firms
Fiel
d (modified Bailey & PearsonController satisfaction instrument) Raymond (1987)
Overall I/S: 464 small-firm finance managers
Fiel
d User satisfaction (modified Bailey &
Pearson instrument) Rivard and Huff
(1984) User-developed applications; 10 large companies Field User complaints regarding Information Center services
Rushinek and
Rushinek (1986) Overall I/S; 4448 users Field Overall user satisfaction
Sanders and Courtney
d (1) Decision-making satisfaction(2) Overall satisfaction
Taylor and Wang
(1987) DBMS with multiple
dialogue modes; one university. 93 students
(1975), King and Rodriguez (1978, 1981) asked users of their “Strategic Issue Competitive Information System” to rate the worth of that 1/S.
Other researchers have gone a step further by asking respondents to place a dollar value on the information received. Gallagher (1974) asked managers about the maximum amount they would be willing to pay for a particular report. Lucas (1978) reported using willingness to pay for an information system as one of his success measures. Keen (1981) incorporated willingness to pay development costs for improved DSS capability in his proposed “Value Analysis" for justification of a DSS. In an experiment involving MBA students, Hilton and Swieringa (1982) measured what participants were willing to pay for specific information which they felt would lead to higher decision payoffs. Earlier, Garrity (1963) used MIS expenditures as a percentage of annual capital expenditures to estimate the value of the MIS effort.
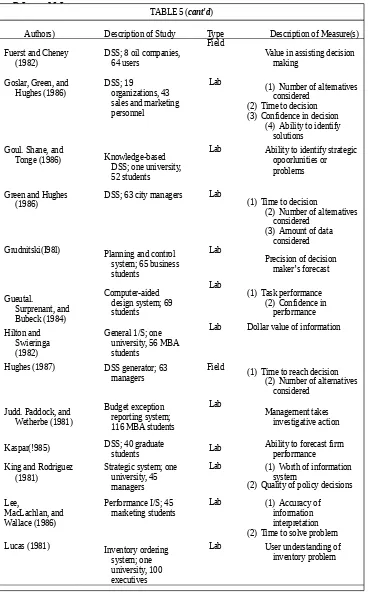
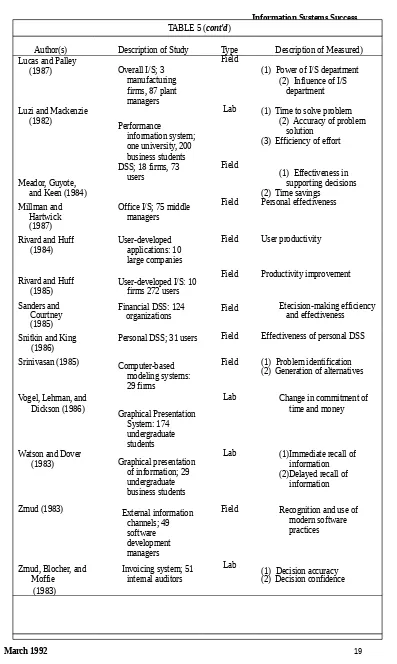
Table 5, with 39 entries, contains the largest number of empirical studies. This in itself is a healthy sign, for it represents an attempt to move beyond the earlier inwardlooking measures to those which offer the potential to gauge the contribution of information systems to the success of the enterprise. Also worth noting is the predomi-nance of laboratory studies. Whereas most of the entries in the preceding tables have been field experiments, 24 of the 39 studies reported here have used controlled laboratory experiments as a setting for measuring the impact of information on individuals. The increased experimental rigor which laboratory studies offer, and the extent to which they have been utilized at least in this success category, is an encouraging sign for the maturing of the field.
Organizational Impact: The Effect of Information on Organizational Performance
In a survey by Dickson, Leitheiser, Wetherbe, and Nechis (1984), 54 information systems professionals ranked the measurement of information system effectiveness as the fifth most important I/S issue for the 1980s. In a recent update of that study by Brancheau and Wetherbe (1987), I/S professionals ranked measurement of information system effectiveness as the ninth most important I/S issue. Measures of individual performance and, to a greater extent, organization performance are of considerable importance to I/S practitioners. On the other hand, MIS academic researchers have tended to avoid performance measures (except in laboratory studies) because of the difficulty of isolating the effect of the I/S effort from other effects which influence organizational performance.
As discussed in the previous section, the effect of an information system on individual decision performance has been studied primarily in laboratory experiments using students and computer simulations. Many of these experiments were conducted at the University of Minnesota (Dickson, Chervany, and Senn 1977), Among these “Minnesota Experiments" were some that studied the effects of different information
formats and presentation modes on decision performance as measured in terms of lower production, inventory, or purchasing costs. King and Rodriguez {1978, 1981) measured decision performance by evaluating
participant tests responses to various hypothesized strategic problems.
in another laboratory study, Lucasand Nielsen (1980) measured participant performance (and thus, indirectly, organizational performance) in terms of profits in a logistics management game. In a later experiment, Lucas (1981) investigated the effect of computer graphics on decisions involving inventory ordering. Finally, Remus (1984) used the costs of various scheduling decisions to evaluate the effects of graphical versus tabular displays.
Field studies and case studies which have dealt with the influence of information systems have chosen various organizational performance measures for their dependent variable. In their study, Chervany, Dickson, and Kozar (1972) chose cost reductions as their dependent variable. Emery (1971. p. 6) has observed that: “Benefits from an information system can come from a variety of sources. An important one is the reduction in operating costs of activities external to the information processing system.”
complexity applications.
In a survey of several large companies. Rivard and Huff (1984) interviewed data processing executives and asked them to assess the cost reductions and company profits realized from specific user-developed application programs. Lucas (1973) and Hamilton and Chervany (1981) suggested that company revenues can also be im-proved by computer-based information systems. In a study of a clothing manufacturer, Lucas (1975) used total dollar bookings as his measure of organizational performance. Chismar and Kriebel (1985) proposed
measuring the relative efficiency of the information systems effort by applying Data Envelopment Analysis to measure the relationship of corporate outcomes such as total sales and return on investment to I/S inputs.
DeLone • McLean
17 Information Systems Research 3 : !
TABL E 5
Empirical Measures of Individual Impact
Authors) Description of Study Type Description of Measurefs)
Aldag and Power (2) Quality of decision
analysis
Lab Time taken to complete a
task
Benbasat and Dexter (1986)
Financial; 65 business students
Lab Time taken to complete a
task
Lab Time to make pricing
decisions
Bergeron (1986a) DP chargeback system;
54 organizations, 263 user managers
Field Extent to which users analyze charges and
Lab (1) Quality of career plans
(2) Number of objectives and alternatives
(1) Time efficiency of task accomplishment (2) User adherence to plan
DeSanctis and Jarvenpaa (1985)
Tables vs. graphs; 75 MBA students
Lab Decision quality, forecast accuracy
DeLone • McLean
18 Information Systems Research 3 : 1
TABLE 5 (cant'd)
Authors) Description of Study Type Description of Measure(s)
Fuerst and Cheney (1982)
DSS; 8 oil companies, 64 users
Field
Value in assisting decision making
Lab (1) Number of alternatives
considered (2) Time to decision (3) Confidence in decision
(4) Ability to identify solutions
Goul. Shane, and
Tonge (1986) Knowledge-based
DSS; one university, 52 students
Lab Ability to identify strategic
opoorlunities or problems
Green and Hughes (1986)
DSS; 63 city managers Lab
(1) Time to decision
(2) Number of alternatives considered
(3) Amount of data considered
Grudnitski(I98l) Planning and control
system; 65 business
Lab Dollar value of information
Hughes (1987) DSS generator; 63
managers
Field (1) Time to reach decision (2) Number of alternatives
Kaspar(!985) DSS; 40 graduate
students Lab
Ability to forecast firm performance
Lab (1) Worth of information
system
(2) Quality of policy decisions
Lee, (2) Time to solve problem
Lucas (1981) Inventory ordering
system; one university, 100 executives
Lab User understanding of
Information Systems Success
March 1992 19
TABLE 5 (cont'd)
Author(s) Description of Study Type Description of Measured)
Lucas and Palley
(1) Power of I/S department (2) Influence of I/S
Lab (1) Time to solve problem (2) Accuracy of problem
solution
Office I/S; 75 middle managers
Courtney Financial DSS: 124organizations Field
Etecision-making efficiency and effectiveness (1985)
Snitkin and King (1986)
Personal DSS; 31 users Field Effectiveness of personal DSS
Srinivasan (1985) Computer-based
Lab Change in commitment of
time and money
Lab (1)Immediate recall of
information (2)Delayed recall of
information
Zmud (1983) External information
channels; 49 software development managers
Field Recognition and use of
DeLone • McLean
20 Information Systems Research 3 : 1
intangible benefits. The proposed methodology then applied a statistical test to determine whether “significant” value can be attached to a decision support system.
With the corporate “bottom line” in mind, several MIS frameworks have proposed that MIS effectiveness be determined by its contribution to company profits (Cher- vany, Dickson, and Kozar 1972; Lucas 1973; Hamilton and Chervany 1981), but few empirical studies have attempted to measure actual profit contribution. Ferguson and Jones (1969) based their evaluation of success on more profitable job schedules which resulted from decision-maker use of the information system. Ein-Dor, Segev, and Steinfeld (1981) attempted to measure contribution to profit by asking users of a PERT system what savings were realized from use of PERT and what costs were incurred by using PERT.
Another measure of organizational performance which might be appropriate for measuring the contribution of MIS is return on investment Both Garrity (1963) and the McKinsey study (1968) reported using return on investment calculations to assess the success of corporate MIS efforts. Jenster (1987) included nonfinancial measures of organizational impact in a field study of 124 organizations. He included productivity, innovations, and product quality among his measures of I/S success. In a study of 53 firms. Perry (1983) measured the extent to which an office information system contributed to meeting organizational goals.
Strassmann, in his book Information Payoff{1985), presented a particularly comprehensive view of the role of information systems with regards to performance, looking at it from the perspective of the individual, the organization, the top executive, and society. His measure of performance was a specially constructed “Return on Management” (ROM) metric.
In nonprofit organizations, specifically government agencies, Danziger (1977) proposed using productivity gains as the measure of information systems impact on the organization. He explained that productivity gains occur when the “functional output of the government is increased at the same or increased quality with the same or reduced resources inputs” (p. 213). In a presentation of several empirical studies conducted by the University of California, Irvine, Danziger included five productivity measures: staff reduction, cost reduction, increased work volume, new information, and increased effectiveness in serving the public.
The success of information systems in creating competitive advantage has prompted researchers to study I/S impacts not only on firm performance but also on industry structure (Clemons and Kimbrough 1986). Bakos (1987) reviewed the literature on the impacts of information technology on firm and industry-level performance from the perspective of organization theory and industrial economics. At the firm level, he suggested measures of changes in organizational structure and of improvements in process efficiency using Data Envelopment Analysis (Chismar and Kriebel 1985) as well as other financial measures. At the industry level, he found impact measures (e.g., economies of scale, scope, and market
concentration) harder to identify in any readily quantifiable fashion and suggested that further work is needed.
Del.one • McLean
21 Information Systems Research 3 : 1
judgment to assess the value of the benefits which are more difficult to quantify such as reduction of overhead, increases in customer switching costs, barriers to new firm entry, and product differentiation.
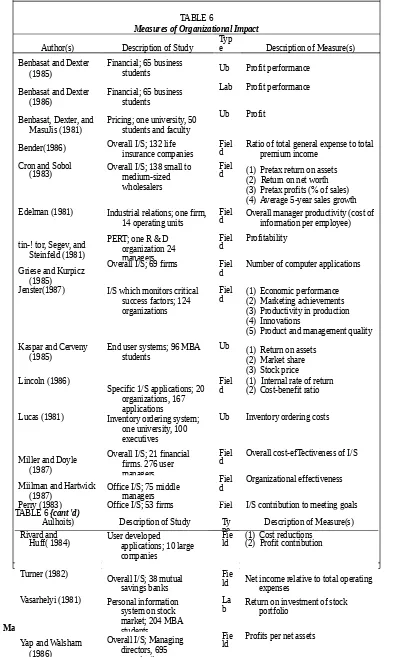
Table 6 is the last of the six tables summarizing the I/S success measures identified in this paper. Somewhat surprisingly, 20 empirical studies were found, with 13 using field-based measures (as opposed to the laboratory experiments characterizing the individual impacts) to get at the real-world effects of the impact of information systems on organizational
performance. However, this is only a beginning; and it is in this area, “assessing the business value of information systems,” where much work needs to be done.
Discussion
In reviewing the various approaches that I/S researchers have taken in measuring MIS success, the following observations emerge.
1.As these research studies show, the I/S researcher has a broad list of individual dependent variables from which to choose.
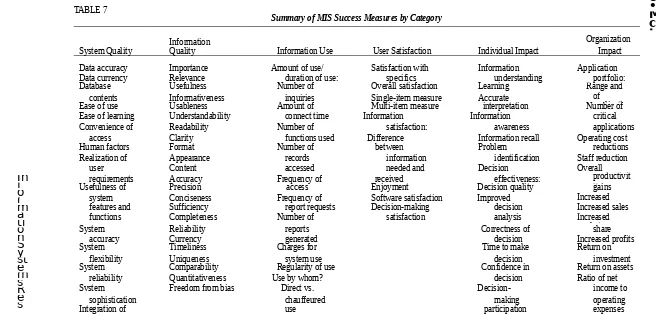
It is apparent that there is no consensus on the measure of information systems success. Just as there are many steps in the production and dissemination of information, so too are there many variables which can be used as measures of “1/S success.” In Table 7, all of the variables identified in each of the six success categories discussed in the preceding sections are listed. These include success variables which have been suggested but never used empirically as well as those that have actually been used in experiments.
In reviewing these variables, no single measure is intrinsically better than another; so the choice of a success variable is often a function of the objective of the study, the organizational context, the aspect of the information system which is addressed by the study, the independent variables under investigation, the research method, and the level of analysis, i.e., individual, organization, or society (Markus and Robey 1988). However, this proliferation of measures has been overdone. Some consolidation is needed.
2.Progress toward an MIS cumulative tradition dictates a significant reduction in the number of different dependent variable measures so that research results can be compared.
One of the major purposes of this paper is the attempt to reduce the myriad of variables shown in Table 7 to a more manageable taxomony. However, within each of these major success categories, a number of variables still exist. The existence of so many different success measures makes it difficult to compare the results of similar studies and to build a cumulative body of empirical knowledge. There are, however, examples of researchers who have adopted measurement instruments developed in earlier studies.
Ives, Olson, and Baroudi (1983) have tested the validity and reliability of the
user-satisfaction questionnaire developed by Bailey and Pearson (1983)and used that instrument in an empirical study of user involvement (Baroudi, Olson and Ives 1986). Raymond (1985, 1987) used a subset of the Bailey and Pearson user-satisfaction instrument to study MIS success in small manufacturing firms. Similarly, Mah- mood and Becker (1986) and Nelson and Cheney (1987) have used the Bailey and Pearson instrument in empirical studies. In another vein, Me Keen (1983) adopted the Powers and Dickson (1973) satisfaction scale to measure the success of I/S development strategies.
King and Rodriguez (1978, 1981), Robey (1979), Sanders (1984), and Sanders and Courtney (1985) have adopted parts of a measurement instrument which Schultz and Slevin (1975) developed to measure user attitudes and perceptions about the value of operations research models. Munro and Davis (1977) and Zmud (1978) utilized Gallagher’s questionnaire items (1974) to measure the perceived value of an information system. Finally, Blaylock and Rees (1984) used Larckerand Lessig's40 information items (1980) to measure perceived information usefulness.
These are encouraging trends. More MIS researchers should seek out success measures that have been developed, validated, and applied in previous empirical research.
Del .one * McLean
22 Information Systems Research 3 : 1
on organizational performance.
Attempts to measure MIS impact on overall organizational performance are not often undertaken because of the difficulty of isolating the contribution of the information systems function from other contributors to organizational performance. Nevertheless, this connection is of great interest to information system practitioners and to top corporate management. MIS organizational performance measurement deserves further development and testing.
Cost/benefit schemes such as those presented by Emery (1971), McFadden(1977), and Matlin (1979) offer promising avenues for further study. The University of California, Irvine, research on the impact of information systems on government activity (Danziger 1987) suggests useful impact measures for public as well as private organizations. Lucas (1975) included organizational performance in his descriptive model and then operationalized this variable by including changes in sale revenues as an explicit variable in his field study of a clothing manufacturer. Garrity (1963) and the McKinsey & Company study (1968) reported on early attempts to identify MIS returns on investment. McLean (1989), however, pointed out the difficulties with these approaches, while at the same time attempting to define a framework for such analyses. Strassmann (1985) has developed his “Return on Management” metric as a way to assess the overall impact of information systems on companies.
These research efforts represent promising beginnings in measuring MIS impact on performance.
4.The six success categories and the many specific I/S measures within each of these categories clearly indicate that MIS success is a multidimensional construct and that it should he measured as such.
Vanlomme! and DeBrabander (1975) early pointed out that the success of a computer-based information system is not a homogeneous concept and therefore the attempt should not be made to capture it by a simple measure. Ein-Dor and Segev (1978) admitted that their selection of MIS use as their dependent variable may not be ideal. They stated that “A better measure of MIS success would probably be some weighted average for the criteria mentioned above" (i.e.. use, profitability, application to major problems, performance, resulting quality decision, and user satisfaction).
Information Systems Success
March 1992 23
TABLE 6
Measures of Organizational Impact
Author(s) Description of Study Type Description of Measure(s)
Benbasat and Dexter
Pricing; one university, 50 students and faculty
Ub Profit
Bender(1986) Overall I/S; 132 life
insurance companies
Fiel
d Ratio of total general expense to totalpremium income Cron and Sobol
(1983) Overall I/S; 138 small to medium-sized wholesalers
Fiel
d (1) Pretax return on assets (2) Return on net worth (3) Pretax profits (% of sales) (4) Average 5-year sales growth Edelman (1981) Industrial relations; one firm,
14 operating units
Fiel
d Overall manager productivity (cost ofinformation per employee)
tin-! tor, Segev, and
Overall I/S; 69 firms Fiel
d Number of computer applications
Jenster(1987) I/S which monitors critical success factors; 124 organizations
Fiel
d (1) Economic performance(2) Marketing achievements (3) Productivity in production (4) Innovations
(5) Product and management quality
Kaspar and Cerveny (1985)
End user systems; 96 MBA students
Ub (1) Return on assets (2) Market share (3) Stock price Lincoln (1986)
Specific 1/S applications; 20 organizations, 167 applications
Fiel
d (1) Internal rate of return(2) Cost-benefit ratio
Lucas (1981) Inventory ordering system;
one university, 100 executives
Ub Inventory ordering costs
Miller and Doyle (1987)
Overall I/S; 21 financial firms. 276 user managers
Fiel
d Overall cost-efTectiveness of I/S
Miilman and Hartwick
(1987) Office I/S; 75 middle managers
Fiel
d Organizational effectiveness
Perry (1983) Office I/S; 53 firms Fiel
d I/S contribution to meeting goals Remus (1984)
Production scheduling system; one university, 53 junior business students
Ub Production scheduling costs TABLE 6 {cant 'd)
Aulhoits) Description of Study Ty
pe Description of Measure(s)
Rivard and
Huff( 1984) User developed applications; 10 large companies
Fie
ld (1) Cost reductions(2) Profit contribution
Turner (1982) Overall I/S; 38 mutual
savings banks
Fie
ld Net income relative to total operating expenses
Vasarhelyi (1981) Personal information system on stock market; 204 MBA students
La
b Return on investment of stock portfolio
Yap and Walsham
Del .one * McLean
24 Information Systems Research 3 : 1
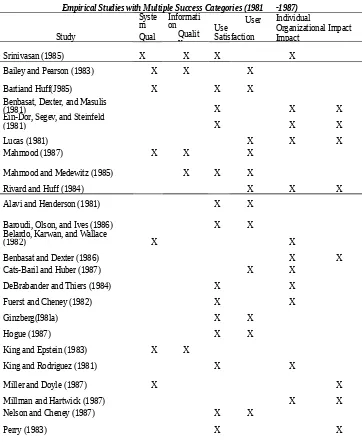
categories. Of the 100 studies identified, only 28 attempted measures in multiple categories. These are shown in Table 8. Nineteen used measures in two categories, eight used three, and only one attempted to measure success variables in four of the six categories. These attempts to combine measures, or at least to use multiple measures, are a promising beginning. It is unlikely that any single, overarching measure of I/S success will emerge; and so multiple measures will be necessary, at least in the foreseeable future.
However, shopping lists of desirable features or outcomes do not constitute a coherent basis for success measurement. The next step must be to incorporate these several individual dimensions of success into an overall model of I/S success.
Some of the researchers studying organizational effectiveness measures offer some insights which might enrich our understanding of I/S success (Lewin and Minton 1986). Steers (1976) describes organizational effectiveness as a contingent, continuous process rather than an end-state or static outcome. Miles (1980) describes an “ecology model” of organizational
effectiveness which integrates the goals-attain- ment perspective and the systems perspective of effectiveness. Miles's ecology model recognizes the pattern of “dependency relationships” among elements of the organizational effectiveness process. In the I/S effectiveness process, the dependency of user satisfaction on the use of the product is an example of such a
dependency relationship. So while there is a temporal dimension to I/S success measurement, so too is there an interdependency dimension.
The process and ecology concepts from the organizational effectiveness literature provide a theoretical base for developing a richer model of I/S success measurement. Figure 2 presents an I/S success model which recognizes success as a process construct which must include both temporal and causal influences in determining I/S success. In Figure 2, the six I/S success categories first presented in Figure 1 are rearranged to suggest an ;>j/mlependent success construct while maintaining the serial, temporal dimension of information flow and impact.
00
Summary of MIS Success Measures by Category
System Quality InformationQuality Information Use User Satisfaction Individual Impact
Organization Impact
Data accuracy Importance Amount of use/ Satisfaction with Information Application
Data currency Relevance duration of use: specifics understanding portfolio:
Database Usefulness Number of Overall satisfaction Learning Range and
scope
contents Informativeness inquiries Single-item measure Accurate of
application
Ease of use Usableness Amount of Multi-item measure interpretation Number of
Ease of learning Understandability connect time Information Information critical
Convenience of Readability Number of satisfaction: awareness applications
access Clarity functions used Difference Information recall Operating cost
Human factors Format Number of between Problem reductions
Realization of Appearance records information identification Staff reduction
user Content accessed needed and Decision Overall
requirements Accuracy Frequency of received effectiveness: productivit
y
Usefulness of Precision access Enjoyment Decision quality gains
system Conciseness Frequency of Software satisfaction Improved Increased
revenues
features and Sufficiency report requests Decision-making decision Increased sales
functions Completeness Number of satisfaction analysis Increased
market
System Reliability reports Correctness of share
accuracy Currency generated decision Increased profits
System Timeliness Charges for Time to make Return on
flexibility Uniqueness system use decision investment
System Comparability Regularity of use Confidence in Return on assets
reliability Quantitativeness Use by whom? decision Ratio of net
Svstem Freedom from bias Direct vs. Decision- income to
sophistication chauffeured making operating
Integration of use participation expenses
systems Binary use: Improved Cost/benefit ratio
System Use vs. nonuse individual Stock price
efficiency Actual vs. reported productivity Increased
work
Resource use Change in decision volume
utilization Nature of use: Causes Product
quality
Response time Use for intended management Contribution
to
T urnaround purpose action achieving
time Appropriate use Task performance goals
Type of Quality of plans Increased
work
information Individual power volume
used or influence Service
Purpose of use Levels of use: General vs. specific Recurring use Institutionalization/ routinization of use
Report acceptance Percentage used vs. opportunity for use
Vol untariness of use Motivation to use
Personal valuation ofl/S Willingness to pay
for information
00
oo
TABLE 8
Empirical Studies with Multiple Success Categories (1981 -1987)
Study
Syste m Qual ity
Informati on
Qualit y
User Use Satisfaction
Individual
Organizational Impact Impact
Srinivasan (1985) X X X X
Bailey and Pearson (1983) X X X
Bartiand Huff(J985) X X X
Benbasat, Dexter, and Masulis
(1981) X X X
Ein-Dor, Segev, and Steinfeld
(1981) X X X
Lucas (1981) X X X
Mahmood (1987) X X X
Mahmood and Medewitz (1985) X X X
Rivard and Huff (1984) X X X
Alavi and Henderson (1981) X X
Baroudi, Olson, and Ives (1986) X X
Belardo, Karwan, and Wallace
(1982) X X
Benbasat and Dexter (1986) X X
Cats-Baril and Huber (1987) X X
DeBrabander and Thiers (1984) X X
Fuerst and Cheney (1982) X X
Ginzberg(I98la) X X
Hogue (1987) X X
King and Epstein (1983) X X
King and Rodriguez (1981) X X
Miller and Doyle (1987) X X
Millman and Hartwick (1987) X X
Nelson and Cheney (1987) X X
Perry (1983) X X
00
INDIVIDUAL IMPACT; and, lastly, this IMPACT on individual performance should eventually have some ORGANIZATIONAL IMPACT.
To be useful, a model must be both complete and parsimonious. It must incorporate and organize all of the previous research in the field, while, at the same time be sufficiently simple so that it does not get caught up in the complexity ofthe real-world situation and thus lose its explanatory value. As Tables I through 8 show, the six categories of the taxonomy and the structure of the model allow a reasonably coherent organization of at least a large sample of the previous literature, while, at the same time, providing a logic as to how these categories interact. In addition to its explanatory value, a model should also have some predictive value. In fact, the whole reason for attempting to define the dependent variable in MIS success studies is so that the operative independent variables can be identified and thus used to predict future MIS success.
At present, the results of the attempts to answer the question "What causes MIS success?” have been decidedly mixed. Researchers attempting to measure, say, the effects of user participation on the subsequent success of different information systems may use user satisfaction as their primary measure, without recognizing that system and information quality may be highly variable among the systems being studied. In other words, the variability of the satisfaction measures may be caused, not by the variability of the extent or quality of participation, but by the differing quality ofthe systems themselves, i.e., users are unhappy with "bad” systems even when they have played a role in their creation. These confounding results are likely
to occur unless all the components identified in the I/S success model are measured or at least controlled. Researchers who neglect to take these factors into account do so at their peril.
Del .one ■ McLean
31 Information Systems Research 3 : 1
a comprehensive measurement instrument. The selection of success measures should also consider the contingency variables, such as the independent variables being
researched; the organizational strategy, structure, size, and environment of the organization being studied; the technology being employed; and the task and individual characteristics of the system under investigation {Weill and Olson 1989).
The I/S success model proposed in Figure 2 is an attempt to reflect the interdependent, process nature of I/S success. Rather than six independent success categories, there are six mterdependent dimensions to I/S success. This success model clearly needs further development and validation before it could serve as a basis for the selection of appropriate I/S measures. In the meantime, it suggests that careful attention must be given to the development of I/S success instruments.
Conclusion
As an examination of the literature on l/S success makes clear, there is not one success measure but many. However, on more careful examination, these many measures fall into six major categories—SYSTEM QUALITY, INFORMATION QUALITY, USE, USER SATISFACTION, INDIVIDUAL IMPACT, and ORGANIZATIONAL IMPACT.
Moreover, these categories or components are interrelated and interdependent, forming an I/S success model. By studying the interactions along these components of the model, as well as the components themselves, a clearer picture emerges as to what constitutes information systems success.
The taxonomy introduced in this paper and the model which flows from it should be useful in guiding future research efforts for a number of reasons. First, they provide a more comprehensive view of I/S success than previous approaches. Second, they organize a rich but confusing body of research into a more understandable and coherent whole. Third, they help explain the often conflicting results of much recent I/S research by providing
alternative explanations for these seemingly inconsistent findings. Fourth, when combined with a literature review, they point out areas where significant work has already been accomplished so that new studies can build upon this work, thus creating the long-awaited “cumulative tradition” in I/S. And fifth, they point out where much work is still needed, particularly in assessing the impact of information systems on organizational
performance.*
* John King. Associate Editor. This paper was received on April 5, 1989, and has been with the authors 18' months for 2 revisions.
References
Ahituv, Niv. “A Systematic Approach Toward Assessing the Value of an Information System," MIS Quarterly, 4, 4 (December 1980), 61-75.
Alavi, Maryam and John C, Henderson, "An Evolutionary Strategy for Implementing a Decision Support System,” Management Science, 27, 11 (November 1981), 1309-1322.
Aldag. Ramon J. and Daniel J. Power, "An Empirical Assessment of Computer-Assisted Decision Analysis,"
Decision Sciences, 17, 4 (Fall 1986), 572-588.
Alloway, Robert M.. “Defining Success for Data Processing: A Practical Approach to Strategic Planning for the DP Department," CISR Working Paper No. 52, Center for Information Systems Research. Massachusetts Institute of Technology, March 1980.
Bailey, James E. and Sammy W. Pearson, “Development of a Tool for Measuring and Analyzing Computer User Satisfaction," Management Science. 29. 5 (May 1983), 530-545,
Bakos, J. Yannis, "Dependent Variables for the Study of Firm and Industry-Level Impacts on Information Technology,” Proceedings of the Eighth International Conference on Information Systems, December 1987, 10-23.
Baroudi, Jack J., Margrethe H. Olson and Blake Ives, “An Empirical Study of the Impact of User
Involvement on System Usage and Information Satisfaction.” Communications of the ACM, 29, 3 (March 1986), 232-238.
Barti, Henri and Sid Huff, “Change, Attitude to Change, and Decision Support System Success," Information A Management. 9, 5 (December 1985), 261-268.