EFFECTS OF DIETARY ADENINE ON GROWTH, LIPID SECRETION,
AND LIVER LIPID CONTENT
Yohanes Buang
1.2 1Laboratory of Applied Biochemistry, Department of Applied Biological Science, Saga University, Saga Shi, Honjo Machi-1, Saga, Japan
2
Department of Chemistry, Faculty of Science and Engineering, Nusa Cendana University, Jln. Adisucipto Penfui-Kupang
Received March 18, 2010; Accepted April 9, 2010
ABSTRACT
The effects of dietary adenine on growth, lipid secretion, and liver lipid contents were studied. Rats were paired-fed 0.25 % adenine diet or a diet without adenine for 10 days. The final body weight and relative liver weight were recorded. Serum lipid profiles were measured using enzyme assay kits. Lipids of liver tissues were extracted and the lipid contents were determined. A peach of liver was prepared to determine the activities of fatty acid synthase (FAS) and fatty acid β-oxidation. The results showed that animals fed an adenine diet reduced slightly body weight and relative liver weight and promoted serum triglyceride (TG), phospholipids (PL), total cholesterol, and high density lipoprotein concentrations. Their promotions were approximately by 74%, 20%, 27%, and 27%, respectively. The liver PL content increased significantly whereas the promotions of liver TG and cholesterol failed to reach significant level. Furthermore, the FAS activity slightly stimulated, but fatty acid β-oxidation significantly decreased. In conclusion: dietary adenine suppressed slightly growth of body weight and relative liver weight but promoted secretion of lipid compounds from liver tissue into extra-hepatic and liver PL content. The enzyme activity of lipogenic was slightly stimulated whereas the lipolytic was significantly inhibited.
Keywords:adenine, serum lipid, triglyceride, high density lipoprotein, cholesterol
INTRODUCTION
It is natural that adenine is a nucleobase with a variety of roles in biochemistry including an integral part of the structure of many coenzymes such as nicotinamide adenine dinucleotide (NAD) and flavine adenine dinucleotide (FAD), and the adenosine diphosphate (ADP). The NAD, FAD, and ADP molecules play major roles in cellular respiration [1-3]. Adenine is also parts of nucleic acids, deoxyribonucleotide acid (DNA) and ribonucleotide acid (RNA), in which both latter molecules play important roles in protein synthesis [1,4]. A modified form of adenosine monophosphate is thought to be a secondary messenger in the propagation of many hormonal stimuli [1,5]. It is also reported that the extracellular adenosine plays as a signaling molecule to mediate divers’ medical effects via cell surface receptor termed adenosine triphosphate (ATP) and ADP receptors [5-7]. Overall, adenine is one of the key molecules of the non-protein nitrogen compound found in all living cells.
Both DNA and RNA nucleotides are synthesized from amino acid by de novo or from the waste of nucleotide by salvage pathway. Unlike de novo that is high cost pathway, the nucleotides resulted from salvage pathway are much simpler [1]. Because nucleotides are the structural units of the nucleic acids and essential
compounds in energy transfer systems (in ATP form), they have been assumed to have key pathways in lipid metabolisms [1-2,8]. Lipid metabolism plays an important role in regulation of life style-related diseases such as hypertension, diabetes mellitus, and atherosclerosis [9-15]. Those life style-related diseases are normally detected by the profiles of serum and/or plasma of bloodstream [16-19].
and liver lipid content as the indicators of morbidity related to the lipid metabolism disorders.
EXPERIMENTAL SECTION
Materials
Casein, safflower oil, vitamin mixture, mineral mixture, choline bitartrate, DL-methionine, cellulose, α -cornstarch, adenine, and sucrose, methanol, chloroform, double distillated water, petroleum ether, KOH, silica gel G, isopropanol, NaIO4, acetyl acetone, silica gel H,
HClO4, ammonium molibdate, 2,4-diaminophenol,
NaHSO3, kits (Wako Pure Chemical Industries), Na2CO3,
CuSO4, NaOH, Na2C4H4O6.2H2O, CH3COOH, phenol
reagent, KH2PO4, EDTA, acetyl-CoA, malonyl-CoA,
NADPH, tris-HCl, triton-x, DTNB, palmitoyl-CoA, and L-carnitine. All other chemicals and reagents were of the best commercial grade available.
Instrumentation
Analytical balance (ABT 320-4M), food mixer (Meiying, Model Number: XNJBJ-5L/7L), centrifuge (Model: EUtdl-12/25), ultracentrifuge (Beckman Coulter: Optima™ L-100XP ultracentrifuge), rotor (model Z601144 centrifuge (Sigma) and TFT 50.38 ultracentrifuge (Sorvall) rotors), lipid separator equipment (evaporator, vacuum pump, refrigerator), UV-VIS spectrophotometer (Shimadzu BioSpec-mini), and branson electric (Branson 250 sonifier, USA).
Procedure
Animal treatments
All aspects of the experiment were conducted according to guidelines provided by the ethical committee of experimental animal care at Saga University (Saga, Japan). Male Sprague-Dawley rats aged 5 weeks were housed individually in an air-conditional room (24 °C) with a 12 h light/dark cycle. After 1 week adaptation period, rats were assigned to two groups (five rats each). Basal diet (as basal group) was prepared according to recommendations of the American Institute of Nutrition (AIN) and contained (in weight %) 20 of casein, 10 of safflower oil, 1 of vitamin mixture (AIN-93), 3.5 of mineral mixture (AIN-93), 0.20 of choline bitartrate, 0.3 of DL-Methionine, 5 of cellulose, 15 of α-cornstarch, and sucrose to make 100. The diet (as adenine group) was prepared by supplementation of 0.25% adenin to the basal diet at the expense of sucrose. The animals received the diets for 10 days. At the end of the feeding period, rats were killed by decapitation after a 9 h starvation. Livers were excised immediately, and serum was separated from blood.
Analyses of serum and liver lipids
Liver lipids were extracted according to the method of Folch et al. [22] and concentrations of triglyceride (TG) and phospholipids (PL) were measured by the methods of Fletcher [23] and Bartlett [24], respectively. The total cholesterol content of liver tissues and the serum TG, PL, and cholesterol were measured using enzyme assay kits from Wako Pure Chemicals according to the manufacture’s instructions.
Preparation of liver subcellular fractions
The mitochondrial and cytosol of liver sub cellular fractions were prepared as previously reported by Nagao et al. [25]. Protein concentration was determined by the method of Lowry et al. [26].
Assays of hepatic enzyme activity
The lipogenic enzyme determined was fatty acid synthase (FAS; EC2.3.1.85). The enzyme activities of FAS were determined as previously described by Nagao et al. [25]. The lipolytic enzyme determined was carnitine palmitoyl transferase-1 (CPT-1; EC2.3.1.23), a rate-limiting enzyme of fatty acid β-oxidation. The enzyme activities of CPT were also measured as previously reported by Nagao et al. [25].
Statistical analyses
All values are expressed as mean ± standard error of the mean (SEM). Data were analyzed by one-way analysis of variance, and all differences were inspected by Duncan’s new multiple-range test [27] using SSPS statistical software (SSPS inc., Chicago, IL, USA). P<0.05 was considered statistically significant.
RESULT AND DISCUSSION
Dietary adenine slightly reduced body weight and liver weight
The daily food intake was paired-fed for each animal in order to get the same quantity of macronutrient, vitamin, and mineral ingested. The macronutrient as sources of caloric food of each group was prepared in excess amount. It was therefore, the addition of food supplements, adenine compound, to the basal diet provided the same quantity of the energy needed by each animal’s homeostasis metabolisms of each group during the time course. Thus, the effect of intake adenine by the given concentration could be elucidated from this experimental design.
there were similar in the amount of food intakes. The liver size however decreased slightly. Those results indicated that growth parameters were moderately attenuated by the treatment.
Dietary adenine promoted serum lipids secretion
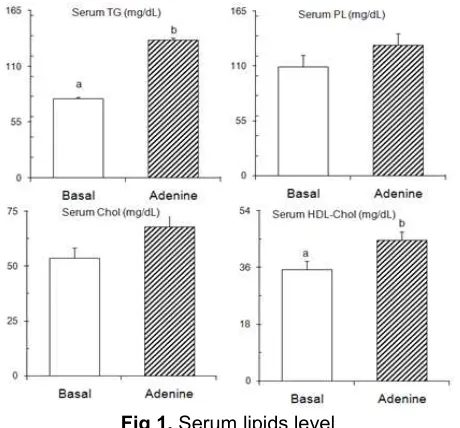
Although the growth parameters were nearly similar between the groups however these growth did not inform the serum lipid profiles affected by the treatment. As shown in Fig. 1, the serum lipid levels increased in starvation rats. Serum TG, PL, and total cholesterol of adenine group approximately increased by 74%, 20%, and 27%, respectively, than that of the basal group. These serum lipid profiles indicated that lipids secretion from the liver was promoted by the treatment. It is well known that a very-low density lipoprotein (VLDL) particle handles the transportation of lipid compounds from the liver into extra-hepatic tissues. Lehninger et al. [1], Stipanuk [2], and Hui et al. [30] reported the increasing lipid packed into the VLDL particle releases high lipid concentration in serum. Therefore, the enhancements of these serum lipid levels indicated their secretions increased from the liver into the bloodstream.
Furthermore, the high-density lipoprotein (HDL)-cholesterol level of treated group also increased. The high level of HDL-cholesterol in blood in present study (Fig. 1) indicated a good response of the liver cells related to the present treatment. This result was consistent with many authors’ reported that HDL-cholesterol cause reverse transport of cholesterol compound from extra-hepatic into the liver tissue [1-2,30-33]. In present study, the high level of serum total cholesterol was accompanied with an enhancement of HDL-cholesterol level.
Dietary adenine promoted liver phospholipids
The enhancement of serum lipids content in starvation rats indicated the secretion of those lipids
from the liver tissue was stimulated. However, how liver lipids profiles were difficult to predict from serum lipid profiles. It is because the lipid content in liver depends on results of two mechanisms: 1) secretion of VLDL from the liver, or 2) expression of lipogenic enzymes and genes combined with the level of fatty acids entering
Table 1. The effects of dietary adenine on growth
parameters
Group Basal diet Adenine
Initial body weight (g) 166 ± 4 165 ± 5
Final body weight (g) 210 ± 3 204 ± 4
Food intake (total, in gram) 154 ± 0 153 ± 2
Liver weight (g/100 g body weight) 4.4 ± 0.2 4.1 ± 0.1
Rats were paired-fed adenine supplemented diet or a diet without adenine (basal diet) for 10 days. Rats were killed by decapitation after a 9 h starvation. Values are expressed as mean± SEM of five rats. See EXPERIMENTAL SECTION for composition of diets.
Fig 1.Serum lipids level
Rats were paired-fed adenine supplemented diet or a diet without adenine (basal diet) for 10 days. Rats were killed by decapitation after a 9 h starvation. Values are expressed as mean± SEM of five rats. See EXPERIMENTAL SECTION for composition of diets. abDifferent letters indicate significant differences at P < 0.05.
Fig 2.Liver lipids content
Fig 3.The activities of lipogenic and lipolytic enzymes Rats were paired-fed adenine supplemented diet or a diet without adenine (basal diet) for 10 days. Rats were killed by decapitation after a 9-h starvation. Values are expressed as mean± SEM of five rats. See EXPERIMENTAL SECTION for composition of diets.abDifferent letters indicate significant differences at P < 0.05.
the mitochondrial β-oxidation pathway [34]. The present study showed that the increased liver lipid contents included PL, TG, and total cholesterol. As shown in Fig. 2, the liver PL content of adenine group increased significantly in comparison to the basal group, however both liver TG and cholesterol failed to reach significant level. Overall, the increased serum lipid secretion was associated with promotion of liver PL content in adenine-treated rats.
Dietary adenine promoted the activities of lipogenic but attenuated lipolytic enzymes
To clarify by which lipid content increased in liver, the activities of lipogenic and lipolytic enzymes were determined. The lipogenic and lipolytic enzymes determined in present study were FAS and CPT-1. As shown in Fig. 3, dietary food fortified with adenine promoted FAS activity by 35%, although the magnitude failed to reach significant level. This data suggested that the fatty acids biosynthesis was induced by the present treatment. It was because FAS is a rate-limiting enzyme of fatty acid biosynthesis as reported [1-2, 34-35]. The CPT-1 activity however decreased significantly in response to the treatment. Because CPT-1 is a key enzyme of fatty acid degradation [1-2,34-35], therefore, the lowered CPT-1 activity as shown in Fig. 3 indicated the degradation of fatty acids decreased. The increased fatty acid biosynthesis triggered the biosynthesis of liver lipids such as liver PL, TG, and cholesterol. The present treatment however promoted lipid secretion from hepatic tissue into bloodstream. It was therefore, the accumulation of fats in liver moderately increased. Overall, dietary adenine stimulated the biosynthesis of fatty acids in liver; however it ameliorated fatty acid degradation shown by the attenuation of CPT-1 activity (Fig. 3).
CONCLUSION
Dietary adenine reduced slightly growth of animal treated and promoted highly lipids secreted into the
bloodstream and liver PL contents but the treatment attenuated the fatty acid degradations
ACKNOWLEDGEMENT
The author wishes to express high appreciation for the suggestions and the continued encouragement from Dr. Yanagita, the Professor of Saga University, and excellent assistance of Dr. Koji Nagao in enzymatic determinations and the useful assistance from Dr. Yu-Ming Wang in handling instruments and animals. The appreciation is also given to all of the members of Laboratory of Applied Biochemistry-Saga University for the contributions. The author also gives thanks to the Japanese Monbukagakusho for providing the fund of the research.
REFERENCES
1. Lehninger, Nelson, and Cox, 1993, Principles of Biochemistry, 2nded., Worth Publishers, Inc. USA. 2. Stipanuk, M.H. 2006, Biochemical, Physiological,
and Molecular Aspects of Human Nutrition, 2nded.,, Published by Saunders-Elsevier, New York, 666-672.
3. Allen, L., deBenoist, B., and Dary, O. 2006,
Guidelines on food fortification with micronutrients, WHO Library Cataloguing-in-Publication Data, 73-80.
4. Website
http://ghr.nlm.nih.gov/ghr/glossary/adenine. Accessed July 10, 2009.
5. Burnstock G, 2007, Cell. Mol. Life Sci., 64, 12, 1471-1483.
6. Chan, E.S.L., Montesinos, M.C., Fernandez, P., Desai, A., Delano, D.L., Yee, H., Reiss, A.B., Pillinger, M.H., Chen, J-F., Schwarzschild, M.A., Friedman, S.L., and Cronstein, B.N. 2009, Br. J. Pharmacol., 148, 8, 1144-1155.
7. Vallon, V., Hlbauer, B.M., and Oswald, H. 2006,
Physiol. Rev.,86, 901-940.
8. Zimmermann, H., 2000, Naunyn-Schmiedeberg's Arch. Pharmacol.,362, 299-309.
9. Horiuchi, T., Dietrich, H.H., Tsugane, S., and Dacey Jr., R.G., 2001, Am. J. Physiol. Heart Circ. Physiol., 280, 767-776.
10. Sairenchi, T., Iso, H., Irie, F., Fukasawa, N., Yamagishi, K., Kanashiki, M., Saito, Y., Ota, H., and Nose, T., 2005,Hypertens. Res., 28, 901-909. 11. Aller, M.A., Vara, E., García, C., Nava, M.P.,
Angulo, A., Sánchez-Patán, F., Calderón, A., Vergara, P., and Jaime, A., 2006, World J. Gastroenterol.,12, 42, 6828-6834.
12. Sánchez-Patán, F., Anchuelo, R., Aller, M.A., Vara, E., García, C., Nava, M.P., and Arias, J., 2008,
13. Blanco-Vaca, F., Escolà-Gil, J.C., Martín-Campos, J.M., and Julve, J., 2001, J. Lipid Res., 42, 1727-1739.
14. Ohashi, R., Mu, H., Wang, X., Yao, Q., and Chen, C., 2005,Oxf. J. Med., 98, 12, 845-856.
15. Cohn, J.S., Wat, E., Kamili, A., and Tandy, S. 2008,
Curr. Opin. Lipidol., 19, 257-262.
16. Ralevic, V., and Burnstock, Y., 1998, Am. Soc. Pharmacol. Exp. Ther., 50, 3, 413-492.
17. Julve, J.C. Escola-Gil, J.C., Rotllan, N., Fievet,C., Vallez, E., de la Torre, C. , Ribas, V., Sloan, J.H., and Blanco-Vaca, F., 2010, Arterioscler. Thromb. Vasc. Biol., 30, 2, 232-238.
18. Hime, N.J., Drew, K.J., Wee, K., Barter, P.J., and Rye, K.A., 2006,J. Lipid Res., 47, 1, 115-122. 19. Tanaka, T., Doi, K., Mamiya, R.M., Negishi, K.,
Portilla, D., Sugaya, T., Fujita, T., and Noiri, E., 2009,Am. J. Pathol.,174, 4, 1203-1211.
20. Chiu, C.H., Lu, T.Y., Tseng Y-Y., and Tzu-Ming Pan, T-M., 2006, Appl. Microbiol. Biotechnol., 71, 2, 238-245.
21. Kit, Y.Y., Semenov, D.V., Kuligina, E.V., and Richter, V.A., 2000,Biochemistry (Mosc.).65, 2, 237-43. 22. Adachi, Y., Sasagawa, I., Tateno, T., Tomaru, M.,
Kubota, Y., and Nakada T., 2009, Endocrinol. Diabetes,30, 2, 115-118.
23. Siahanidou, T., Mandyla, H., Papassotiriou, I., and Anagnostakis, D., 2004, J. Pediatr. Gastroenterol. Nutr.,38, 56–60.
24. Folch, J., Lees, M., and Sloane-Starley, G.H., 1957,J. Biol. Chem., 226, 497-509.
25. Fletcher, M.M., 1968,Clin. Chim. Acta, 22, 393-7. 26. Barlett, G.R., 1959,J. Biol. Chem., 234, 466-468. 27. Nagao, K., Inoue, N., Wang, Y.M., and Yanagita,
T., 2005,J. Nutr., 135, 9-13.
28. Lowry, O.H., Rosebrough, N.J., Farr, A.L., and Randal, R.J., 1951,J. Biol. Chem., 193, 265-275. 29. Duncan, D. B., 1955,Biometrics,11, 1-42.
30. Hui, T.Y., Olivier, L.M., Kang, S., and Davis, R.A., 2002,J. Lipid Res., 43, 785-793.
31. Elzinga, B.M., Havinga, R., Baller, J.F.W., Wolters, H., Bloks, V., Mensenkamp, A.R., Kuipers, F., Henkjan, J., and Verkade, H.J., 2002, Biochim. Biophys. Acta, 1573, 9-20.
32. Eto, N., Miyata, Y., Ohno, H., and Yamashita, T. 2005,Nephrol. Dial. Transplant., 20, 1378-1384. 33. Yanagita, T., Han, S-Y., Wang, Y-M., Tsuruta, Y.,
and Anno, T., 2003,Nutrition, 19,140-143.
34. Buang, Y., Wang, Y.M., Cha, J.Y., Nagao, K., and Yanagita, T., 2005,Nutrition, 21, 867-873.