The Attitudinal and Behavioral Effects
of Nonfinancial Measures
Putri Paramita Agritansia
Faculty of Economics and Business, Universitas Gadjah Mada
Mahfud Sholihin
Accounting Department, Faculty of Economics and Business, Universitas Gadjah Mada Gadjah Mada International Journal of Business
Vol. 13, No. 3 (September - December 2011): 267 - 286
Abstract: A recent study by Lau and Moser (2008) found that the use of nonfinancial measures for managerial performance evaluation is positively associated with managerial performance via procedural fairness and organizational commitment. It is not clear, however, whether the findings are generalizable to other contexts. Using very different samples, the objectives of this study are to reexamine and to extend Lau and Moser’s model. Our paper is only able to partially support their model, suggesting that manage-ment control systems should be designed to fit the contexts.
Abstrak: Hasil penelitian Lau dan Moser (2008) menemukan bahwa penggunaan ukuran-ukuran nonfinansial untuk mengevaluasi kinerja manajerial berhubungan positif dengan kinerja manajerial melalui keadilan prosedural dan komitmen organisasional. Meski demikian, tidak ada kejelasan apakah temuan mereka bisa digeneralisasi dalam konteks lain. Menggunakan sampel yang sangat berbeda, tujuan dari penelitian ini adalah untuk menguji kembali dan memperluas model Lau dan Moser. Penelitian kami hanya mampu memberikan dukungan sebagian atas model yang mereka ajukan. Temuan kami menunjukkan bahwa sistem pengendalian manajemen harus didesain agar sesuai dengan konteks.
Introduction
This paper aims to examine the attitu-dinal and behavioral consequences of the use of nonfinancial measures in managerial per-formance evaluation. Whilst the literature suggests that companies should implement nonfinancial measures to complement finan-cial measures (e.g. Kaplan and Norton 1996), there is a lack of empirical confidence on the effect of nonfinancial measures on subordi-nate managers’ attitudes and behavior.1 Among the rare studies is the one conducted by Lau and Moser (2008)-hereafter referred to as L & M.
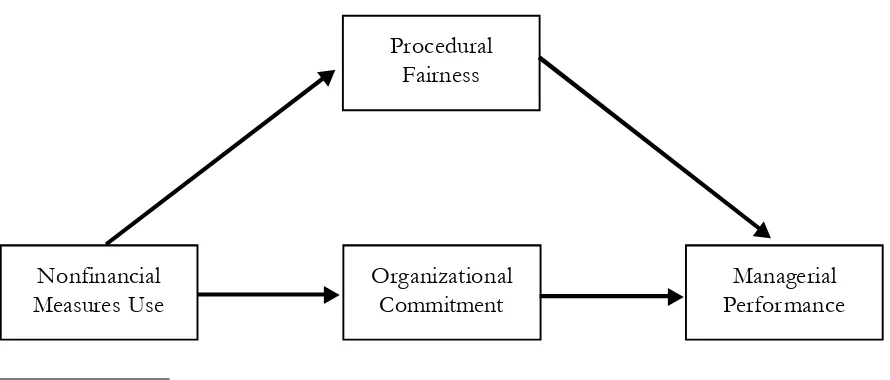
L & M examined whether the use of nonfinancial measures affects managerial per-formance and whether such effect is medi-ated by procedural fairness and organizational commitment. Their model is depicted in Fig-ure 1. Using samples of senior managers of manufacturing companies in the UK, they found that the use of nonfinancial measures positively affects managerial performance via
procedural fairness and organizational com-mitment.
Whilst the study of L & M has advanced our understanding on the attitudinal and be-havioral effects of nonfinancial measures, there are some issues that merit further in-vestigation which will be addressed by this paper. First, whilst L& M use senior manag-ers of manufacturing companies in the UK, it is not clear whether their findings are gen-eralizable into other contexts such as differ-ent countries and managerial levels. The first objective of this paper is to replicate and to test the external validity of their study using very different samples. In doing so, this cur-rent study uses samples derived from Indo-nesian managers at lower and medium mana-gerial levels. This type of study is important as emphasized by Lindsay and Ehrenberg (1993), “It (replication) is needed not merely to validate one’s findings, but more impor-tantly, to establish the increasing range of radically different conditions under which the findings hold, and the predictable exceptions”
Figure 1. Lau and Moser’s (2008) Model
Nonfinancial Measures Use
Procedural Fairness
Managerial Performance Organizational
Commitment
1 In contrast, there are a lot of studies devoted to the effects of financial (accounting) performance measures on
(p. 217, parentheses added). Particular to the role of procedural justice,2 Leung (2005) calls for researchers to examine procedural fairness development in various contexts and notes that “a universal concern of justice… does not mean that all justice effects are necessarily generalizable …” (p. 557). We use Indone-sian managers as our sample because whilst a substantial number of Indonesian compa-nies implement nonfinancial measures, such as the ones contained in the Balanced Scorecard (Supriyadi 2010), there is a lack of systematic studies on the attitudinal and behavioral effects of nonfinancial mesures (Lau and Sholihin 2005).
Secondly, in analyzing their structural model, with 149 samples, L&M have used AMOS. Bacon (1997) stated that to properly utilize AMOS, a study has to have 200 samples at the minimum. Consequently, we reexamine L & M’s model using Partial Least Square (PLS) with SmartPLS version. 2.0
soft-ware. We used PLS as this approach is able to handle small samples(Wold 1982; Wold et al. 1987).
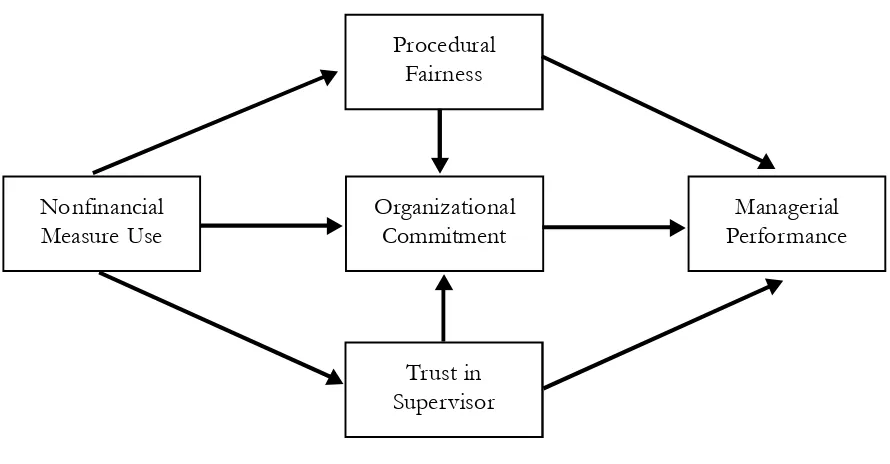
Thirdly, since previous accounting stud-ies (e.g. Lau and Sholihin 2005) found that nonfinancial measures is associated with trust and trust is associated with organizational commitment (Sholihin and Pike 2009) and with managerial performance (Sholihin et al. 2004), this study examines if trust mediates: (1) the relationship between nonfinancial measures and managerial performance; and (2) the relationship between organizational commitment and managerial performance. Hence, this study does not merely replicate the L & M study, but it also extends their study. The model for our study is portrayed in Figure 2.
Our study partially supports L & M be-cause we do not find the positive association between nonfinancial measures and proce-dural fairness. Using the extended model, we
2 We use the terms procedural justice and procedural fairness interchangeably.
Figure 2. Model of Our Study
Nonfinancial
Measure Use OrganizationalCommitment PerformanceManagerial
Procedural Fairness
Trust in Supervisor
do not find a positive association between nonfinancial measures and trust.
The rest of the paper is organized as fol-lows. The next section will discuss the litera-ture review and hypotheses development. This will be followed by a presentation of the research method, research findings, con-clusions, limitations, and suggestions for fu-ture research.
Literature Review and
Hypotheses Development
Nonfinancial Measures and
Procedural Fairness
The implementation of performance measurement systems, argued by Ittner and Larcker (1998), substantially support organi-zations in committing strategic plans, evalu-ating goals attainment, and formulevalu-ating mana-gerial compensation plans. Merchant (2006) emphasizes that performance measures play a key role in raising managers’ motivation to meet organization goals by combining goals attainment and various incentives in mana-gerial performance evaluation systems.
Considering the limitatons of financial measures alone, Kaplan (1996) and some other researchers promote the implementa-tion of nonfinancial measures such as prod-uct innovation, prodprod-uct leadership, and cus-tomer loyalty. These relatively new measures are believed to be better at indicating organi-zation future profitability than annual profit. Vaivio (1999) contends that “Non-financial measures could provide more penetrating control, going beyond the limits of aggregated financial measurements” (p. 410). Further-more, Kaplan and Norton (1996a) mention that nonfinancial measures may perform as
primary indicators towards an organization’s future performance and create a synergy among long-term organizational objectives. In addition, Ittner and Larcker (2000) sug-gest nonfinancial measures may also provide indirect quantitative information on a company’s intangible assets, improve manag-ers’ performance through transparent evalu-ation systems and in particular present sig-nificant indicators related to an organization’s future financial performance.
This paper argues that the use of nonfi-nancial measures for managerial organization performance evaluation enables superiors to evaluate subordinates by using multiple di-verse perspectives that may enhance subor-dinates’ perception of procedural fairness. With reference to Viavio’s (1999) contention, we may conclude that the use of nonfinan-cial measures in evaluating managerial per-formance may be perceived as a fair process compared to the use of financial measures. For example, due to the process and nature of the work of research and development department mostly taking some time to show desirable progress which often cannot be well reflected in financial terms, if subordinates are evaluated using financial measures they will perceive such an evaluation process to be unfair. In contrast, performance evalua-tion systems that are implemented by con-sidering the nature and process at the research and development department will make sub-ordinates think that the evaluation process is fair. Empirically, Lau and Sholihin (2005) and L&M found the implementation of nonfinan-cial measures is positively associated with pro-cedural fairness. Therefore, the following hy-pothesis is to be tested:
Procedural Fairness and
Managerial Performance
The term procedural fairness is com-monly associated with Thibaut and Walker’s (1975) study on procedural justice. In their work, they put different evaluation system approaches specifically on the process con-trol and outcome. Based on the work of Thibaut and Walker (1975), Lind and Tyler (1988) observe that there are three signifi-cant findings of Thibaut and Walker (1975): (1) perceptions of procedural justice result in increased satisfaction; (2) procedural jus-tice is the most important determinant of procedural preferences; and (3) high process control procedures lead to high procedural justice judgments. In this regard, by compar-ing the term of procedural justice and fair-ness, we believe that besides there being sig-nificant concept similarities between proce-dural justice and fairness, proceproce-dural fairness itself may have been triggered by the inno-vation of procedural justice. Therefore, we maintain the usage of the term procedural justice into procedural fairness in order to not mislead and extend the term of procedural justice itself.
As the term procedural fairness may cover a wide range of concepts, in this study we focus procedural fairness on managers’ perceptions with respect to all aspects of fair-ness in the organizational processes that are used by superiors to evaluate managers’ per-formance, communicate performance feed-back and determine their rewards such as promotion and pay increases (Folger and Konovsky 1989). Expectancy theory suggests that better subordinates’ performance may be driven by their belief that the measurement evaluation procedures are fair (Vroom 1964; Porter and Lawler 1968). Additionally, since previous studies found that procedural
fair-ness affects managerial performance in vari-ous contexts (Lind and Tyler 1988; Libby 1999; Libby 2001; Wentzel 2002; Little et al. 2002), thus, we propose that procedural fair-ness is positively associated with managerial performance in many ways that may moti-vate subordinates to improve their working performances. Therefore, the following hy-pothesis is to be tested:
Ha2: Procedural fairness is positively associated with managerial performance
Nonfinancial Measures and
Organizational Commitment
Following L & M, we hypothesize that the use of nonfinancial measures is positively associated with organizational commitment. This is because the nature of nonfinancial measures is capable of capturing managers’ performance from a wide range of perspec-tives. “Managers evaluated by such measures are likely to harbor favorable organizational attitudes, including their commitment to the organization which uses such measures” (L & M: 58). Therefore we hypothesize as fol-lows:
Ha3: Nonfinancial measures use is positively asso-ciated with organizational commitment.
Organizational Commitment and
Managerial Performance
As previously stated, we specify orga-nizational commitment in this study as affec-tive organizational commitment. Established by emotional attachment towards the orga-nization, affective commitment may escort employees’ willingness to not only remain in the organization but also to accelerate their working performance (Demir et al. 2009). To better indicate the rising emotional attach-ment to the organization, Mowday et al. (1982) suggested three characteristics of or-ganizational commitment: identification (be-lief in and the acceptance of organizational goals and values), involvement (willingness to exert effort on behalf of the organization), and loyalty (strong desire to maintain mem-bership of the organization). By having those characteristics, managers with strong organi-zational commitment will show active in-volvement in, and contribution to, the orga-nization. Driven by their emotional attach-ment, managers will also indicate the inten-tion to work beyond what they are supposed to do. Supported by a number of empirical studies in the accounting literature (e.g. Nouri
and Parker 1998; Chong and Eggleton 2007) that found organizational commitment is as-sociated with managerial performance, this study hypothesizes that :
Ha4: Organizational commitment is positively asso-ciated with performance.
Nonfinancial Measures and Trust
As the concept of trust varies widely, we based our study on previous accounting studies (e.g. Hopwood 1972; Otley 1978; Ross 1994; Lau and Sholihin 2005) by focus-ing on trust as interpersonal trust. Accordfocus-ing to Read (1962), subordinates’ interpersonal trust is a “subordinate’s trust or confidence in the superior’s motives and intentions with respect to matters relevant to the subordinate’s career and status in the organi-zation.” Whitener et al. (1998) argue that both performance evaluation and incentive sys-tems can affect managerial attitude that may influence subordinates’ trust towards their superiors. At this stage, Zand (1997) supports Whitener et al. (1998) only if the incentive system is collaborative, integrative and ben-efits both parties. Therefore, it is significant for organizations to design their performance evaluation systems so that they are able to facilitate the enhancement of subordinates’ trust towards their superiors.nonfinan-cial measures. It is believed that the qualita-tive measures are capable of triggering desir-able performances by subordinates that may assist the success of the organization. Once the qualitative measures are precisely evalu-ated and reflect the nature of the organiza-tion or, to be specific, the unit or department subordinates are involved in, subordinates will likely put more reliance on their superi-ors.
Secondly, evaluating subordinates based on short-term financial, quantitative mea-sures may decipherable as the inability of man-agement in conceiving the various aspects of both subordinates and organization properly. On the other hand, superiors who based their evaluation on long-term, nonfinancial per-spectives tend to receive higher subordinates’ respect and trust regarding her/his accept-able understanding in carrying out perfor-mance evaluation systems. Thus, subordi-nates may view superiors as having reliable managerial attitude (Mayer et al. 1995).
Thirdly, as indicated by the utilization of multiple nonfinancial measures, subordi-nates may label superiors as having a profound interest on the organization and subordinates since the exertion of varied nonfinancial measures may “…reflect the complexities of the work environment and (consider) the va-riety of contributions that employees make” (Atkinson et al. 2001: 407) (parenthesis added). Therefore, it enables a subordinate to not only be labeled as a poor or good per-former based on one indicator that is used on a pro rata basis, but they may be benefi-cially evaluated based on multiple factors, which in part may indicate their various tar-get achievements (Lipe and Salterio 2002). In turn, such conditions may reduce subordinates’ career insecurity. In addition, subordinates are likely to view their superiors as having a be-nevolent attitude in evaluating subordinates’
performance. Referring to Whitener et al. (1998), together with the rising subordinates’ perception of benevolence, subordinates’ awareness of superiors’ reliability will also rising. The more reliable the superiors seem to their subordinates, simultaneously, the more subordinates will have a propensity to trust their superiors (Mayer et al. 1995). Empirically, supported by Lau and Sholihin (2005) and L & M who argue that the use of nonfinancial performance measures in evalu-ating managers is positively associated with trust, we therefore expect that the use of nonfinancial performance measures will be positively associated with trust in superiors. The following hypothesis is therefore to be tested:
Ha5: The use of nonfinancial measures is associ-ated with interpersonal trust.
Trust and Managerial
Performance
emotional bonds between individuals may base the formation of trust.
Lippit (1982) further argues that trust among people may increase problem solving capability and improve performance. Sup-porting Lippit (1982), Zand (1997) gives ad-ditional suggestions, which in his point of view show that trust successfully built be-tween two people will be highly capable of effectively solving problems, assisting others, contributing performance to team work, and enhancing the quality and implementation capacities of a decision. It is likely that the level of decision quality will be followed by the rate of working performance. Reina and Reina (1999: 8) states that ‘directly or indi-rectly, trust is related to individual, group, and organisational performance’. This gives rise to the hypothesis:
Ha6: Trust is positively associated with performance
Trust and Organizational
Commitment
Drawing on the findings of Ketchand and Strawser (2001), Lau et al. (2008) argue that since subordinates mostly identify with an organization through their supervisors’ attitudes, trust in supervisors may be associ-ated with organizational commitment. Thus, subordinates will dedicate similar feelings towards both their superiors and organization, either positive or negative. Put simply, once subordinates act positively (or negatively) towards their superiors, who act on behalf of the organization, they at the same time are also likely to indicate positive (or nega-tive) attitudes and feelings towards their or-ganization. It means that the level of trust in superiors could possibly help to determine subordinates’ attitude towards the organiza-tion. “This may lead to the subordinates bonding with the organization, and hence,
high organizational commitment” (Lau et al. 2008: 126). Consistent with empirical evi-dence shown by Lau et al. (2008) and Sholihin and Pike (2009) trust in supervisors is posi-tively associated with organizational commit-ment. We therefore, hypothesize:
Ha7: Trust in superiors is positively related to or-ganizational commitment.
Procedural Fairness and
Organizational Commitment
commitment. Using a sample of managers from UK manufacturing organizations, L & M found that procedural fairness is positively associated with organizational commitment. We therefore expect that procedural fairness will be positively associated with organiza-tional commitment. Therefore we hypoth-esize:
Ha8: Procedural justice is positively associated with organizational commitment.
Research Method
Data and Sample
To test the hypotheses, we use data gathered by means of a questionnaire survey. Our samples are managers who were taking their master degree in Master of Management (MM) program, Faculty of Economics and Business (FEB), Universitas Gadjah Mada (UGM).We distributed the questionnaires and requested them to complete when they were in the class of business research method.
Descriptive statistics reveal that our samples are managers with an average age of 30, have 4 years’ experience in their current area of responsibilities, and 3 years in their current position, ranging from top level man-agement (9 people), middle level ment (35 people), and lower level
manage-ment (49 people). They have, on average, 374 employees below their scope of responsibili-ties. As for the kind of industries, 54 respon-dents belong to service industries, while the rest are manufacturing, commerce, mining industries, and others. As for their area of responsibilities, most respondents are from marketing department.
Variables and Their Measurement
Nonfinancial measures
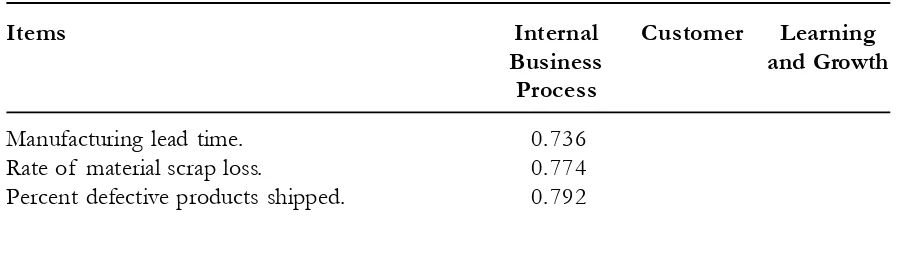
Whilst L&M used 15-items, we used 17-items in the questionnaire as previously used by Lau and Sholihin (2005). The items were originally developed by Hoque et al. (2001) which were derived from Kaplan and Norton’s (1992) three dimensions of nonfinancial mea-sures in the Balanced Scorecard. As the in-strument was originally made to measure organizational performance, we use the in-struction of Hopwood (1972) since we try to measure managerial performance. We em-ployed the one previously used by Lau and Sholihin (2005) because the instrument was successfully used in the Indonesian context.The 17 nonfinancial measure items can be seen in Table 1.
Factor analysis was performed to exam-ine whether the 17 nonfinancial items are still consistent with the three nonfinancial mea-sures dimensions suggested by Kaplan and
Table 1. Factor Loadings for Nonfinancial Measures Items
Items Internal Customer Learning
Business and Growth
Process
Manufacturing lead time. 0.736
Rate of material scrap loss. 0.774
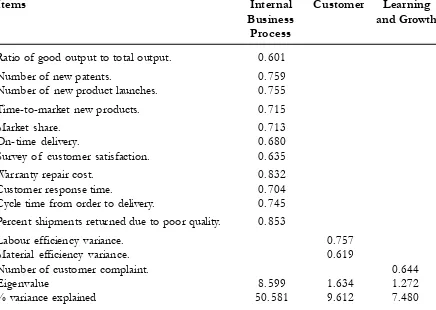
Norton (1992). The results reveal there are three factors that have eigenvalue of greater than one, which all items are loaded satisfac-torily into each expected perspective (factor loadings of greater than 0.50) as presented in Table 1. The cronbach’s alpha coefficient for the 17 nonfinancial items was 0.934. This indicates the high internal consistency of the 17 items.
Managerial performance
This variable is measured using an in-strument developed by Mahoney et al. (1963). The instrument consists of a 9-item 7-point Likert scale and asked respondents to rate the degree of their performance in the area of planning, coordinating, evaluating, investigat-ing, supervisinvestigat-ing, staffinvestigat-ing, negotiatinvestigat-ing, repre-senting, and overall performance in their
or-ganization. This managerial performance measurement instrument is also the one used by L & M.
Consistent with L & M, in our analysis we use the overall performance dimension. However, in order to ensure that overall per-formance is capable of representing the eight dimensions of managerial performance, we regressed the eight dimensions to overall per-formance. This technique is consistent with prior studies by Brownell (1982), Kren (1992), and Lau et al. (1995) as mentioned in L&M. The results show the eight dimensions are capable of explaining 67 percent variance of overall performance. This result is beyond the 55 percent benchmark suggested by Mahoney et al. (1963) (L&M 2008) and prior study by L&M that only results in 57.7 per-cent.
Table 1 (Continued)
Items Internal Customer Learning
Business and Growth
Process
Ratio of good output to total output. 0.601
Number of new patents. 0.759
Number of new product launches. 0.755
Time-to-market new products. 0.715
Market share. 0.713
On-time delivery. 0.680
Survey of customer satisfaction. 0.635
Warranty repair cost. 0.832
Customer response time. 0.704
Cycle time from order to delivery. 0.745
Percent shipments returned due to poor quality. 0.853
Labour efficiency variance. 0.757
Material efficiency variance. 0.619
Number of customer complaint. 0.644
Eigenvalue 8.599 1.634 1.272
Perception of procedural fairness
This variable is measured using an instru-ment developed by McFarlin and Sweeney (1992) and previously used by Lau and Sholihin (2005), L&M, and Sholihin and Pike (2009). This 4-item 5-point Likert scale asked respondents to rate the fairness of pro-cedures used to (1) evaluate employee per-formance; (2) determine promotions; (3) com-municate performance feedback; (4) deter-mine pay increases. The rotated factor load-ings for the four items of procedural fairness range from 0.832 to 0.877 and load on a single factor with eigenvalue of 2.925 that explains 73.136 percent of the variance. The four items have cronbach’s alpha of 0.877. The mean score is 13.09 with standard deviation 3.085.
Organizational commitment
This variable is captured using an in-strument developed by Mowday et al. (1974). In this 9-item 7-point Likert scale, respon-dents are required to rate their agreement on various statements, such as: (1) I talk up this organization to my friends as a great organi-zation to work for; (2) I am proud to tell oth-ers that I am part of this organization; and (3) This job is my ideal job.
Factor analysis indicates all nine orga-nizational commitment items are loaded sat-isfactorily on one factor with eigenvalue of 6.228 that explains 69.203 percent of the variance. Factor loadings range from 0.775 to 0.898. The mean is 46.04 with standard deviation of 10.058. Cronbach’s alpha cap-tured at 0.943.
Interpersonal Trust
This variable is measured using an instru-ment developed by Read (1962) and used by Lau and Sholihin (2005) and Sholihin and Pike (2009). This 4-item 5-point Likert scale
instrument asked respondents to assess the intensity of (1) their supervisors’ actions in taking opportunities that may advance their interest; (2) their freedom to have discussions with their supervisors without worrying their positions; (3) feeling confidence that their supervisors keep them fully and frankly up-dated concerning issues that may attracts their concerns; and (4) respondents’ trust concern-ing their supervisors’ justifiable manner in taking decisions that are against their inter-ests.
A factor analysis was undertaken to ensure the unidimensional nature of the vari-able trust in supervisors. The results indicate that only one factor with eigenvalue of greater than one was extracted (eigenvalue= 2.804; total variance explained= 70.112%). Factor loadings for trust in supervisors loaded satis-factorily from 0.803 to 0.865. Cronbach’s al-pha captures at 0.856 with mean 13.32 and standard deviation 3.146.
Results and Discussions
Using PLS we are able to measure both measurement and structural model. Measure-ment model is used to evaluate the validity and reliability of the instrument. Validity is evaluated by examining convergent and dis-criminant validity from each of the indica-tors, whereas reliability is examined through evaluating Cronbach’s Alpha and composite reliability.Structural model is used to evalu-ate the goodness of fit of the model. In PLS approach, it is evaluated by examining the variance percentage explained by the R2 value of independent latent variable. The stability of this estimation is evaluated using t test with
bootstrapping process.
Measurement Model
Validity
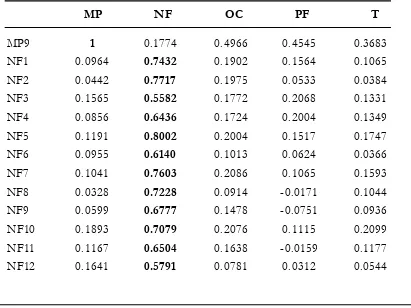
The results of measurement model test are shown in Table 2 and Table 3. Table 2
Table 2. Cross Loadings
MP NF OC PF T
MP9 1 0.1774 0.4966 0.4545 0.3683
NF1 0.0964 0.7432 0.1902 0.1564 0.1065
NF2 0.0442 0.7717 0.1975 0.0533 0.0384
NF3 0.1565 0.5582 0.1772 0.2068 0.1331
NF4 0.0856 0.6436 0.1724 0.2004 0.1349
NF5 0.1191 0.8002 0.2004 0.1517 0.1747
NF6 0.0955 0.6140 0.1013 0.0624 0.0366
NF7 0.1041 0.7603 0.2086 0.1065 0.1593
NF8 0.0328 0.7228 0.0914 -0.0171 0.1044
NF9 0.0599 0.6777 0.1478 -0.0751 0.0936
NF10 0.1893 0.7079 0.2076 0.1115 0.2099
NF11 0.1167 0.6504 0.1638 -0.0159 0.1177
NF12 0.1641 0.5791 0.0781 0.0312 0.0544
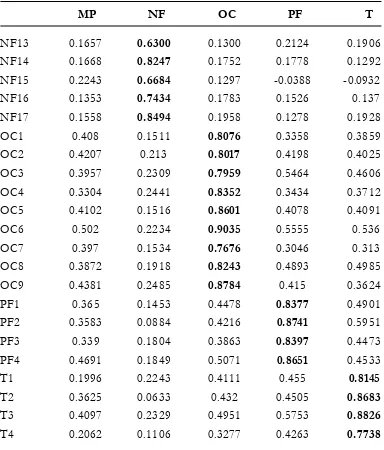
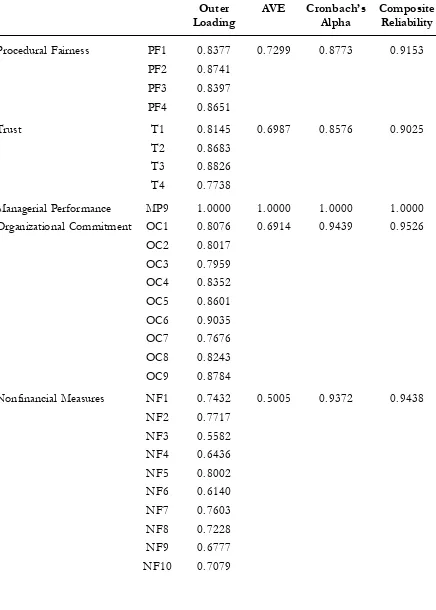
shows the factor loading as well as the cross loading of the variables studied. The results indicate all items load on the expected factor above 0.70 except NF3, NF4, NF6, NF9, NF11, NF12, NF13, and NF15. However, those items have factor loading above 0.50 on the expected factor and none of those items load higher on the unexpected factor. Table 3 reveals that all indicators have AVE value higher than 0.50. Overall, it can be con-cluded that the measures are valid both in terms of convergent and discriminant valid-ity and can be used for further analysis (See Hair et al. 2006; and Hulland 2009).
Reliability
Table 2 (Continued)
MP NF OC PF T
NF13 0.1657 0.6300 0.1300 0.2124 0.1906
NF14 0.1668 0.8247 0.1752 0.1778 0.1292
NF15 0.2243 0.6684 0.1297 -0.0388 -0.0932
NF16 0.1353 0.7434 0.1783 0.1526 0.137
NF17 0.1558 0.8494 0.1958 0.1278 0.1928
OC1 0.408 0.1511 0.8076 0.3358 0.3859
OC2 0.4207 0.213 0.8017 0.4198 0.4025
OC3 0.3957 0.2309 0.7959 0.5464 0.4606
OC4 0.3304 0.2441 0.8352 0.3434 0.3712
OC5 0.4102 0.1516 0.8601 0.4078 0.4091
OC6 0.502 0.2234 0.9035 0.5555 0.536
OC7 0.397 0.1534 0.7676 0.3046 0.313
OC8 0.3872 0.1918 0.8243 0.4893 0.4985
OC9 0.4381 0.2485 0.8784 0.415 0.3624
PF1 0.365 0.1453 0.4478 0.8377 0.4901
PF2 0.3583 0.0884 0.4216 0.8741 0.5951
PF3 0.339 0.1804 0.3863 0.8397 0.4473
PF4 0.4691 0.1849 0.5071 0.8651 0.4533
T1 0.1996 0.2243 0.4111 0.455 0.8145
T2 0.3625 0.0633 0.432 0.4505 0.8683
T3 0.4097 0.2329 0.4951 0.5753 0.8826
Table 3. Results of Measurement Model
Outer AVE Cronbach’s Composite
Loading Alpha Reliability
Procedural Fairness PF1 0.8377 0.7299 0.8773 0.9153
PF2 0.8741
PF3 0.8397
PF4 0.8651
Trust T1 0.8145 0.6987 0.8576 0.9025
T2 0.8683
T3 0.8826
T4 0.7738
Managerial Performance MP9 1.0000 1.0000 1.0000 1.0000
Organizational Commitment OC1 0.8076 0.6914 0.9439 0.9526
OC2 0.8017
OC3 0.7959
OC4 0.8352
OC5 0.8601
OC6 0.9035
OC7 0.7676
OC8 0.8243
OC9 0.8784
Nonfinancial Measures NF1 0.7432 0.5005 0.9372 0.9438
NF2 0.7717
NF3 0.5582
NF4 0.6436
NF5 0.8002
NF6 0.6140
NF7 0.7603
NF8 0.7228
NF9 0.6777
Structural Model
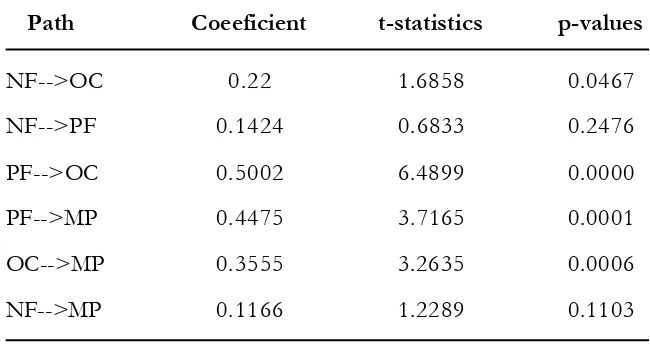
Recall that the first objective of our study is to test the generalizability of L & M findings. Therefore, firstly we retest L & M’s model using our sample. The results are pre-sented in table 4. The table shows that the use of nonfinancial measures is positively associated with organizational commitment (r = 0.220; p<0.05). However, the use of nonfinancial measures is not associated with procedural fairness nor managerial perfor-mance. This is in contrast to L & M’s results. Further, the table indicates that procedural
fairness is associated organizational commit-ment (r = 0.500; p<0.01) and managerial performance (r = 0.448; p<0.01). Overall, our study partially support L & M’s study.
Having seen that our study partially sup-ports L & M’s study, we then examine our model which is the extension of L & M’s model. Recall, our model includes trust as the potential mediating variable on the relation-ship between: (1) nonfinancial measures and managerial performance; and (2) organiza-tional commitment and managerial perfor-mance. The results are depicted in Table 5.
Table 3 (Continued )
Outer AVE Cronbach’s Composite
Loading Alpha Reliability
NF11 0.6504
NF12 0.5791
NF13 0.6300
NF14 0.8247
NF15 0.6684
NF16 0.7434
NF17 0.8494
Table 4. The Results of PLS Using L & M’s Model
Path Coeeficient t-statistics p-values
NF-->OC 0.22 1.6858 0.0467
NF-->PF 0.1424 0.6833 0.2476
PF-->OC 0.5002 6.4899 0.0000
PF-->MP 0.4475 3.7165 0.0001
OC-->MP 0.3555 3.2635 0.0006
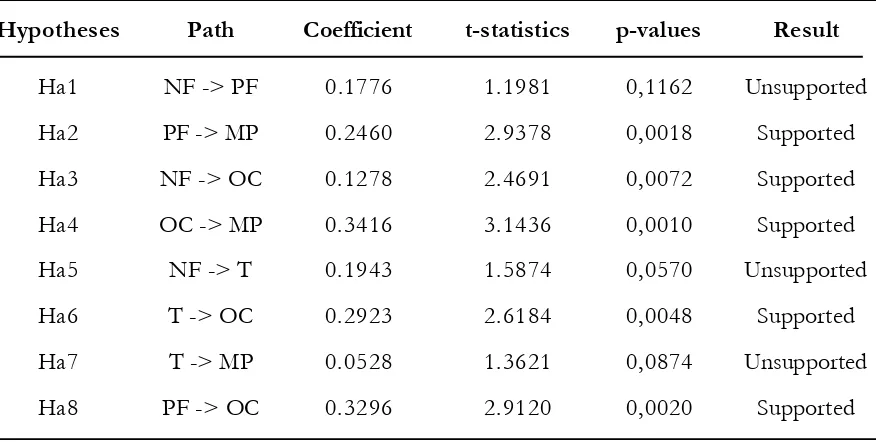
The table shows that nonfinancial measures are positively associated with organizational commitment and organizational commitment is positively associated with managerial per-formance. The use of nonfinancial measures, however, is not associated with procedural fairness and trust. The table also indicates that procedural fairness is associated with or-ganizational commitment and managerial performance. Further, it reveals that trust is associated with organizational commitment but not with managerial performance. R2 of our overall model with managerial perfor-mance as the ultimate dependent variable is 0.301.
Conclusions, Limitations, and
Suggestions for Future
Research
The objectives of this study are: (1) to examine the generalizability of L & M’s study; and (2) to extend the L & M’s model. L &M’s model argues that the use of nonfinancial measures in managerial performance
evalua-tion will result in funcevalua-tional attitudes and behavior. They found that the use of nonfi-nancial measures is positively associated with procedural fairness and organizational com-mitment which in turn positively affects managerial performance. Using UK senior managers as their sample, their findings sup-port their hypotheses. Our study, using Indo-nesian managers, the majority of whom are from medium and lower managerial levels, reveals that nonfinancial measures usage is positively associated with organizational commitment but not with procedural fairness. Whilst our study is unable to support all L & M’s findings, our results are consistent with organizational justice literature that says “a universal concern of justice…. does not mean that all justice effects are necessarily generalisable …” (Leung 2005: 557). More-over, Colquitt and Jackson (2006) have shown that fairness judgement is dependent upon context.
Using the extended model which in-cludes trust as the potential mediating vari-ables on the relationship between: (1)
nonfi-Table 5. The Results of Structural Model Using Our Model
Hypotheses Path Coefficient t-statistics p-values Result
Ha1 NF -> PF 0.1776 1.1981 0,1162 Unsupported
Ha2 PF -> MP 0.2460 2.9378 0,0018 Supported
Ha3 NF -> OC 0.1278 2.4691 0,0072 Supported
Ha4 OC -> MP 0.3416 3.1436 0,0010 Supported
Ha5 NF -> T 0.1943 1.5874 0,0570 Unsupported
Ha6 T -> OC 0.2923 2.6184 0,0048 Supported
Ha7 T -> MP 0.0528 1.3621 0,0874 Unsupported
nancial measures use and managerial perfor-mance; (2) organizational commitment and managerial performance. Our results, how-ever, do not support the proposed mediating roles of trust.
The study, however, should be inter-preted cautiously due to the limitations asso-ciated with it. First, as this study uses a sur-vey approach, various inherent limitations
associated with such an approach should be acknowledged. Future studies should exam-ine the topic using other approaches, such as experimental study. The second limitation is related to the sampling method. Whilst our study uses convenience sampling approach, future studies can use a random sampling ap-proach.
References
Angle, H. L., and J. L. Perry. 1981. An empirical assessment of organizational commitment and organiza-tional effectiveness. Administrative Science Quarterly 26 (1): 1-14.
Atkinson, A. A., R. D. Banker, R. S. Kaplan, S. M. Young. 2001. Management accounting. New Jersey: Prentice Hall International, Inc.
Bacon, L. D. 1997. Using AMOS for structural modeling in market research. SPSS White Paper: 1-18. Becker, H. 1960. Notes on the concept of commitment. American Journal of Sociology: 32 - 42.
Chin, W. W. 1998. The partial least squares approach to structural equation modeling. In Marcoulides, G. A. (ed.), Modern Methods for Business Research. London: Lawrence Erlbaum Associates.
Chong, V. K., and I. R. C. Eggleton. 2007. The impact of reliance on incentive-based compensation schemes, information asymmetry and organisational commitment on managerial performance.
Management Accounting Research 18 (3): 312-342.
Demir, C. C., B. Sahin, C. K. Teke, C. M. Ucar, and O, Kursun. 2009. Organizational commitment of miliraty physicians. Military Medicine 174 (9): 929-935.
Derfuss, K. 2009. The relationship of budgetary participation and reliance on accounting performance measures with individual-level consequent variables: A meta-analysis. European Accounting Review 18 (2): 203-239.
Folger, R., and Konovsky, M. A. (1989) Effects of procedural and distributive justice on reactions to pay raise decisions. Academy of Management Journal 32 (1): 115.
Hair, J. F., R. L. Tatham, R. E. Anderson, and W. Black. 2006. Multivariate Data Analysis. New Jersey: Prentice Hall.
Hartmann, F. G. H. 2000. The appropriateness of RAPM: Toward the further development of theory.
Accounting, Organizations and Society 25 (4-5): 451-482.
Hopwood, A. G. 1972. An empirical study of role of accounting data in performance evaluation. Journal of Accounting Research 10 (Supplement): 156-182.
Hoque, Z., L. Mia, and M. Alam. 2001. Market competition, computer-aided manufacturing and use of multiple performance measures: An empirical study. British Accounting Review 33: 23-45.
Ittner, C. D., and D. F. Larcker. 1998. Innovations in performance measurement: Trends and research implications. Journal of Management Accounting Research 10: 205-238.
Ittner, C., and D. F. Larcker. 2000. A bigger yardstick for company performance. FT Mastering
Manage-ment (November): 8-11.
Johnson, H. T., and R. S. Kaplan. 1987. Relevance Lost: The Rise and Fall of Management Accounting. Boston, Mass: Harvard Business School Press.
Kaplan, R. S. 1983. Measuring manufcaturing performance: A new challenge for managerial accounting research. The Accounting Review 58 (4): 686–705.
Kaplan, R. S., and D. P. Norton. 1992. The balanced scorecard: Measures that drive performance. Harvard
Business Review (January–February): 71-79.
Kaplan, R. S., and D. P. Norton. 1996. The Balanced Scorecard: Translating Strategy Into Action. Boston, MA: Harvard Business School Publishing.
Ketchand, A. A., and J. R. Strawser. 2001. Multiple dimensions of organizational commitment: Implica-tions for future accounting research. Behavioral Research in Accounting 13: 221 - 251.
Lau, C. M., and A. Moser. 2008. Behavioural effects of nonfinancial performance measures: the role of procedural fairness. Behavioral Research in Accounting 20 (2): 55 - 71.
Lau, C. M., and M. Sholihin. 2005. Financial and nonfinancial performance measures: How do they affect job satisfaction? The British Accounting Review 37 (4): 389-413.
Lau, C. M., K. M. Wong, and I. R. C. Eggleton. 2008. Fairness of performance evaluation procedures and job satisfaction: The role of outcome-based and non-outcome-based effects. Accounting and
Business Research 38 (2): 121-135.
Leung, K. 2005. How generalizable are justice effects across culture? In Greenberg, J., and J. A. Colquitt (eds.) Handbook of organizational justice. New Jersey: Lawrence Erlbaum Associates.
Lewis, J. D., and A. Weigert. 1985. Trust as a social reliaty. Social Force (63): 967-985.
Libby, T. 2001. Referent cognitions and budgetary fairness: A research note. Journal of Management Account-ing Research 13: 91-106.
Lind, E. A., and T. R. Tyler. 1988. The Social Psychology of Procedural Justice. New York: Plenum Press. Lindsay, R. M., and S. C. Ehrenberg. 1993. The design of replicated study. The American Statistician 47 (3):
217-228.
Lipe, M. G., and S. E. Salterio. 2000. The balanced scorecard: Judgmental effects of common and unique performance measures. The Accounting Review 75 (3): 283-298.
Lippit, G. L. 1982. Organizational Renewal: A Holistic Approach to Organizational Renewal. Englewood Cliffs, NJ: Prentice Hall.
Little, H. T., N. Magner, R. B. Welker. 2002. The fairness of formal budgetary procedures and their enactment. Group & Organization Management 27 (2): 209-225.
Lynch, R. L., and K. F. Cross. 1991. Measure Up. London, U.K.: Blackwell Publishers.
Mahoney, T. A., T. H. Jerdee, and S. J. Carrol. 1963. Development of Managerial Performance: A Research Approach. Cincinnati: South Western Publishing.
Mayer, R. C., J. H. Davis, and F. D. Schoorman. 1995. An integrative model of organizational trust. The Academy of Management Review 20 (3): 709-734.
McAllister, D. J. 1995. Affect- and cognition-based trust as foundations for interpersonal cooperation in organizations. Academy of Management Journal 38 (1): 24 –58.
McFarlin, D. B., and P. D. Sweeney. 1992. Distributive and procedural justice as predictors of satisfaction with personal and organizational outcomes. Academy of Management Journal 35 (3): 626-637. Merchant, K. A. 2006. Measuring general managers’ performances: Market, accounting and
combina-tion-of-measures systems. Accounting, Auditing & Accountability Journal 19 (6): 893 - 917.
Meyer, J. P., N. J. Allen, and I. R. Gellatly. 1990. Affective and continuance commitment to the organiza-tion: Evaluation of measures and analysis of concurrent and time-lagged relations. Journal of
Ap-plied Psychology 75 (6): 710 - 720.
Noeverman, J., B. A. S. Koene, and R. Williams. 2005. Construct measurement of evaluative style: A review and proposal. Qualitative Research in Accounting & Management 2(1): 77-107.
Nouri, H., and R. J. Parker. 1996. The effect of organizational commitment on the relation between budgetary participation and budgetary slack. Behavioral Research in Accounting 8.
Nouri, H., and R. J. Parker. 1998. The relationship between budget participation and job performance: The roles of budget adequacy and organizational commitment. Accounting, Organizations and Society 23 (5-6): 467-483.
Otley, D. T. 1978. Budget use and managerial performance. Journal of Accounting Research 16 (1): 122-149. Porter, L. W., and E. E. Lawler. 1968. Managerial Attitudes and Performance. Illinois: Richard D. Irwin. Porter, L. W., R. M. Steers, R. T. Mowday, and P. V. Boulian. 1974. Organizational commitment, job
satisfaction, and turnover among psychiatric technicians. Journal of Applied Psychology 59 (5): 603-609. Randall, D. M. 1990. The consequences of organizational commitment: Methodological investigation.
Journal of Organizational Behavior 11 (5): 361-378.
Read, W. H. 1962. Upward communication industrial hierarchies. Human Relations 15: 3-15.
Reina, D. S., and M. J. Reina. 1999. Trust and Betrayal in the Workplace: Building Effective Relationships in Your Organization. San Francisco: Berrett-Koehler Publishers, Inc.
Ross, A. 1994. Trust as a moderator of the effect of performance evaluation style on job-related tension: A research note. Accounting, Organizations and Society 19 (7): 629-635.
Sholihin, M., and R. Pike. 2009. Fairness in performance evaluation and its behavioral consequences.
Accounting and Business Research 39(7): 1-17.
Sholihin, M., A. Na’im, and C. M. Lau. 2004. The effects of multiple measures-based performance evaluation on managers’ performance: The role of procedural fairness and interpersonal trust. In Epstein, M. J., and J-F. Manzoni (eds.), Studies in Managerial and Financial Accounting 14. Elsevier. Supriyadi. 2010. The moderating effect of procedural justice on the effectiveness of the Balanced Scorecard
in improving managerial performance trough organizational commitment. Gadjah Mada Interna-tional Journal of Business 12 (3): 415-434.
Thibaut, J. and J. Walker. 1975. Procedural Justice: A Psychological Analysis. New York: John Wiley.
Vroom, V. H. 1964. Work and Motivation. New York: John Wiley & Sons, Inc.
Wentzel, K. 2002. The influence of fairness perceptions and goal commitment on managers’ perfor-mance in a budget setting. Behavioral Research in Accounting 14: 247-271.
Whitener, E. M., S. E. Brodt, M. A. Korsgaard, and J. M. Werner. 1998) Managers as initiators of trust: An exchange relationship framework for understanding managerial trustworthy behavior. The Academy of Management Review 23 (3): 513-530.
Wold, H. 1985. Partial Least Squares. In Kotz, S., and N. L. Johnson (eds). Encyclopedia of Statistical Sciences 8: 587-599. New York: Wiley.
Wold, S., P. Geladi, K. Esbensen, and J. Öhman. 1987. Multiway principal components and PLS analysis.
Journal of Chemometrics 1(1): 41-56.