Gadjah Mada International Journal of Business May-August 2009, Vol. 11, No. 2, pp. 229–252
INTEGRATION OF STOCK MARKETS
BETWEEN INDONESIA AND ITS MAJOR
TRADING PARTNERS
Bakri Abdul Karim
Faculty of Economics and Business, Universiti Malaysia Sarawak, MalaysiaM. Shabri Abd. Majid
Kulliyah of Economics and Management Sciences, Interantional Islamic University of Malaysia (IIUM), Malaysia
Samsul Ariffin Abdul Karim
Universiti Teknologi Petronas, MalaysiaUsing Autoregressive Distributed Lag (ARDL) and Vector Autoregressive (VAR) frameworks, this study examines the integra-tion between the emerging stock market of Indonesia and its major trading partners (i.e., Japan, the U.S., Singapore, and China). During the period of July 1998 to December 2007, the Indonesian stock market is found to be integrated with its major trading partners. Thus, this implies that there is a limited room available for investors to gain risk-reduction benefits through diversifying their portfolio in those markets. Meanwhile, in the short run, the Indone-sian market responds more to shocks in the U.S. and Singapore than in Japan and China. In designing policies pertaining to its stock market, the Indonesian government should take into account any development in the stock markets of its major trading partners, particularly the U.S. and Singaporean markets.
Introduction
The subject of dynamic interde-pendence amongst stock markets has become an important topic of growing interest recently. The interest in stock market integration arises primarily because financial theory suggests that an integrated regional stock market is more efficient than segmented national capital markets. With an integrated regional stock market, investors from all member countries will be able to allocate capital to the locations in the region where it is the most productive (Click and Plummer 2005). In addi-tion, the degree of stock market inte-gration has major implications on po-tential benefits of international portfo-lio diversification and on financial sta-bility of a country (Ibrahim 2005). Stock market integration tends to cre-ate a long-run equilibrium relation-ship, which ties price movements in national stock indices and could con-siderably reduce benefits from inter-national portfolio diversification. Thus, information on international stock market linkages is relevant not only to portfolio managers, but also to inter-national economic and financial policymakers.
The widening of economic inter-dependence in Asia has been paral-leled by a deepening of interdepen-dence through rising intra-regional trade and investment. Until the mid-1980s, trade in Asia was dominated by exports across the Pacific. With Asia growing much faster than the U.S., and trade friction between the two sides of
the Pacific escalating, intra-regional trade amongst Asian countries has in-creased sharply while the relative im-portance of the U.S. as an export mar-ket for these countries has declined (Kwan 2001). Intra-regional trade ex-pansion is one of the efficient ways of integrating to the much larger interna-tional economy as the countries be-come more competitive (Chowdhury 2005). In addition, Kearney and Lucey (2004) note that the world’s economic and financial systems are becoming increasingly integrated due to the rapid expansion of international trade in commodities, services, and financial assets.
As globalisation and regionalism gained its momentum from the begin-ning of 1980s and the gain from open trade was realised by the pioneer East Asian, especially the Association of Southeast Asian Nations (ASEAN), other Asian countries also tried to move toward intra-regional economic coop-eration. Cooperation amongst the neighbours not only strengthens the economic and financial integration, but also enhances greater political sta-bility and social cooperation between member nations (Chowdhury 2005). Thus, trade linkages across ASEAN members have been seen as one of contributors to enhancing financial integration in the region.
the stock market integration (e.g., Grubel 1968; Levy and Sarnat 1970; Solnik 1974) find lower correlations amongst national stock markets, thereby suggesting potential benefits of international portfolio diversifica-tion. Goldstein and Michael (1993) document increasing international stock market linkages over the past decade, especially for the stocks traded actively in the major financial centres. The impacts of the October 1987 stock market crash and the 1997 Asian fi-nancial crisis on stock market integra-tion have also drawn much attenintegra-tion amongst economists and practitioners (for instance, Arshanapalli et al. 1995; Francis et al. 2002; and Yang et al. 2003). They note that the stock mar-kets have become more cointegrated after the crisis.
The vast growing economic ac-tivities and the increasing investment opportunities in some Asian emerging markets in recent years have attracted investors’ and researchers’ attention. Examples of these recent studies in-clude Cheung and Mak (1992), Hung and Cheung (1995), Palac-McMiken (1997), Roca et al. (1998), Janakiramanan and Lamba (1998), Masih and Masih (1999), Azman-Saini et al. (2002), Ng (2002), Ibrahim (2005), and Majid et al. (2008). It is well documented that the U.S. market is the most dominant in influencing variations in other developed and emerging equity markets. The U.S. market is a ‘global factor’ which leads most of the Asian emerging markets (Cheung and Mak 1992). Consistent
with Arshanapalli et al. (1995), Ibrahim (2005) provides evidence that the ASEAN markets respond quickly to shocks in the U.S. regardless of the sample period but seem to be less influenced by the Japanese market. However, Yang et al. (2003) find that more Asian markets, including Indo-nesia, significantly respond to innova-tions in the Japanese market.
Using monthly data from January 1987 to October 1995 and cointegration approach, Palac-McMiken (1997) finds that, with the exception of Indo-nesia, all other ASEAN markets are linked to each other. In contrast, Roca et al. (1998) find no evidence of cointegration amongst them. However, with the exception of Indonesia, these markets have significant short-run link-ages. Janakiramanan and Lamba (1998) also find that the Indonesian market is a relatively isolated market. Using Granger non-causality test and weekly data from January 1988 to August 1999, Azman-Saini et al. (2002) find the dominance of the Singaporean market in the region. With the excep-tion of Malaysia, the Indonesian ket is affected by other ASEAN mar-kets but does not significantly influ-ence the other markets. On the other hand, Click and Plummer (2005) docu-ment that the ASEAN-5 markets in-cluding Indonesia are integrated in the economics sense, but that integration is far from complete.
vector autoregression (VAR). He finds evidence for the lack of cointegration between the Indonesian markets with other ASEAN members and with the most advanced markets (the U.S. and Japan) during both periods. In addi-tion, the Indonesian markets become more segmented from other ASEAN markets but more responsive to the developed markets (the U.S. and Ja-pan) during the post-crisis period. Thus, past studies have documented a par-ticularly interesting finding that the Indonesian market seems to be gener-ally segmented from the advanced markets and other ASEAN markets, both in short and long runs. However, these markets are going toward a greater integration, either amongst themselves or with the U.S. and Japan, especially in the post-1997 financial crisis (Ng 2002; Majid et al. 2008).
McCauley et al. (2002) examined the East Asia’s bond and loan markets integration for the period of 1999-2002. They find that both markets be-come more integrated. In contrast, in their recent study, Yu et al. (2007) find weak bond market integration in the region during 1997 to 2003 period. They note that the lack of progress might be due to the “local” or “idio-syncratic” factors in some Asian econo-mies. Plummer and Click (2005) argue that the deepening of local bond mar-kets could strengthen the financial in-tegration. As for the exchange rate integration, Aggarwal and Mougoue (1996) document that Asian curren-cies are cointegrated with the influ-ence of the Japanese Yen increasing
relative to the U.S. dollar in recent years. Since 1980, economic integra-tion amongst Japan’s neighbours has been intensified and their business cycles have been highly synchronised. These cycles have been closely linked to fluctuations in the Yen/Dollar ex-change rate - through ex-changes in the export competitiveness, inflows of foreign direct investment, and intra-Asian income effects (McKinnon and Schnabl 2003).
The interest in a Yen bloc in Asia has been on the rise because of a deep-ening economic interdependence be-tween Japan and its neighbours. The onset of the Asian currency crisis, the introduction of the Euro in Europe, and the implementation of Japan’s fi-nancial reform program have contrib-uted to ongoing discussions on the possibility amongst policymakers in those countries (Kwan 2001). With Yen bloc, Japan would become the centre of gravity of the Asian Pacific economy. As the region becomes in-creasingly integrated, more business activity goes into the gravitational pull of Japan and its corporations. Trade and investment within the region would continue to grow faster than the rest of the world.
China (henceforth China). In addition, Roll (1995) affirms that although In-donesia has had an active equity mar-ket for a number of years, very few empirical studies on this market have appeared in Western scholarly jour-nals. Some other studies included In-donesia in their sample as part of broader studies of stock market
inte-gration in Asia Pacific markets (e.g., Janakiraman and Lamba 1998; Masih and Masih 1999; Ng 2002; Daly 2003; Yang et al. 2003; Majid et al. 2008). Thus, this study tries to fill the gap on existing research by examining the integration between the Indonesian market and its major trading partners.
Table 1. International Trade between Indonesia and Its Major Trading Partners, 2000-2007
Year JPN US SING CHN Subtotal
Panel A: % Share of exports to countries out of total exports
2000 23.21 13.67 10.56 4.46 51.89 2001 23.10 13.78 9.52 3.91 50.31 2002 21.07 13.24 9.36 5.08 48.76 2003 22.30 12.11 8.85 6.23 49.49 2004 22.31 12.28 8.39 6.44 49.41 2005 21.08 11.55 9.15 7.78 49.56 2006 19.39 11.48 11.82 7.70 50.39 2007 18.56 10.93 10.54 8.76 48.79 Average 21.38 12.38 9.77 6.29 49.83 Average export growth 7.83 7.99 13.52 23.73 10.63
Average growth total 11.40
Panel B: % Share of imports from countries out of total imports
2000 16.10 10.12 11.31 6.03 43.57 2001 15.14 10.37 10.16 5.95 41.63 2002 14.09 8.45 13.10 7.76 43.40 2003 12.99 8.30 12.77 9.08 43.14 2004 13.07 6.96 13.07 8.81 41.92 2005 11.97 6.73 16.41 10.13 45.24 2006 8.76 3.66 29.59 11.24 53.25 2007 8.58 4.08 28.38 12.23 53.27 Average 12.59 7.33 16.85 8.90 45.68 Average import growth 10.34 6.25 46.33 34.02 26.00
Average growth total 21.17
It is the fact that Indonesia is a growing and relatively open economy with trade and foreign direct invest-ment play significant role in driving its economy. The opening of the equity markets in Indonesia and other Asian emerging markets during the 1980s has resulted in a rising interest in in-vesting in these markets. This is evi-denced by the creation of huge various investment funds that focus on this region by international fund manage-ment houses (Hung and Cheung 1995). We consider whether the Indonesian stock market is integrated with the stock markets of Japan, the U.S., Singapore, and China because of the importance of these economies to In-donesia as trading partners and in terms of investment flows. Taylor and Tonks (1989) and Chen and Zhang (1997) note that a stronger financial integra-tion would be expected amongst coun-tries that reduce trade barriers and develop stronger economic ties. The stronger the bilateral trade ties be-tween two countries, the higher of co-movements (Masih and Masih 1999; Bracker et al. 1999). Shares of exports and imports from Indonesia to these four countries are relatively high. Table 1 shows the total volume of exports and imports were about 48.79 percent (USD61.704 billion) and 53.27 per-cent (USD60.831 billion), respectively, in the end of 2007.
The purpose of this paper is to examine the stock market integration and short-run dynamic interactions between the Indonesian stock market and the stock markets of its major
The rest of the paper is organized as follows. Section 2 describes the empirical framework, and provides the description of the data. Section 3 of-fers empirical results and discussion. Finally, Section 4 presents concluding remarks.
Empirical Framework and
Data Preliminaries
We use ARDL bounds testing approach and Vector Autoregressive (VAR) framework to examine the stock market integration and short-run dy-namic interactions between Indonesia and its major trading partners. We use ARDL to test the stock market integra-tion while VAR provides short-run dynamic interactions amongst these markets.
ARDL Model
The study employs the ARDL bounds testing approach to investigate the cointegration relationship amongst the Indonesian stock market and the stock markets of its major trading part-ners. The bounds testing procedure does not require the pre-testing of the variables included in the model for unit roots unlike other techniques such as the Johansen and Juselius’ (1990) approach. It also allows for inference on long-run estimates, which are not possible under alternative cointegra-tion procedure. Addicointegra-tionally, another advantage of the ARDL is the ARDL model takes sufficient number of lags to capture the data-generating process
in a general-to-specific modelling framework. It estimates (p +1)k
relating to the five stock markets in-corporated in our study is stated as follows:
where ∆ is the difference operator;
INA, JPN, US, SING and CHN refer to Indonesia, Japan, the U.S., Singapore, and China, respectively; ε is white
noise error term. The following are steps to test the cointegration relation-ship amongst the stock market of Indo-nesia and Japan, the U.S., Singapore, and China. Firstly, we estimate Equa-tion (1) by OLS technique. Pesaran et al. (2001) note that the model above is based on an assumption that the error term is serially uncorrelated. There-fore, it is important that the lag order p
of the underlying model is chosen ap-propriately. The order of the distrib-uted lag on the dependent variable and the regressors is selected using either Akaike Information Criterion (AIC) or the Schwartz Bayesian Criterion (SBC). SBC selects the smallest pos-sible lag length while AIC selects the maximum relevant lag length. Since we use weekly data, we use appropri-ate lag length based on Akaike
Infor-mation Criterion (AIC) (Akaike 1974) with no serial correlation in the model.
Secondly, the presence of cointegration is traced by restricting all estimated coefficients of lagged level variables equal to zero. That is, the null hypothesis H0: δ
1= δ2= δ3= δ4= δ
5= 0 against the alternative,
hypoth-esis Ha: δ
1≠ δ2≠ δ3≠ δ4≠ δ5≠ 0 . These
hypotheses can be examined using the critical values bounds as tabulated in Pesaran et al. (2001). The relevant critical value bounds are based on case III with unrestricted intercepts and no trend, and the number of regressors, k, are four. If the computed F-statistic is less than lower bound critical value, then we do not reject the null hypoth-esis of no integration. However, if the computed F-statistics is greater than upper bound critical value, then we reject the null hypothesis and con-clude that there exists steady state equi-librium between the variables under study. However, if the computed value falls within lower and upper bound critical values, then the result is incon-clusive.
VAR Framework
In order to assess short-run dy-namic interactions amongst the share prices, we use VAR model of variance decomposition and impulse response function. Traditionally, VAR model as suggested by Sims (1980) relies on a Choleski’s factorization to orthogo-nalize VAR innovations so that they are uncorrelated contemporaneously. Variance decomposition measures the
percentage of a market’s forecast error variance that occurs as a result of a shock from a market in the system. Meanwhile, an impulse response func-tion (IRF) traces the response of one market to a change in one of the market’s innovations. This IRF en-ables us to characterize the dynamic integration amongst markets, and ob-serve the speed of adjustment of mar-kets in the system. Unfortunately, in-novation accounting results based on the Choleski’s factorization are sensi-tive to the ordering of variables when the residual covariance matrix is non-diagonal (Yang et al. 2003). Thus, in order to overcome the drawback, in-stead of using IRF, we employ gener-alized impulse response analysis as developed by Pesaran and Shin (1998), which is invariant to the ordering of the variables in the VAR model. This feature of the generalized impulse re-sponses is particularly useful for stud-ies on equity markets, which are gen-erally characterized by quick price transmissions and adjustments (Ewing et al. 2003). A convenient feature of the VAR representation is that it can be estimated by OLS, which yields consistent, asymptotically efficient estimates and allows us to examine whether more complex transmission mechanism are involved (Hutson et al. 2008).
However, using VAR in level may be spurious and misleading if log level variables are non-stationary. Trans-forming the variables into first differ-ences to render the variables station-ary before running VAR, however,
introduces misspecification problem in the case that the variables under consideration are cointegrated (Ibrahim 2005). For proper specifica-tion of the VAR model so as to avoid spurious regression, cointegration test outlined in the previous step is neces-sary. In particular, the findings that the variables are non-stationary and are not cointegrated suggest the use of VAR model in first differences. How-ever, if they are cointegrated, a vector error correction model or a level VAR can be used (Engle and Granger 1987). MacDonald and Kearney (1987) also suggest that if the variables appear to be cointegrated, VAR in level (with no cointegration restrictions) rather than VAR in differenced form are applied. In addition, Monte Carlo evidence seems to confirm the claimed superi-ority of testing based on VAR in level (Mosconi and Giannini 1992). Thus, in our case, anticipating cointegration amongst share prices, we use the VAR with variables in level for the analysis.
Data Preliminaries
a weekly interval of the indices is used (Hung and Cheung 1995, p. 282). The following indices are used to represent the markets: Jakarta Composite Index (JCI) for Indonesia, Standard and Poor’s 500 (S&P 500) Index for the U.S., Tokyo Price Index (TOPIX) for Japan, Singapore Straight Time Index (SSTI) for Singapore, and Shenzhen Stock Exchange Composite Index (SSE-CI) for China. All indices are based on local currency and are col-lected from the Bloomberg Database. Ding et al. (1999) note that there is nothing in the cointegration method-ology that requires the series be in the same currency. All series are trans-formed into natural logarithm.
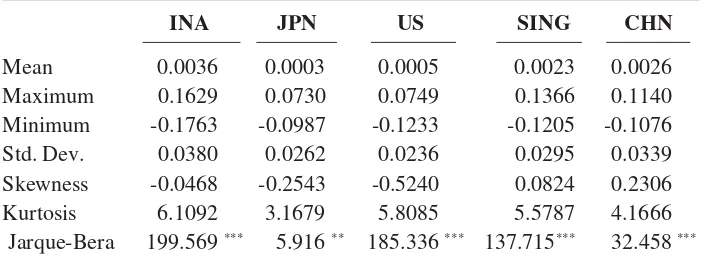
Table 2 presents the descriptive statistics of the data, including sample means, maximums, minimums, stan-dard deviations, skewness, kurtosis, as well as the Jarque-Bera statistics and p-values. The highest mean return is 0.36 percent in Indonesia while the lowest is 0.03 percent in Japan. The standard deviations range from 2.36 percent in the U.S. (the least volatile) to 3.80 percent in Indonesia (the most volatile). All weekly market returns, have excess kurtosis (greater than 3), which means that they have a thicker tail and a higher peak than a normal distribution. The Jarque-Bera statis-tics and p-values indicate the rejection of normality on these five markets’
Table 3. Correlation of the Market Returns
INA JPN US SING CHN
INA 1.0000
JPN 0.2832 1.0000
US 0.1858 0.3958 1.0000
SING 0.4254 0.4649 0.4538 1.0000
CHN 0.1018 0.0845 0.0160 0.1152 1.0000 Table 2. Summary Statistics of the Market Returns
INA JPN US SING CHN
Mean 0.0036 0.0003 0.0005 0.0023 0.0026 Maximum 0.1629 0.0730 0.0749 0.1366 0.1140 Minimum -0.1763 -0.0987 -0.1233 -0.1205 -0.1076 Std. Dev. 0.0380 0.0262 0.0236 0.0295 0.0339 Skewness -0.0468 -0.2543 -0.5240 0.0824 0.2306 Kurtosis 6.1092 3.1679 5.8085 5.5787 4.1666 Jarque-Bera 199.569*** 5.916** 185.336*** 137.715*** 32.458***
weekly return data set. The findings from the preliminary analysis for the Indonesian stock market are in line with the studies of Palac-McMiken (1997), Ibrahim (2005), and Majid et al. (2008).
Table 3 provides the correlation matrix amongst weekly market returns. The correlations amongst various stock markets returns are positively and gen-erally significantly different from zero. Only the relatively isolated market of China exhibits low and statistically insignificant correlations with the most other markets. We also note that the correlation of Indonesia-Singapore is higher than other Indonesia’s trading partners. This might be due to geo-graphic proximity and close relation-ship between the two stock markets.
Empirical Results
ARDL Results
Before estimating the short- and long-run relationships amongst the variables, we have to decide the lag-length on the first difference variables. Pesaran and Shin (1998) note that ARDL model requires a priori knowl-edge of the orders of the extended ARDL that is sufficient to simulta-neously correct for residual serial cor-relation and the problem of endog-enous regressors. In this study, the order of the distributed lag on the de-pendent variable and the regressors is selected using AIC with no serial cor-relation in the model. Based on AIC, the optimal lag-length is found to be three.
Turning to the result of the bound tests for cointegration, the computed F-statistic for examining the existence of a long-run relationship amongst In-donesia, Japan, the U.S., Singapore, and China is 3.63. The relevant critical value bounds are obtained from Pesaran et al. (2001), where the critical values in the case of four regressors are 2.86– 4.01 at the 5 percent significance level, and 2.45–3.52 at the 10 percent sig-nificance level.The results indicate that the null hypothesis of no cointegration can be rejected at 10 percent significance level (the F-sta-tistics exceed the upper bound critical values). Thus, we find evidence the existence of long-run relationship amongst Indonesia, Japan, the U.S., Singapore, and China.
the markets are competing with each other while the positive coefficients imply that the markets are comple-mentary in nature. Thus, the results
suggest that the Singaporean and the Indonesian stock markets are comple-mentary in nature rather than compet-ing.
Table 4. Estimated Long-run Coefficients using the ARDL (1, 1, 3, 1, 3) Model
Regressor Coefficient t-statistics
JPN -1.5708 -1.3089
US -0.8548 -0.5991
SING 3.8578*** 5.1676
CHN -0.2466 -0.9543
Constant -3.7465 -0.8113
Note:*** indicates significance at the 1 percent level.
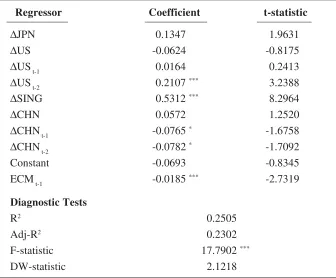
Table 5. Error Correction Representation of ARDL (1,1,3,1,3) Model
Regressor Coefficient t-statistic
∆JPN 0.1347 1.9631
∆US -0.0624 -0.8175
∆US
t-1 0.0164 0.2413
∆US
t-2 0.2107
*** 3.2388
∆SING 0.5312*** 8.2964
∆CHN 0.0572 1.2520
∆CHN
t-1 -0.0765
* -1.6758
∆CHN
t-2 -0.0782
* -1.7092
Constant -0.0693 -0.8345
ECM t-1 -0.0185*** -2.7319
Diagnostic Tests
R2 0.2505
Adj-R2 0.2302
F-statistic 17.7902***
DW-statistic 2.1218
Table 5 shows that the coefficient of the ECM is negative and highly significant at 1 percent level. This con-firms the existence of a stable long-run relationship and indicates to a long-run cointegration relationship amongst variables. The ECM corresponds to the speed of adjustment to restore equi-librium in the dynamic model follow-ing disturbances. The coefficient of the ECM is -0.0185, implying that a deviation from the long-run equilib-rium following short-run disturbances is corrected by about 1.85 percent after one week.
The performance of our estimated error correction representation for ARDL seems to be acceptable. Al-though the Adjusted R2 value is
rela-tively low, it is still acceptable since the estimate is based on the first-dif-ference values. The diagnostic tests perform well, supporting the overall validity of the short-run model.
VAR Results
Given the existence of cointe-gration, a vector error correction model or a level VAR can be used (Engle and Granger 1987). Since cointegration amongst share prices are found, we use the VAR with variables in level for the analysis. As aforementioned, us-ing Choleski’s decomposition, the re-sults of variance decomposition and impulse response function may be sen-sitive to the ordering of the variables. Thus, in addition to variance decom-position, we also employ generalized impulse response analysis as
devel-oped by Pesaran and Shin (1998), which is invariant to the ordering of the variables in the VAR model. Firstly, we present the results of variance de-composition. Secondly, we provide the generalized impulse response function in order to assess short-run dynamic interaction amongst the Indonesian stock market and the stock market of its major trading partners.
The orderings that we choose to generate variance decompositions are: the U.S., Japan, Singapore, China, and Indonesia. Table 6 shows the VDCs (up to 10 weeks) for Indonesia. Sev-eral conclusions can be obtained from the VDC results as shown in Table 6.
Firstly, we find that the Indonesia’s forecast error variance is accounted for mostly by its own innovations.
Table 6. Variance Decomposition of INA
Period INA JPN US SING CHN
1 79.737 4.429 4.397 11.188 0.2459 2 74.280 4.717 7.469 13.401 0.130 3 69.578 4.095 12.320 13.816 0.188 4 61.765 3.460 17.352 17.216 0.204 8 52.489 1.963 23.891 21.470 0.185
10 50.650 1.614 24.956 22.582 0.196
Figure 1. Responses of Indonesia to Shocks in Its Major Trading Partners
Response to Generalized One S.D. Innovations ± 2 S.E.
-.01 00 .02
.01 .03 .04 .05 .06
1 2 3 4 5 6 7 8 9 10
Response of INA to INA
-.01 00 .02
.01 .03 .04 .05 .06
1 2 3 4 5 6 7 8 9 10
Continued from Figure 1
-.01 00 .02
.01 .03 .04 .05 .06
1 2 3 4 5 6 7 8 9 10
Response of INA to CHN -.01
00 .02
.01 .03 .04 .05 .06
1 2 3 4 5 6 7 8 9 10
Response of INA to SING -.01
00 .02
.01 .03 .04 .05 .06
1 2 3 4 5 6 7 8 9 10
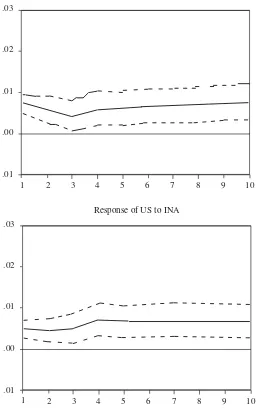
Figure 2. Responses of Major Trading Partners to Shock in Indonesia
Response to Generalized One S.D. Innovations ± 2 S.E.
Response of JPN to INA
.01 .01
.00 .02 .03
1 2 3 4 5 6 7 8 9 10
Response of US to INA
.01 .01
.00 .02 .03
Continued from Figure 2
Response of SING to INA
.01 .01
.00 .02 .03
1 2 3 4 5 6 7 8 9 10
.04
Response of CHN to INA
.01 .01
.00 .02 .03
In order to provide the dynamic response of the Indonesian stock mar-ket to innovations in its major trading partners included in the system, we adopt generalized impulse response functions developed by Pesaran and Shin (1998). The approach is shown to be invariant to the ordering of vari-ables and useful for studies on equity markets, which are generally charac-terized by quick price transmission and adjustments (Ewing et al. 2003). In addition, it also allows us to exam-ine whether more complex transmis-sion mechanisms are involved (Hutson et al. 2008).
Figure 1 provides the responses of the Indonesian stock market to shocks in its major trading partners while Figure 2 shows the responses of the major trading partners to Indone-sian stock market shocks. The shocks in the U.S., Singapore, and Japan are rapidly transmitted to the Indonesian stock market. However, the shocks in China do not significantly influence the Indonesian market. Consistent with our earlier VDCs results, a shock to the Singaporean market has a larger im-pact on the Indonesian stock market.
At the regional level, the short-run interdependency between Indone-sia and Singapore is clearly identified. This finding is in line with those of Masih and Masih (1997) and Majid et al. (2008). We should note that Indo-nesia and Singapore are the members of ASEAN, which aims to remove trade barriers amongst its member countries. Taylor and Tonks (1989) note that a stronger financial
remarkable rising proportion of bilat-eral trade amongst the countries in the region from pre- to post-crisis period. Finally, we also note that the Chi-nese stock market is the most indepen-dent and isolated from other markets. The result is consistent with Huang et al. (2000), Lin and Swanson (2008), and with the evidence of our earlier finding of low correlation between China and other markets. Although there have been major reform policies initiated by China such as the imple-mentation of People’s Republic of China (PRC) Securities Law (July 1, 1999), the removal of trading restric-tions by allowing domestic residents to trade B-share stocks (February 20, 2001), and the opening to Qualified Foreign Institutional Investors (De-cember 1, 2002), but they are still ineffective such that its segmented market continues to provide foreign investors with the benefits of interna-tional diversification (Lin and Swanson 2008).
Conclusion and Policy
Implications
This paper examines the stock market integration amongst Indonesia and its major trading partners (i.e., Japan, the U.S., Singapore, and China). This study employs the ARDL ap-proach to cointegration and VAR framework and recent weekly data from July 1998 to December 2007. From the empirical findings, we find evidence that there exists a long-run equilib-rium relationship amongst the stock
markets. Unlike prior studies, we find that Indonesia is integrated with the advanced and other Asian markets. Since the examined stock markets are cointegrated, there exists a long-run equilibrium relationship amongst them. In addition, the results suggest that the Singaporean and the Indonesian stock markets are complementary in nature rather than competing. From the VAR results, the variations on the Indone-sian market respond more to shocks in both the U.S. and Singaporean mar-kets than in the Japanese and Chinese markets. The performance of our esti-mated error correction representation for ARDL seems to be acceptable. The diagnostic tests perform well, support-ing the overall validity of the short-run model.
For the purpose of policy making, any development in its major trading partners, particularly the U.S. and Singapore, should be taken into con-sideration by the Indonesian authori-ties to design policies pertaining to its stock market. Therefore, the findings of cointegration amongst Indonesia and its major trading partners (i.e., Japan, the U.S., Singapore, and China) imply a need for policy coordination to miti-gate the impacts of financial fluctua-tions. In addition, in order to take ad-vantage of financial integration and interdependence, greater liberalization including reduction or removal of trade and investment barriers will be neces-sary. To move towards a greater finan-cial integration amongst the markets, trade liberalisation and agreements have important and far-reaching im-plications in the region. Economic cooperation in the neighbourhood not only strengthens the economic and fi-nancial integration, but also enhances greater political stability and social cooperation amongst member nations (Chowdhury 2005).
Similarly, the extent of integra-tion amongst the markets will have an
important bearing on the formulation of financial policies of multinational corporations. Therefore, knowing the co-movement amongst the stock mar-kets would give an idea of exchange rate risk between countries. Such knowledge can, therefore, help man-agers mitigate international risks and manage economic, transaction, and translation risks.
To further add to the existing lit-erature on market integration in the Asian region, further empirical stud-ies on the issue can cover broader areas of market integration and ex-plore other potential factors account-ing for market integration. A further possible extension of the study is to quantify and compare the diversifica-tion benefits investors can gain when diversifying their investments across the Asian markets. Since cointegrated tests are only able to detect linear long-run equilibrium relationships but fail to detect non-linear cointegration (Okunev and Wilson 1997), a more advanced test is needed to discover the existence of non-linear cointegration amongst the Asian markets.
References
Aggarwal, R., and M. Mougoue. 1996. Cointegration amongst Asian currencies: Evidence of the increasing influence of the Japanese Yen. Japan and the World Economy 8 (3): 291-308.
Akaike, H. 1974. A new look at the statistics model identification. IEEE Transactions on Atomic Control AC 19: 716-723.
Asian Development Bank. 2008. www.adb.org.
Atkins, F. J., and P. J. Coe. 2002. An ARDL bounds test of the long-run Fisher effect in the United States and Canada. Journal of Macroeconomics 24: 255–266.
Azman-Saini, W.N.W., M. Azali, M. S. Habibullah, and K. G. Matthews. 2002. Financial integration and the ASEAN-5 equity markets. Applied Economics 34: 2283-2288. Blackman, S. C., K. Holden, and W. A. Thomas. 1994. Long-term relationships between
international share prices. Applied Financial Economics 4: 297-304.
Bracker, K., D. S. Dockling, P. D. Koch. 1999. Economy determinants of evolution in international stock market integration. Journal of Empirical Finance 6: 1-27. Chen, N. F., and F. Zhang. 1997. Correlation, trades and stock returns of the Pacific-Basin
markets. Pacific-Basin Finance Journal 5: 559-557.
Cheung, Y. L., and S. C. Mak. 1992. A study of the international transmission of stock market fluctuation between the developed markets and the Asian-Pacific markets. Applied Financial Economics 2: 1-5.
Chowdhury, A. R. 1994. Stock market interdependencies: Evidence from the Asian NIEs. Journal of Macroeconomics 16: 629-651.
Chowdhury, M. B. 2005. Trade reforms and economic integration in South Asia; SAARC to SAPTA. Applied Econometrics and International Development 5 (4): 23-40. Click, R. W., and M. G. Plummer. 2005. Stock market integration in ASEAN after the
Asian financial crisis. Journal of Asian Economics 16: 5-28.
Daly, K. J. 2003. Southeast Asian stock market linkages: Evidence from pre- and post-October 1987. ASEAN Economic Bulletin 20: 73-85.
Dekker, A., K. Sen, and M. Young. 2001. Equity market in the Asia Pacific region: A comparison of the orthogonalized and generalized VAR approaches. Global Finance Journal 12: 1–33.
Ding, D. K., H. B. H. Frederick, T. L. Sie, and H. M. Thomas. 1999. An investigation of price discovery in informationally-linked markets: Equity trading in Malaysia and Singapore. Journal of Multinational Financial Management 9 (3-4): 317-329. Engle, R. F., and C. W. J. Granger. 1987. Cointegration and error correction:
Represen-tation, estimation, and testing. Econometrica 55: 251-276.
Ewing, B. T., S. M. Forbes, and J. E. Payne. 2003. The effects of macroeconomic shocks on sector-specific returns. Applied Economics 35: 201-207.
Fosu, E. and F. J. Magnus. 2006. Bounds testing approach to cointegration: An examina-tion of foreign direct investment trade and growth relaexamina-tionships. American Journal of Applied Sciences 3: 2079-2085.
Francis, I., S. Kim, and J. H. Yoon. 2002. International stock market linkages: Evidence from the Asian financial crisis. Journal of Emerging Market Finance 1: 1-29. Goldstein, M., and M. Michael. 1993. The integration of world capital markets. IMF
Working Paper (International Monetary Fund). Washington, DC.
Grubel, H. 1968. International diversified portfolio: Welfare gains and capital flows. American Economic Review 58: 1299-1314.
Hassan, M. K., and A. Naka, A. 1996. Short-run and long-run dynamic linkages amongst international stock markets. International Review of Economics and Finance 4: 387-405.
Huang, B., Y. Chin-Wei, and W. H. John. 2000. Causality and cointegration of stock markets amongst the United States, Japan, and the South China Growth Triangle. International Review of Financial Analysis 9 (3): 93-115.
Hung, B. W., and Y. Cheung. 1995. Interdependence of Asian emerging equity markets. Journal of Business Finance and Accounting 22 (2): 281-288.
Hutson, E., C. Kearney, and M. Lynch. 2008. Volume and skewness in international equity markets. Journal of Banking and Finance 32 (7): 1255-1268.
Hwahsin, C., and J. L. Glascock. 2006. Stock market linkages before and after the Asian financial crisis: Evidence from three greater China economic area stock markets and the U.S.. Review of Pacific Basin Financial Markets and Policies 9 (2): 297-315. Ibrahim, M. H. 2003. Macroeconomic forces and capital market integration: A VAR
analysis for Malaysia. Journal of the Asia Pacific Economy 8 (1): 19-40.
Ibrahim, M. H. 2005. International linkages of stock prices: The case of Indonesia. Management Research News 28 (4): 93-115.
Janakiramanan, S., and A. S. Lamba. 1998. An empirical examination of linkages between Pacific-Basin Stock Markets. Journal of International Financial Markets, Institutions and Money 8: 155-173.
Johansen, S. 1988. Statistical analysis of cointegration vectors. Journal of Economics Dynamic and Control 12: 231-254.
Johansen, S., and K. Juselius. 1990. Maximum likelihood estimation and inference on cointegration with applications to the demand for money. Oxford Bulletin of Economics and Statistics 52: 169-210.
Kasa, K. 1992. Common stochastic trends in international stock markets. Journal of Monetary Economics 29: 95-124.
Kearney, C., and B. M. Lucey. 2004. International equity market integration: Theory, evidence and implications. International Review of Financial Analysis 13: 571- 583. Kwan, C. H. 2001. Yen Bloc: Towards Economic Integration in Asia. Washington D.C.:
Brooking Institution Press.
Laurenceson, J., and J. C. H. Chai. 2003. Financial Reform and Economic Development in China. Cheltenham, UK: Edward Elgar.
Levy, H., and M. Sarnat. 1970. International diversification of investment portfolios. American Economic Review 60: 668-675.
MacDonald, R., and C. Kearney. 1987. On the specification of granger-causality tests using cointegration methodology. Economics Letters 25 (2): 149-153.
Majid, M. S. A, A. K. M. Meera, and M. A. Omar. 2008. Interdependence of ASEAN-5 stock markets from the U.S. and Japan. Global Economic Review 37 (2): 201-225. Masih, A. M. M., and R. Masih. 1997. Dynamic linkages and the propagation mechanism driving major international stock markets. Quarterly Review of Economics and Finance 37: 859–85.
Masih, A. M. M., and R. Masih. 1999. Are Asian stock market fluctuations due mainly to intra-regional contagion effects? Evidence based on Asian emerging stock markets. Pacific- Basin Finance Journal 7: 251–82.
McCauley, R. N., S-S. Fung, and B. Gadanecz. 2002. Integrating the finances of East Asia. BIS Quarterly Review: 83-96.
McKinnon, R., and G. Schnabl. 2003. Synchronised business cycles in East Asia and fluctuations in the yen/dollar exchange rate. World Economy 26: 1067-1088. Mosconi, R., and C. Giannini. 1992. Non-causality in cointegrated systems:
Representa-tion estimaRepresenta-tion and testing. Oxford Bulletin of Economics and Statistics 54 (3): 399-417.
Narayan, P., R. Smyth, M. Nandha. 2004. Interdependence and dynamic linkages between the emerging stock markets of South Asia. Journal of Accounting and Finance 44: 419-439.
Ng, T. H. 2002. Stock market linkages in South-East Asia. Asian Economic Journal 16: 353-377.
Okunev, J., and P. J. Wilson. 1997. Using nonlinear test to examine integration between real estate and stock markets. Real Estate Economics 25: 487-503.
Palac-MicMiken, E. D. 1997. An examination of ASEAN stock markets: A cointegration approach. ASEAN Economic Bulletin 13: 299-311.
Pesaran, M. H., Y. Shin. 1995. An autoregressive distributed lag modeling approach to cointegration analysis. DAE Working Paper No. 9514. Department of Applied Economics, University of Cambridge.
Pesaran, M. H., and Y. Shin. 1998. Generalized impulse response analysis in linear multivariate models. Economics Letters 58: 17–29.
Pesaran, M. H., Y. Shin, and R. Smith. 2001. Bounds testing approaches to the analysis of level relationships. Journal of Applied Econometric 16: 289–326.
Plummer, M. G., and R. Click. 2005. Bond market development and integration in ASEAN. International Journal of Finance and Economics 10 (2): 133-142. Pretorius, E. 2002. Economic determinants of emerging stock market interdependence.
Emerging Markets Review 3: 84-105.
Roca, E. D., E. A. Selvanathan, and W. F. Shepherd. 1998. Are the ASEAN equity markets interdependent. ASEAN Economic Bulletin 15: 109– 120.
Sheng, H., and A. H. Tu. 2000. A study of cointegration and variance decomposition amongst national equity indices before and during the period of the Asian financial crisis. Journal of Multinational Financial Management 10: 345-365.
Sims, C. 1980. Comparison of interwar and postwar business cycles: Monetarism reconsidered. American Economic Review: Papers and Proceedings 70: 250–257. Solnik, B. H. 1974. Why not diversify internationally. Financial Analysts Journal 30:
48-54.
Taylor, M. P., and I. Tonks. 1989. The internationalization of stock markets and the abolition of U.K. exchange control. Review of Economics and Statistics 71: 332-336. Yang, J., J. W. Kolari, and I. Min. 2003. Stock market integration and financial crisis: The
case of Asia. Applied Financial Economics 13: 477-486.