Pattern of Nutritional Intake among Obese Undergraduate in Faculty
of Communication Studies Universitas Padjadjaran
Nilavenmalar Perianan,1 Dewi Marhaeni Diah Herawati,2 Yudi Wahyudi3
1Faculty of Medicine Universitas Padjadjaran, 2Department of Medical Nutrition Faculty of
Medicine Universitas Padjadjaran, 3Department of Internal Medicine Faculty of Medicine
Universitas Padjadjaran/Dr. Hasan Sadikin General Hospital Bandung
Abstract
Background: Obesity has become the 5th leading cause of death worldwide in 2010. It is a combination of genetic susceptibility, increased availability of high energy food intake and decreased requirements for physical activity in modern society. The increase in calorie intake among obese people often leads to many chronic diseases. Therefore, the aim of this study was to observe calorie intake pattern among obese undergraduates.
Methods: This study was conducted at Faculty of Communication Studies Universitas Padjadjaran, from September to November 2013. This cross-sectional study used anthropometric measurement based on Asian Body Mass cut-off points, which the screening was conducted on 512 undergraduate students, consisting of 103 undergraduates, overweight (50) and obese (53). From 53 undergraduates, 30 respondents were randomly selected. The respondents were then interviewed using 3x24 hours Food Recall questionnaire, conducted on two weekdays and one weekend to observe their pattern of nutritional intake. Total number of calories was categorized into few groups according to the Recommended Dietary Allowance (RDA) 2012. Results: From the thirty obese undergraduates, both male (11) and female (9) consumed more excess protein in daily life. Consumption of carbohydrate and energy was significantly normal. Common consumption of food as daily basis contained more carbohydrate then protein, fats or energy.
Conclusions: Prevalence of obesity is still high. Frequent meal and high intake of carbohydrates has become factors to nutritional imbalance of obese undergraduates. Types of food most widely consumed are white rice, fried chicken, tofu, tempe (asian food made from fermenting soybeans) and sweetened tea. [AMJ.2016;3(3):487–92]
Keywords: Food pattern, obesity, undergraduate
Correspondence: Nilavenmalar Perianan, Faculty of Medicine, Universitas Padjadjaran, Jalan Raya Bandung-Sumedang Km.21, Jatinangor, Sumedang, Indonesia, Phone: +62 8170209313 Email: [email protected]
Introduction
Obesity has become the 5th leading cause
of death worldwide in 2010. World Health Organization (WHO) stated that there are more than 1 in 10 of the world population who are still obese.1 Based on the report of
Basic Health Research (Riskesdas) 2010, the prevalence of obesity of adults who are more than 18 years old is 11.7 % according to the modified Asian Body Mass cut-off points. Meanwhile, the prevalence of obesity of West Java is 12.8 in 2010 according to the modified Asian Body Mass Index cut-off points.2
Obesity is the global epidemic, it is a combination of the genetic susceptibility, due to high consumption of energy food and less physical activity in current modern society.
It should no longer be regarded as simple cosmetic problem affecting certain individuals but it is an epidemic that threatens global well-being.3 Therefore, this study was conducted
to observe the calorie intake pattern among obese undergraduates.
Methods
This cross-sectional study was conducted at Faculty of Communication Studies (FIKOM) Universitas Padjadjaran, Jatinangor campus from September to November 2013.
Jatinangor where the researcher counted per 10 undergraduates with big size. After significant big size undergraduates were identified, an interview session was conducted with the academic officer and study program coordinator as a conformational step.
In the study from 2009−2013, 513 Strata 1 (S1) undergraduates were randomly selected to undergo screening process to measure anthropometric measurements. Body weight and height were measured with informed consent. Subsequently, they were categorized using Asian body mass index (BMI) classification.
According to the Asian BMI classification, 53 undergraduates were identified as obese class I and II. According to Central Limit Theorem with minimal sample 30, it is normally disturbed; therefore, 30 obese undergraduates were randomly selected. Their body weight and height were remeasured to avoid instrument bias. They were given 3x24 hours Food Recall questionnaire to observe their eating pattern. The 3x24 hours Food Recall was conducted on a particular week which was on two weekdays and one during the weekend. The respondents were interviewed using Food Model and Ukuran Rumah Tangga (URT).
All data collected were the key in nutrisurvey program 2007 and additional information regarding the calorific value was obtained from Food Composition Table (Daftar Komposisi Bahan Makanan, DKBM) and the food packets. From the program, the total number of calorie uptake was recorded by categorizing the uptake of energy, carbohydrate, protein, and
fat. The data were then categorized into 3 groups according to the Recommended Dietary Allowance (RDA) 2012; less if intake per Rate of Diet Index (RDI) was less than 80%, normal if the intake per RDI 80 was untill 100%, and more if intake per RDI was greater than 100%. The categorization was then analyzed using computer.
Results
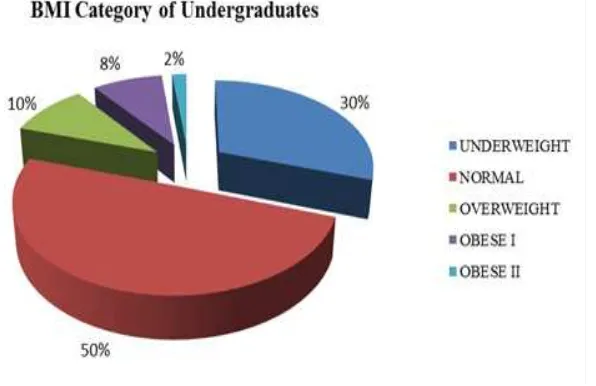
From 512 undergraduates, 10% undergraduates were obese I and II. Thirty undergraduates were chosen, from the fifty obese undergraduates who underwent the survey.
Characteristics of the respondents were selected from prevalence optimum based on gender that the equal was 1:1. The respondents were undergraduates with age range 17 to 22 years old.
Since the study was conducted on Asian obese undergraduates, the undergraduates were categorized according to Asian BMI Classification. Risk fall in range of 23.0–24.9 kg/m2, 25.0–29.99 kg/m2 was considered as Obese Class I and if more than 30 kg/m2, it was considered as Obese Class II.
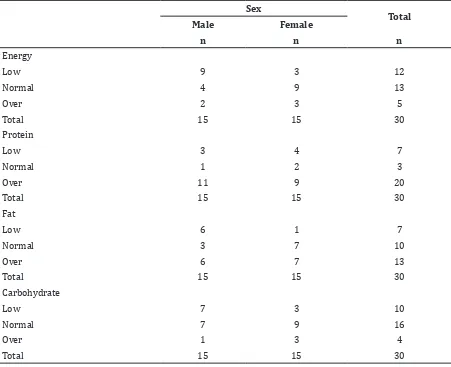
Based on sex, there were 60% male undergraduates with low energy intake and 60 % female undergraduates with normal energy intake. Based on the protein intake, both male and female undergraduates generally had over/excess protein intake. Based on the fat intake, 40% male undergraduates had excess fat intake and 40% less fat intake. As
for female undergraduates, there were 46.7% with excess and normal fat intake, and only a small proportion with less fat intake (6.7%).
Based on the adequacy of carbohydrate intake, 46.7% male undergraduates with normal carbohydrate sufficiency; as well as male undergraduates, female undergraduates had more carbohydrate intake to normal levels.
From the study, commonly consumed food was also taken into consideration, the results showed that the uptake of food containing carbohydrate was mostly consumed by obese undergraduates, For example, rice, bread, makassar dried noodle,wet noodle, porridge, fries, rice cake (lontong Asian cuisine), and rice vermicelli. Rice was most widely consumed by obese undergraduates with 59.9 %. Animal protein which was highly consumed by obese undergraduates was chicken 52.9%, followed by egg (29.3%), fish (5.7%), meat (7.9%), and chicken liver (4.3%); light meal and beveragewere sweetened tea (29. 8% ), biscuit (19.0%), tea (13.2%), snacks (11.6%), chocolates (9.1%), coffee
(7.1%), tago (6.6%), and meatball (3.3%). Frequency of consumption of vegetables and fruits and vegetable protein showed 11.55% and 10.76%, respectively. Highly consumed vegetables such as sayur ubi, kale, etc were 49.3% and fruits such as banana, orange, corn, apple, watermelon, etc were 11.9%. Frequency of fat intake shows that 3.32%.
Discussion
Considering Indonesia that is an Asian developing country, Asian BMI Classification was used to identify the obese undergraduates. Based on the report of Basic Health Research (Riskesdas) 2010, the prevalence of obesity of adults who are more than 18 years old is 11.7% as if Figure 1 proved that 10% undergraduates were still obese.2 Mainly, they
were categorized as obese class I and were more in male compared to female.
In current global epidemic of obesity accuracy appearance from a combination of genetic susceptibility, availability of high
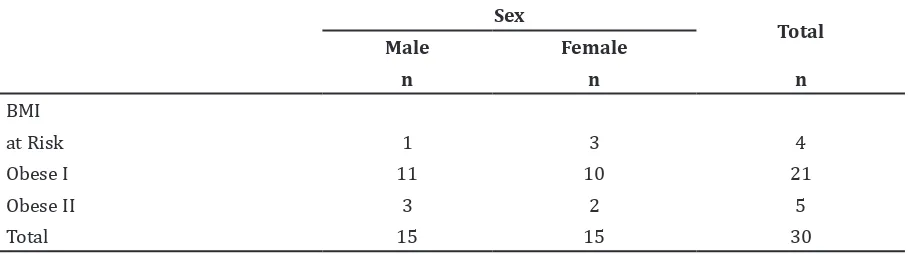
Table 2 BMI Category and Sex
Sex
Total
Male Female
n n n
BMI
at Risk 1 3 4
Obese I 11 10 21
Obese II 3 2 5
Total 15 15 30
Note: *BMI : Body Mass Index
Table 1 Respondent Characteristics
Characteristics n
Age (years old)
17 2
18 4
19 9
20 11
21 3
22 1
Sex
Male 15
energy food increases and requirements for physical activity decrease in modern society. Obesity should no longer be neglected as simply as a cosmetic problem affecting certain individuals, but it is an epidemic that threatens global well-being. It is important to assess eating pattern of any population in order to have a broader idea of nutrient intake and nutritional status of any population. Review of literature showed that there is no sufficient
study available for such data in Jatinangor. This survey reflects a general eating pattern subjected to obese undergraduates.4
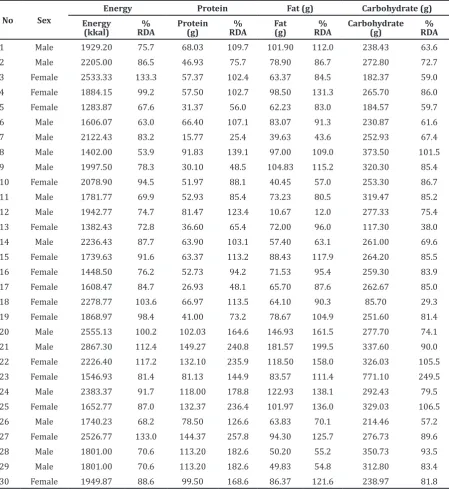
The term used for nutritional adequacy rate varies between countries. Indonesia uses the term Angka Kecukupan Gizi (AKG) as a translation of the Recommended Dietary Allowance (RDA). The most excess intake was protein diet, 66.1% (Table 3). Excess consumption of protein will be converted Table 3 Eating Pattern and Recommended Dietary Allowances according to Sex
No Sex
Energy Protein Fat (g) Carbohydrate (g)
Energy (kkal)
% RDA
Protein (g)
% RDA
Fat (g)
% RDA
Carbohydrate (g)
% RDA
1 Male 1929.20 75.7 68.03 109.7 101.90 112.0 238.43 63.6
2 Male 2205.00 86.5 46.93 75.7 78.90 86.7 272.80 72.7
3 Female 2533.33 133.3 57.37 102.4 63.37 84.5 182.37 59.0
4 Female 1884.15 99.2 57.50 102.7 98.50 131.3 265.70 86.0
5 Female 1283.87 67.6 31.37 56.0 62.23 83.0 184.57 59.7
6 Male 1606.07 63.0 66.40 107.1 83.07 91.3 230.87 61.6
7 Male 2122.43 83.2 15.77 25.4 39.63 43.6 252.93 67.4
8 Male 1402.00 53.9 91.83 139.1 97.00 109.0 373.50 101.5
9 Male 1997.50 78.3 30.10 48.5 104.83 115.2 320.30 85.4
10 Female 2078.90 94.5 51.97 88.1 40.45 57.0 253.30 86.7
11 Male 1781.77 69.9 52.93 85.4 73.23 80.5 319.47 85.2
12 Male 1942.77 74.7 81.47 123.4 10.67 12.0 277.33 75.4
13 Female 1382.43 72.8 36.60 65.4 72.00 96.0 117.30 38.0
14 Male 2236.43 87.7 63.90 103.1 57.40 63.1 261.00 69.6
15 Female 1739.63 91.6 63.37 113.2 88.43 117.9 264.20 85.5
16 Female 1448.50 76.2 52.73 94.2 71.53 95.4 259.30 83.9
17 Female 1608.47 84.7 26.93 48.1 65.70 87.6 262.67 85.0
18 Female 2278.77 103.6 66.97 113.5 64.10 90.3 85.70 29.3
19 Female 1868.97 98.4 41.00 73.2 78.67 104.9 251.60 81.4
20 Male 2555.13 100.2 102.03 164.6 146.93 161.5 277.70 74.1
21 Male 2867.30 112.4 149.27 240.8 181.57 199.5 337.60 90.0
22 Female 2226.40 117.2 132.10 235.9 118.50 158.0 326.03 105.5
23 Female 1546.93 81.4 81.13 144.9 83.57 111.4 771.10 249.5
24 Male 2383.37 91.7 118.00 178.8 122.93 138.1 292.43 79.5
25 Female 1652.77 87.0 132.37 236.4 101.97 136.0 329.03 106.5
26 Male 1740.23 68.2 78.50 126.6 63.83 70.1 214.46 57.2
27 Female 2526.77 133.0 144.37 257.8 94.30 125.7 276.73 89.6
28 Male 1801.00 70.6 113.20 182.6 50.20 55.2 350.73 93.5
29 Male 1801.00 70.6 113.20 182.6 49.83 54.8 312.80 83.4
30 Female 1949.87 88.6 99.50 168.6 86.37 121.6 238.97 81.8
Table 4 Pattern of Energy Consumption according to Sex
Sex
Total
Male Female
n n n
Energy
Low 9 3 12
Normal 4 9 13
Over 2 3 5
Total 15 15 30
Protein
Low 3 4 7
Normal 1 2 3
Over 11 9 20
Total 15 15 30
Fat
Low 6 1 7
Normal 3 7 10
Over 6 7 13
Total 15 15 30
Carbohydrate
Low 7 3 10
Normal 7 9 16
Over 1 3 4
Total 15 15 30
into amino toxic inside the body which is a risk factor for cardiovascular diseases, degenerative disease, and also neural tube defect in pregnant woman.5 Inadequate
protein intake also can cause frailty which is also known as geriatric syndrome among elderly women, therefore, all the nutritional intake should be consumed appropriately according to requirements.6 Energy and
carbohydrate intake were normal according to AKG 43.3% and 53.5%. The findings from previous study gave a picture that overweight and obesity development on child influence by various factors besides diet, as well as genetic, environmental factor including individual, familial and structural variables.7
Vegetables and fruits are less consumed by obese undergraduates, 11.55% consumed fruits as juice and mostly sayur ubi and kale. Vegetables and fruits containing fibers function in regulation of body hunger and saturation and hence, body weight. Increased intake of vegetables and fruit may reduce burden disease such as ischemia heart disease, ischemia stroke, and also many cancer diseases.8
Beside carbohydrates and protein, the most commonly consumed food is snacks. Intake of sweets, desserts and snacks, bread, and dietary restraint were high in obese subjects with metabolic risk factors.9 Many other factors can
contribute to obesity besides eating pattern, for example, genetic predisposition or physical activity that may have a greater influence on the development of overweight and obesity than diet.10
There were many limitations during the period study conducted to obtain the sample and view of undergraduates’ food pattern. The stadiometer and weighing scale were not accurate and sensitive for screening process; therefore, the body weight and height of undergraduates were remeasured before the interview. Screening process took longer time frame. The 24 hour recall interview method required approaches to the respondents but timing and the environment were not appropriate because the interview during class hours was conducted. In addition, the 24 hour recall interview method required approaches to respondents and quiet environment during interview.
In conclusion, findings in this study indicated that prevalence of obesity is still high among undergraduate which is 10%. Common food and high intake of carbohydrates becomes factors of nutritional imbalance of obese undergraduates. Types of food which
most widely consumed are white rice, fried chicken, tofu, tempe (an asian food made from fermenting soybeans) and sweetened tea.
Future study should be conducted in communities. Nutritional status impacts the health issues, so it needs special care. It is pertinent to focus on improvement of the eating pattern of adults in order to prepare a future healthy nation.
References
1. WHO. Fact sheet N°311: obesity and overweight [cited 2013 April 1]. Available from: http://www.who.int/mediacentre/ factsheets/fs311/en/.
2. Department Kesehatan, Republik Indonesia. Laporan Nasional Riset Kesehatan Dasar ( RISKESDAS 2010). Jakarta: Menteri Kesehatan Republik Indonesia; 2010.
3. Skinner AC, Perrin EM, Moss LA, Skelton JA. Cardiometabolic risks and severity of obesity in children and young adults. N Engl J Med. 2015;373(14):1307–17.
4. Yahia N, Achkar A, Abdallah A, Rizk S. Eating habits and obesity among Lebanese university students. Nutr J. 2008;7:32.
5. Jakubowsk H. Pathophysiological consequences of homocysteine excess. J Nutr. 2006;136(6 Suppl):1741S–9S.
6. Kobayashi S, Asakura K, Suga H, Sasaki S. High protein intake is associated with low prevalence of frailty among old Japanese women: a multicenter cross-sectional study. Nutr J. 2013;12:164.
7. Oellingrate IM, Svendsen MV, Brantsaeter AL. Eating patterns and overweight in 9- to 10-year-old children in Telemark County: Norway a cross-sectional study. Eur J Clin Nutr. 2010;64(11):1272–9.
8. Lock K, Pomerleau J, Causer L, Altmann R, McKee M. The global burden of disease attributable to low consumption of fruit and vegetables: implications for the global strategy on diet. Bull World Health Organ. 2005;83(2):100–8.
9. Svendsen M, Tonstad S. Accuracy of food intake reporting in obese subjects with metabolic risk factors. Br J Nutr. 2006; 95(3):640–9.