68
The Impact of Stress at Work on
Employee’s Psychological Well
-being in Jakarta
Nafiri Paramitha Kurnia
International Business Management Program, Petra Christian University Jl. Siwalankerto 121-131, Surabaya
E-mail: [email protected]
ABSTRACT
Higher work demands is experienced by employees working in Jakarta due to companies’ need to increase their productivity. Despite increasing productivity, higher work demands leads to higher stress at work, which indirectly affect companies’ productivity itself. This research is conducted to study the extent of stress at work, along with its factors, in impacting employee’s psychological well-being. Samples are employees working in Jakarta from diverse industries, which are taken using questionnaire based on simple random sampling method, and 108 respondents are able to be obtained. Data is analyzed using Multiple Linear Regression, and the result there is significant impact of stress at work on employee’s psychological well-being in Jakarta. The result also shows that Influence over Decision, Role Clarity, Autonomy and Control, and Peer Support are the factors of stress at work which significantly impact employee’s psychological well-being.
Keywords: Stress at work, job stressors, employee’s psychological well-being
ABSTRAK
Tuntutan pekerjaan yang semakin tinggi dialami oleh Karyawan di Jakarta lantaran tuntutan perusahaan untuk menaikkan produktivasnya. Hal ini berimbas pada makin rentannya pekerja mengalami stress kerja, dimana stress kerja ini akan mempengaruhi psychological well-being karyawan, yang secara tidak langsung mempengaruhi produktivitas perusahaan itu sendiri. Penelitian ini dilakukan untuk mengetahui pengaruh stress kerja dan faktor-faktor stress kerja terhadap psychological well-being karyawan di Jakarta. Sampel yang diambil adalah karyawan dari segala bidang di Jakarta yang diperoleh menggunakan alat kuesioner dengan metode simple random sampling, dan didapat sebanyak 108 responden. Analisa data mengadopsi metode Regresi Linier Berganda, dan diperoleh hasil bahwa stress kerja memiliki pengaruh yang signifikan terhadap psychological well-being karyawan di Jakarta. Hasil dari penelitian ini juga menunjukan bahwa faktor-faktor stress kerja yang berpengaruh secara signifikan terhadap psychological well-being karyawan adalah Pengaruh atas Keputusan, Kejelasan Peran, Otonomi dan Control, serta Dukungan Rekan.
Kata Kunci: Stres kerja, job stressors, psychological well-being karyawan
INTRODUCTION
Stress at work has gained more attention in the recent years, as the number of employees experiencing it is increasing since globalization takes place. For instance, in the United States, according to the survey conducted by Harris Interactive, in 2012 73 percent of Americans were experiencing stress at work, even this number increased to 83 percent in 2013 (Huffingpost, 2013). The same thing also happened in Singapore, where based on Health Behaviour Surveillance of Singapore, there were 24 percent of Singaporean employees who experienced high stress
level in 2013, which was actually six percent higher than in the previous year (Human Resource Online, 2014).
69 which result in the inability to work productively and more sick leave (Smith et al., 2000; Kalia, 2002; Teasdale, 2006). Indonesia, as one of the fast growing countries in the world, also experience similar trend. A survey from Regus Asia pointed out that in 2012, 64 percent of employees in Indonesia felt more sstressful about their job compared to the previous year (in Ramadian, 2012). Regardless of the importance of this topic – stress at work and employee’s psychological well-being – there are still few researches related to this topic are done in Indonesia. Therefore, this current research would like to fill this gap, by conducting research about the impact of stress at work on employee’s psychological well-being in Jakarta, as Jakarta is the capital city of Indonesia which makes it the economic center of the country. This current research is hoped to trigger the awareness of companies about the importance of stress at work and employee’s psychological well-being, as well as to give insight on how to manage the level of stress at work in order to gain companies’ sustainability.
LITERATURE REVIEW
Stress at work is employee’s unpleasant feeling towards his job and/or the work environment, and it occurs when there is discrepancy between work loads and employee’s capability, where usually employee perceives his work loads exceeding his capability (McCormick, 1997; Khan & Raza, 2007; Blaug, Kenyon, & Lekhi, 2007). In addition, Olaitan, Oyerinde, and Kayode (2010) suggest that stress at work happens when the employee feels there is uncertainty about what he and/or the company will achieve in the future. Thus, stress at work may occur when employee perceives himself incapable to cope with the any pressures related to work, not only the work loads but also other factors.
The definition stated previously is supported by the theory of Person-Environment (P-E) Fit from Caplan and French (1972), which suggests that that stress at work will occur when there is no alignment between employee’s characteristics and his working environment. This theory support the definition of stress at work being used in a way that both definition and theory suggest that stress at work is the result of mismatch between work-related pressures and employee’s capabilities. Another theory from Stokols (1996), called the Social-Ecology Theory, tries to complement the understanding by arguing that employee’s perception about his inability to cope with work-related pressures is driven by his dispositions, resources, and characteristics, which somehow explain the person dimension of the P-E Fit theory. Whereas, theory from Karasek (1981) called Demand-Control-Support Model, as well as theory from Siegriest (1996) called Effort-Reward Imbalance (ERI) Model, and theory from Ursin and Eriksen (2004) called Cognitive Activation Theory of Stress (CATS)
enrich the understanding by coining several work-related pressures which are the factors of stress at work to explain the environment dimension of P-E Fit theory. Karasek (1981) in Demand-Control-Support Model suggests that stress at work happens when there are high work demand,
low job control, and low social support experienced by the employee. While Siegrist (1996) in ERI Model argues that employee may feel stressful at work when he perceives his rewarad, in terms of financial and feedback, is smaller than the effort he makes. In addition, the CATS theory suggests that stress at work is the result of uncertainty about the future demands and responsibility. Both person and environment dimensions are connected by the
Transactional Theory of Stress from Lazarus (1991), which suggests that stress happens because of the dynamic interactions between the person and his working environment, which are the person and environment dimensions in the P-E Fit theory.
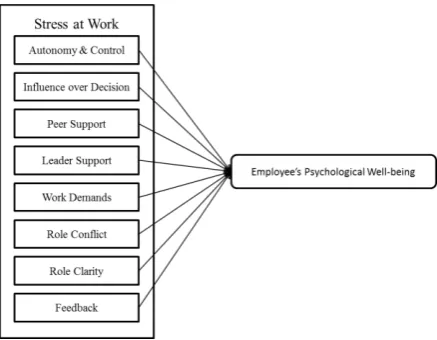
The factors of stress at work refers to the environment dimension, and as stated above, it is related to the Demand-Control Support Model from Karasek, ERI Model from Siegrist, and CATS theory from Ursin and Eriksen. In order to accommodate all the factors based on those three theories, a construct from Haynes, Wall, Bolden, Stride, and Rick (1999) called Perceived Work Characteristic Survey is adopted. There are eight dimensions to be included as factors of stress at work, which are Autonomy and Control, Influence over Decision, Peer Support, Leader Support, Work Demands, Role Conflict, Role Clarity, and Feedback.
As stated in the journal of Shea and De Cieri (2011), autonomy and control is the degree of freedom given to the employee to determine, manage, and carry out his job according to his best method. Influence over decision refers to the empowerment given to the employee to participate in the decision making process. Peer support is the extent to which employee receives support and help from his colleagues. Leader support is the amount of support given by the supervisors in terms of encouragement, suggestion, and self-example. Work demand refers to the characteristics of the job which is related to the time pressure, amount of work, and resources to meet the demand. Role conflict is also related to the conflicting situation faced by the employee, such as conflicting demands, instructions, and expected result from two different people. Role clarity refers to the clarity of goals and objectives, responsibility, and expectation that the employee perceives about his job. Feedback tries to measure the ease of the employee to figure out whether his job meets company’s expectation or not.
well-70 being (i.e: interpersonal relationship among individuals) (Warr, 2012).
Warr (2012) brings two philosophical frameworks up to define the psychological well-being: the “hedonic” and “eudaimonic” framework. The two frameworks are differentiated by from which perspective the psychological well-being will be measured. The hedonic framework focuses on the pleasure in life or how the employee feels satisfied about his job, while the eudaimonic framework focuses on the meaningfulness of life or how employee feels flourished as the result of involving in the job. According the Philoshopher Aristotle, having good life is more important than having pleasure life, as good life will result in pleasure in life, while pleasure life does not always mean having a good life. Therefire, this current research will focus on the eudaimonic framework instead of the hedonic one.
One widely-used construct to measure the eudaimonic framework of psychological well-being is the Ryff’s Scales of Psychological Well-being from Ryff and Singer (1996). In order to measure the meaningfulness of life, this construct gives six dimensions, which are Self Acceptance, Positive Relations with Others, Autonomy, Environmental Mastery, Purpose in Life, and Personal Growth.
Based on the two concepts about stress at work and employee’s psychological well-being presented above, the theoretical framework and hypothesis that can be developed is as follow:
Figure 1. Relationship between concepts, theories, and variables
Hypothesis:
H1: Stress at Work simultaneously has significant impact on employee’s psychological well-being
H2: Autonomy and Control has significant impact on employee’s psychological well-being
H3: Influence over Decision has significant impact on employee’s psychological well-being
H4: Peer Support has significant impact on employee’s psychological well-being
H5: Leader Support has significant impact on employee’s psychological well-being
H6: Work Demand has significant impact on employee’s psychological well-being
H7: Role Conflict has significant impact on employee’s psychological well-being
H8: Role Clarity has significant impact on employee’s psychological well-being
H9: Feedback has significant impact on employee’s psychological well-being
The first hypothesis tries to analyze the impact of stress at work simultaneously on employee’s psychological well-being. On the other hand, hypothesis 2 to hypothesis 9 focus on the impact of eight factors of stress at work on employee’s psychological well-being.
Several preceeding researches have been proven to yield result that may support the framework developed in this current research. Firstly, a research from Adekoge (2014), which analyze the effect of occupational stress on psychological well-being of police employees in Ibadan Metropolis, Nigeria. The result of his research showed that there was significant effect of stress at work on the psychological well-being of police employees in Ibadan Metropolis. Similarly, a research from Akintayo (2012) about occupational stress, psychological well-being and workers’ behavior in manufacturing industries in South-West Nigeria also proved that there was significant relationship between occupational stress and psychological well-being among the employees in that particular industry and area. In addition, the research from Yunus and Mahajar (2011) about stress and psychological well-being of government officers in Malaysia showed that simultaneous occupational stress had significant relationship with psychological well-being. However, from the six dimensions of occupational stress being used, only four of them which were proven to have significant impact on psychological well-being. Those four dimensions included role overload, role ambiguity, role boundary, and role insufficiently. The elimination of two dimensions somehow led to the small contribution of occupational stress on psychological well-being, which was only 25.2% as proven in the research. Despite the result obtained, the research from Yunus and Mahajar (2011) supports the idea of significant impact of each factor of stress at work on employee’s psychological well-being.
RESEARCH METHOD
71 As implied that the objective of this current research is to find the impact of stress at work on employee’s psychological well-being, stress at work with its eight factors will act as the independent variables, whose role is to affect the employee’s psychological well-being as the dependent variable. The eight factors of stress at work or the independent variables are taken from Perceived Work Characteristics Survey by Haynes, Wall, Bolden, Stride, and Rick (1999). They include Autonomy and Control (e.g: to what extent do you determine the methods and procedures you use in your work), Influence over Decision
(e.g: to what extent do you have the opportunity to contribute to meetings on new work developments), Peer Support (e.g: to what extent can you count on your colleagues to help you with a difficult task at work), Leader Support (e.g: how much does your immediate superior encourage you to give your best effort), Work Demand (e.g: I do not have enough time to carry out my work), Role Conflict (e.g: I receive conflicting instructions from two or more people), Role Clarity (e.g: I do not have clear planned goals and objectives for my job), and Feedback (e.g: I usually do not know whether or not my work is satisfactory in this job). Each of those eight factors of stress at work has several indicators, where in total there are 39 indicators. As for the employee’s psychological well-being which acts as the dependent variables, the construct is taken from Ryff’s
Scales of Psychological Well-being. This particular construct has 18 indicators related to employee’s self-acceptance, positive relations with others, autonomy, environmental mastery, purpose in life, and personal growth, for instance: I like most aspects of my personality, I have experienced many warm and trusting relationships with others, I have confidence in my opinions even if they are contrary to the general consensus, the demands of everyday life do not get me down, I do not live life one day at a time and I plan for my future, I think it is important to have new experiences that challenge how you think about yourself and the world.
The data being used in this current research is primary data, which is obtained by distributing questionnaire. The questionnaire is divided into two parts, the screening questions which ask about the profile of the respondents, and the target questions which includes the 39 indicators of stress at work and 18 indicators of employee’s psychological well-being. For the screening questions, the data obtained is both nominal and ordinal data, while the target questions use interval data by adopting likert scale. For construct stress at work, 5-point liker scale is used, where 1 indicates stressful condition, and 5 indicate not stressful condition. Whereas for construct employee’s psychological well-being, 6-point likert scale is used, where 1 indicates a bad psychological well-being, and 6 indicates a good psychological well-being. The questionnaires are distributed based on the simple random sampling method, and it is conducted by distributing the questionnaires in the office district in Jakarta and malls.
This current research is using Multiple Linear Regression to achieve its objectives, and all statistical calculation is done by SPSS 22. Multiple linear regression
is used because this statistical method is able to find the significance of several independent variables to one dependent variable (Supriyanto, 2009).
Before conducting the Multiple Linear Regression, justification of the data in terms of the validity and reliability tests need to be done first. Validity test is conducted in order to test the ability of the instrument or tool to measure what it is intended to measure (Lancaster, 2005; Supriyanto, 2009; Cooper & Schindler, 2011). The method to analyze the validity of the construct is by correlating the score of each indiator with the total score of its respective variable (Supriyanto, 2009; Siregar, 2014). The correlation coefficient of each indicator to its respective variable needs to be greater than +0.3 and has significance value below than the significance level (α) (Siregar, 2014). Since this current research decides to use 85% of confident level, the significance level (α) is then 0.15. Reliability test, on the other hand, is used to see the ability of the instrument or tool to give consistent result over time and sample (Supriyanto, 2009; Cooper & Schindler, 2011; Siregar, 2014). The reliability of the instrument can be evaluated from the Cronbach’s Alpha value, where a value greater than 0.6 indicates that the instrument is reliable (Santosa & Ashari, 2005; Supriyanto, 2009; Siregar, 2014).
Multiple Linear Regression requires the fulfillment of four classics assumption, including normality, multicollinearity, autocorrelation, and heteroscedastiity. For the normality assumption, the residuals of the data have to be normally distributed (Santosa & Ashari, 2005). The method to evaluate the normality assumption is by conducting Kolmogorov-Smirnov test, and the residuals of the data is said to be normally distributed if the significance value of the Kolmogorov-Smirnov is greater than the significance level (α). (Ulwan, 2014; Rahardjo, 2014), and this current research use the significance level (α) of 0.15. For the multicollinearity assumption, all the independent variables must not be correlated to each other, which means multicollinearity should not exist among the independent variables (Santosa & Ashari, 2005). To decide that there is no multicollinearity, the VIF value of each independent variable needs to be less than 10 (Mela & Kopalle, 2002; Franke, 2010), and the tolerance value should be greater than 0.1 (Jeeshim & Kucc, 2002). For the autocorrelation assumption, there should be no autocorrelation in the data which means that the residuals in this particular observation should not correlated to itself in either the previous or next observation (Santosa & Ashari, 2005). Data is said to be free from autocorrelation if the Durbin-Watson shows a value of ±2 (Babatunde, Oguntunde, Ogunmola, & Balogun, 2014). For the heteroscedascity assumption, the residuals of the data need to have similar variance or no heteroscedasticity (Santosa & Ashari, 2005). The method to evaluate the heteroscedasticity problem is by conducting Park Test, where the significance t value needs to be greater than the significance level (α) in order to say that there is no heteroscedasticity among the residuals of the data (Asmin, Sale, Islamiyati, n.d).
72 psychological well-being, the nine hypotheses will be tested using the F-test and t-test. Firstly, F-test or ANOVA is used to test the simultaneous impact of independent variables on the dependent variable (Siregar, 2014; Supriyanto, 2009). In this current research, F-test or ANOVA is used to test the first hypothesis as stated in the hypothesis part in the Literature Review.
The decision to accept or reject the null hypothesis is based on the significance F value and the F-value itself. For the significance F value, this value needs to be below the significant level (α), and since this current research uses confident level of 85%, the significance level (α) is 15% or 0.15. Therefore, for this current research, the significance F value should be below 0.15 in order to reject null hypothesis (H0). Whereas for the F-value, the F-value needs to be greater than the F-table in order to reject the null hypothesis (H0). The value of F-table itself can be obtained from the F-distribution table based on the following term:
The decision of rejecting the null hypothesis indicates that there is significant impact of stress at work on employee’s psychological well-being simultaneously.
Secondly, t-test is used to analyze the impact of independent variables on the dependent variablepartially (Siregar, 2014). In this current research, t-test is conducted to test the second until ninth hypotheses, as stated in the hypothesis part in Literature Review.
Almost similar to F-test, t-test also considers two decision rules to accept or reject the null hypothesis. The first decision rule relates to the significance t, which needs to be below the significance level (α) of 0.15 in order to reject the null hypothesis. In addition, the t-value needs to be greater than the value of t-table in order to reject the null hypothesis.
The decision of rejecting the null hypothesis indicates that there is significant impact of the factors of stress at work on employee’s psychological well-being.
Thirdly, the unstandardized regression coefficient is used in order to identifiy whether the impact of the independent variables on the dependent variables are positive or negative. The positive sign implies a positive correlation between the factor of stress at work and employee’s psychological well-being, while negative sign implies a negative correlation between them (Siregar, 2014). Besides the direction implied by the sign, the absolute value of the unstandardized coefficient regression will show the degree of the influence, where the higher the absolute value shows the more influencial the factor is. The value of the unstandardized regression coefficient is adopted to derive the regression equation model.
Related to the Multiple Linear Regression, the value of the Adjusted R-Square is able to show the contribution of the independent variables to explain the dependent variable (Siregar, 2014; Supriyanto, 2009). The value of adjusted R-square lies within range of 0 to 1, where tgreater the value indicates a bigger contribution of the independent variabes to the dependent variable. Although the maximum value of adjusted R square is 1, it is very rare to get value of 1, since it is impossible to be able to find independent variables which are able to completely explain dependent
variable. Therefore, the remaining value of adjusted R square goes to other factor which is not covered by the independent variables in the model (Supriyanto, 2009).
RESULTS AND DISCUSSION
The result of the validity test shows that the correlation coefficient, indicated by Pearson Correlation, of each indicator to its respective variable lies within range of +0.5 to +0.8, which is higher than the minimum requirement of +0.3. In addition, the significance value of each indicator to the variable is 0.000 which is below the significance level (α) of 0.15. Both results imply that there is strong correlation between the indicator and its respective variable, therefore, all variables are able to be considered of having validity. The result of the reliability test using the Cronbach’s Alpha shows that the values of the Cronbach’s Alpha for each variable are between 0.7 and 0.9. As the values are above the minimum value of 0.6, all variables are able to be considered of having high internal consistency or high reliability.
For the normality assumption using the Kolmogorov-Smirnov test, the Kolmogorov-Kolmogorov-Smirnov significance value is 0.169, which is greater than the significance level (α) of 0.15. Therefore, it indicates that the residual of the data fulfills the assumption of normal distribution. For the multicollinearity assumption based on the VIF value, all independent variables have VIF values below 10, which are around 1 to 2. Whereas, based on the Tolerance value, all the independent variables’ tolerance value are greater than 0.1, which are around 0.3 to 0.5. Both results indicate that the independent variables are not correlated to each other. Therefore, they fulfill the assumption of not having multicollinearity. For the autocorrelation assumption based on the Durbin-Watson value, this current research results a value of 1.808. Because this value is still ±2, it indicates that there is no autocorrelation in this current research, or it means that the residual of the data in this current research is not correlated to itself. Therefore the autocorrelation assumption is able to be fulfilled. For the heteroscedasticity assumption using Park test, the significance t value are all greater than the significance level (α) of 0.15, which are around. This result leads to the fulfillment of heteroscedasticity assumption, since there heteroscedasticity is proven not to exist in the data based on the significance t value.
Table 1 below summarizes the results obtained from multiple linear regression analysis:
Tabel 1. Result of Multiple Linear Regression Analysis for the Impact of Stress at Work on Employee’s Psychological Well-being in Jakarta
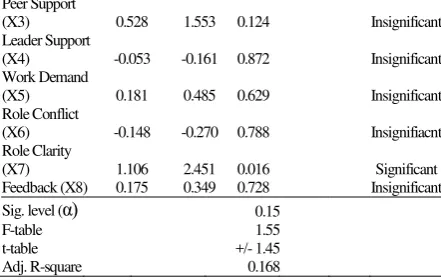
Variable Regression Coefficient t-value Sig. t F-value Sig. F Remark
Regression 3.701 0.001 Significant
Constant 57.019 7.093 0.000 Significant Autonomy and
Control (X1) -0.727 -1.866 0.065 Significant Influence over
73
Feedback (X8) 0.175 0.349 0.728 Insignificant
Sig. level (α) 0.15 simultaneously has significant impact on employee’s psychological well-being. As the F-value of 3.701 is greater than the F-table of 1.55, and the Significance F value of 0.001 is below the significance level (α) of 0.15, the decision being made is to reject the null hypothesis. It means that there is significant impact of stress at work simultaneously on employee’s psychological well-being, therefore, H1 is accepted. This result supports the previous researches’ findings from Adekoge (2014), Akintayo (2012), and Yunus and Mahajar (2011), in which all researches proved that stress at work significantly correlates and impacts employee’s psychological well-being. Futher, although it is proven that stress at work has significant impact on employee’s psychological well-being, based on the adjusted R-square value, stress at work in this current research is only able to explain 16.8% of employee’s psychological well-being, which implies that the remaining 83.2% of employee’s psychological well-being is explained by other factors not captured in this current research. This finding is actually similar to what Yunus and Mahajar (2011) found, where in their research, only 25.2% of psychological well-being in influenced by stress at work.
t-test is conducted to achieve the second objective, which is to find the factors of stress at work that have significant impact on employee’s psychological well-being. Based on the t-value and the significance t presented in Table 1 above, only X1, X2, X3, and X7 are shown to have t-value greater than t-table of +/- 1.45, as well as Significance t below significance level (α) of 0.15. Therefore, only the null hypotheses of X1, X2, X3, and X7 are able to be rejected, which means that only Autonomy and Control, Influence over Decision, Peer Support, and
Role Clarity are proven to have significant impact on employee’s psychological well-being. Thus, from the eight remaining hypotheses being developed in this current research, only H2, H3, H4, and H8 are accepted. As this current research accepts that Role Clarity has significant impact on employee’s psychological well-being, this current research confirms the finding from Yunus and Mahajar (2011) that role ambiguity (similar to role clarity) significantly impact employee’s psychological well-being. Whereas, as this current research accepts that Work Demands and Role Conflict having insignificant impact on employee’s psychological well-being, this current research
cannot confirm the finding from Yunus and Mahajar (2011) which says that role overload (similar to work demands) and role boundary (similar to role conflict) do significantly impact employee’s psychological well-being.
There are several possible other factors of stress at work which may impact employee’s psychological well-being, both related and non-related. For the job-related factors, based on the result of Yunus and Mahajar (2011) research, role insufficiency, or the lack of training, skills, and experiences to meet work demands, is one of the significant factors influencing employee’s psychological well-being. Furthermore, a study about stress at banking sector from Goodway (2013) found that there are four main reasons of employee to experience stress at work in that particular sector, namely unfeasible sales target, lower salaries, having to handle the same workload with fewer members of staffs, and fears of being cut-off. In addition, Karima (2014) suggests that physical condition of the workplace is one of the most important factors in creating stress at work. The physical condition of the workplace includes noise, lighting, temperature, and air circulation. Besides job-related factors, a study from Manshor (2000) found that stress at work was also contributed by other factors beyond job-related, such as individual and family factors, socio-economic and financial status, and mental and health. This study is also supported by the finding from Mathew (2005), who found that home/work interface impacted the level of stress at work happened in special educators in India. In addition, related to the socio-economic and financial status, a study from Goldsmith (2013) found that employees throughout Europe, Asia, Africa, and Latin America admitted they were under stress as they battled the financial crisis. Other non-job-related factors which might influence stress at work specifically in Jakarta, based on several interviews with employees working in Jakarta, are traffic and flood. The regular flood, that comes every year, is not only affecting those people whose experience flood directly, but also people who are indirectly affected by the traffic jam due to flood (Kompas, 2015). In addition to traffic in Jakarta, according to survey from Castrol Magnatec Star-Stop, the level of traffic in Jakarta is the worst among other countries in the world. Although these two non-job related factors are still not statistically proven, as some of employees brought these issues up as well as the supporting article and finding which highlight these problems, there is probability that it may be true. Based on the factors of stress at work, both job-related and non-job-related, mentioned above, if those factors are included in the model, there is possibility that stress at work may better explain employee’s psychological well-being.
74 psychological well-being.. Meanwhile, Influence over Decision (X2), Peer Support (X3), Work Demand (X5), Role Clarity (X7) and Feedback (X8) have positive sign to indicate a positive correlation where an increase in those variables will increase employee’s psychological well-being as well. Refer back to the explanation of the likert scales being used for both stress at work and employee’s psychological well-being, the higher the score of stress at work indicates the less stress the employee is, whereas , the higher score of psychological well-being indicates that the employee has better psychological well-being. Based on this assumption, it means that if the values of the factors of stress at work increase, it means the less not stressful the employee is, while if the value of psychological well-being increase, it means the better the employee’s psychological well-being. Therefore, for independent variables whose signs are positive, as the employee feels less stressful (increase the unit), their psychological well-being will improve, or in other words, as the employee perceives to be stressful in those factors (decrease the unit), their psychological well-being will be disturbed. On the other hand, for independent variables whose signs are negative, the more stressful the employees are in those particular factors (decrease the unit), the better their psychological well-being are, vice versa. From the eight factors of stress at work, there are five factors which interpretably bring negative impact to employee’s psychological well-being as they get worse. Thus, the researcher may say that mostly stress at work negatively impact employee’s psychological well-being, and therefore support the finding from Akintayo (2012) that stress at work has negative impact on employee’s psychological well-being. The fact that there are both negative and positive impacts that stress at work may have on employee’s psychological well-being support the idea from Selye (1976) who coins out that there are two kinds of stress; positive stress or eustress and negative stress or distress (in Jackson, 2004, p. 5). The difference between two is that eustress is beneficial in a way that it promotes growth, motivation, and positive experience (Jackson, 2004). In the context of stress at work, eustress might help motivating employees to work more productively as well as promoting employees psychologically (Hargrove, Nelson, & Cooper, 2013). On the other hand, distress is a destructive stress which may discourage the psychological well-being and may be manisfested in terms of anxiety, anger, depression, withdrawal or isolation, low commitment to work, and others (Bickford, 2005).
Lastly, among the eight factors of stress at work, the one having the biggest absolute value of unstandardized coefficient is Influence over Decision (b = 1.259), and then followed by Role Clarity (b = 1.106), Autonomy and Control (b = 0.727), and last Peer Support (b = 0.528). It means, among those eight factors, Influence over Decision is the most influential factor affecting employee’s psychological well-being, followed by Role Clarity in the second place. For Autonomy and Control with coefficient of 0.727, although the sign is negative, this Autonomy and Control is still more influential than Peer Support because the consideration is the absolute value. Last, as the
coefficient of Peer Support is 0.528, it makes this factor the fourth most influential factor determining stress at work.
CONCLUSION
This research shows that indeed there is significant impact of stress at work on employee’s psychological well-being, where 16.8% of psychological well-being is proven to be contributed by stress at work. Although stress at work has been proven to significantly impact employee’s psychological well-being simultaneously, from the eight factors of stress at work introduced in this research, only four of them are proven to have significant impact partially. Those four factors are: Autonomy and Control, Influence over Decision, Peer Support, and Role Clarity, in which Autonomy and Control is eustress or positive stress, while Influence over Decision, Peer Support,and Role Clarity are distress or negative stress. Among the four significant factors of stress at work, Influence over Decision is proven to be the most influencial factor since it has the biggest absolute value of regression coefficient. This factor is followed by Role Clarity, Autonomy and Control, and last Peer Support.
Despite the ability of this research to propose insight related to stress at work and employee’s psychological well-being, this research has at least two limitations. First, this research is very limited in terms of area coverage, where only Jakarta is being covered. Therefore, future research may broaden the area coverage to other cities in order to achieve better generalization of Indonesia. Second, this research has limited independent variables or factors of stress at work, which leads to small contribution of stress at work on employee’s psychological well-being. In order to have richer knowledge, future research may conduct similar research with different independent variables, such as the physical condition of the working environment, or personal matters related to family and health issue, as proven to have significant impact based on the research from Karina (2014) and Manshor (2000). By proposing other factors, the result of the future research will be able to complement and be compared with ones suggested in this current research.
REFERENCES
Adegoke, T. G. (2014, January). Effects of Occupational Stress on Psychological Well-being of Police Employees in Ibadan Metropolis, Nigeria.
Multidiscipinary Journal, 8 (1), 302-320.
Akintayo, D. (2012). Occupational Stress, Psychological Well Being and Workers' Behaviour in Manufacturing Industries in South-West Nigeria.
Research Journal in Organizational Psychology & Educational Studies, 1(5), 289-294.
Asmin, M., Saleh, M., & Islamiyati, A. (n.d.). Pengujian Heteroskedastisitas Pada Regresi Eksponensial Dengan Menggunakan Uji Park. Makasar: Universitas Hasanuddin.
75 Bickford, M. (2005). Stress in the Workplace: A General
Overview of the Causes, the Effects, and the Solutions. Canadian Mental Health Association. Blaug, R., Kenyon, A., & Lekhi, R. (2007). Stress at Work.
London: The Work Foundation.
Casey, L. (2012). Stress and wellbeing in Australia in 2012: A state-of-the-nation survey. Melbourne: Australian Psychological Society.
Cooper, D. R., & Schindler, P. R. (2011). Business Research Methods. New York: McGraw-Hill/Irwin. Franke, G. R. (2010). Multicollinearity. Wiley International
Encyclopedia of Marketing 2.
Goodway, N. (2013). Stress and job cuts take toll on bankers. Switzerland: UNI Global Union.
Hargrove, M. B., Nelson, D. L., & Cooper, C. L. (2013). Generating eustress by challenging employees: Helping people savor their work. Organizational Dynamics, 61-69.
Huffingpost Healthy. (2013, April 10). Retrieved February 12, 2015, from Work Stress On The Rise: 8 In 0 Americans Are Stressed About Their Jobs, Survey Finds:
http://www.huffingtonpost.com/2013/04/10/work-stress-jobs-americans_n_3053428.html
Jackson, D. A. (2004). A Survey of the Occupational Stress, Psychological Strain, and Coping Resources of Licensed Professional Counselors in Virginia: A Replication Study. Blacksburg, VA: Virgnia Polytechnic Institute and State University.
Jeeshim, & Kucc. (2002). Multicollinearity in Regression Model. Indiana.
Kalia, M. (2002). Assessing the economic impact of stress - The modern day hidden epidemic. Metabolism, 49-53.
Karima, A. (2014). Faktor-faktor yang Berhubungan Dengan Stress Kerja Pada Pekerja di PT X Tahun 2014. Jakarta: Universitas Islam Negeri Syarif Hidayatullah.
Khan, M., & Raza, A. (2007). Occupational stress and coping mechanism to increase job satisfaction among supervisors at karachi pharmaceuticals.
Journal of Economics and Technology, 2.
Kompas. (2015, February 9). Penyakit akibat Banjir, Stres sampai Penyakit Kencing Tikus. Retrieved May 24,
2015, from Harian Kompas:
http://health.kompas.com/read/2015/02/09/1347129 23/Penyakit.akibat.Banjir.Stres.sampai.Penyakit.Ke ncing.Tikus
Kothari, C. R. (1990). Research Methodology Methods & Techniques. Jaipur: New Age International (P) Limited.
Lancaster, G. (2005). Research Methods in Management: A concise introduction to research in management and business consultancy. Oxford: Elsevier Butterworth-Heinemann.
Manshor, A. T. (2000). Sources of stress at the work place.
Academy of Strategic and Organizational Leadership Journal, 91-97.
Mathew, L. (2005). An exploratory study on occupational stress and coping strategies of special educators in South India. Calicut: Department of Psychology University of Calicut.
McCormick, J. (1997). Occupational stress of teachers: Biographical differences in a large school system.
Journal of Educational Administration, 35. Mela, C. F., & Kopalle, P. K. (2002). The impact of
collinearity on regression analysis: the asymmetric effect of negative and positive correlation. Applied Economics, 667-677.
Oguntunde, P., Babatunde, O., Ogunmola, A., & Balogun, O. (2014). On the Performance of RESET and Durbin Watson Tests in Detecting Specification Error. International Journal of Modern Mathematical Science, 144-151.
Olaitan, L. O., Oyerinde, O., & Kayode, O. (2010). Prevelence of job stress among primary school teachers in South West, Nigeria. African Journal of Microbiology Research, 1-18.
Rahardjo, S. (2014). SPSS Indonesia. Retrieved May 25, 2015, from Cara Melakukan Uji Normalitas
Kolmogorov-Smirnov dengan SPSS:
http://www.spssindonesia.com/2014/01/uji-normalitas-kolmogorov-smirnov-spss.html Ramadian, G. (2012, September 17). Waspada, Stres Intai
64 Persen Pekerja di Indonesia. Retrieved February
12, 2015, from okezone.com:
http://lifestyle.okezone.com/read/2012/09/17/198/6 91019/waspada-stres-intai-64-persen-pekerja-di-indonesia
Ryff, C. D. (2013). Psychological Well-Being Revisited: Advances in the Science and Practive of Eudaimonia. Psychotherapy and Psychosomatics, 10-28.
Ryff, C., & Singer, B. (1996). Psychological Well-Being: Meaning, Measurement, and Implications for Psychotherapy Research. Psychother Psychosomatics, 14-23.
Samman, E. (2007). Psychological and Subjective Wellbeing: A Proposal For Internationally Comparable Indicators. Oxford: OPHI Working Paper Series.
Santosa, P. B., & Ashari. (2005). Analisis Statistik dengan Microsoft Excel & SPSS. Yogyakarta: ANDI. Shea, T., & De Cieri, H. (2011). Workplace stress
evaluation tools: A Snapshot Review. Faculty of Business and Economics, Monash University. Singh, Y. K. (2006). Fundamental of Research
Methodology and Statistics. New Delhi: New Age International (P) Limited.
Siregar, S. (2014). Statistik Parametrik untuk Penelitian Kuantitatif. Jakarta: PT Bumi Aksara.
76 Stokols, (1996). Translating social ecological theory into
guidelines for community health promotion.
Americal Journal Health Promotion, 282-289. Supriyanto. (2009). Metodologi Riset Bisnis. Jakarta: PT
Indeks.
Teasdale, E. (2006). Workplace stress. Psychiatry, 251-254. Ulwan, M. N. (2015). Portal Statistik. Retrieved May 26, 2015, from Uji Normallitas dengan menggunakan SPSS (Normality Test): http://www.portal- statistik.com/2014/02/uji-normalitas-dengan-menggunakan-spss.html
Ursin, H., & Eriksen, H. (2004). The cognitive activation theory of stress. Psychoneuroendocrinology, 567-592.
Warr, P. (2012). How to Think About and Measure Psychological Well-being. Research Methods in Occupational Health Psychology.
Wright, T. A., & Cropanzano, R. (2000). Psychological well-being and job satisfaction as predictors of job performance. Journal of Occupational Health Psychology, 84-94.