Network Mapping of SME’s in Borobudur Cluster Using
Social Network Analysis for Strengthening Local
Economic Development Platform
Rudy LatuperissaFaculty of Information and Technology, Satya Wacana Christian University Salatiga, Central Java, Indonesia
Abstract
The Small and Medium Enterprise (SMEs) has a strategic role that could have a significant contribution in improving the prosperity of the society. The government has tried to empower SMEs through forming a forum in which those SMEs stakeholders could communicate to grow their businesses for economic community development. Whether the forum serves as it is supposed to be depends on several aspects. One of them is the network and how the network function to greatly contribute to development of the local economic. This study tries to map the SMEs network in Borobudur Cluster to know how they build the relation. Besides, it investigates the most influential actor in the network along with the media used for communication within the network. Finally, it tries to seek recommendation and strategies for strengthening Local Economic Development platform, which indirectly affects the economic development in a broader sense. This qualitative study employs survey and interview to actors in the network in order to collect the data needed. The network is mapped using NETDRAW and UCINET 6.0. The result of the study shows that the most influential actor in the network plays an important role in disseminating any information needed for the forum in order to develop. After the most influential actor and most frequently media-used are identified, some recommendations and strategies are suggested for further consideration of the stakeholders in the network.
Keywords: strategy, SNA, Mapping, SMEs, network
1.
Introduction
One realization of government policies in economic aspects is developing the Small and Medium Enterprise (SMEs here after). SMEs have a strategic role for a significant contribution to the prosperity of the society. In Central Java, the government has decided to form a forum that is expected to facilitate and serve as a place for those SMEs to interact and communicate among themselves. This forum is one of one of local economic development programs carried out in Central Java. This forum is a way
of institutionalizing of local economic development. The forum covers certain area in which all SMEs have access to information and facilities in order to improve their competitiveness power and marketing access. One model adopted by this local economic development forum is involving SMEs with multi stake holders.
In central Java, this local economic development platform is not yet robust; therefore it is needed to be strengthened through various effort. One of the efforts could be carried out by empowering SMEs clusters to serve optimally and effectively in supporting the growth of local economic development. Cluster model is a synergy between various businesses involving SMEs with the support of many industries and all related institution (Anon, 2007). The implementation of local economic development program still needs to improve its performance in order to function effectively in contributing to the economic growth of the society in general.
One of the clusters that is part of Central Java local economic development is Borobudur Cluster. This cluster comprises of various SMEs with their product ranging from services to various handicraft. This study will attempt to map the SMEs network in Borobudur Cluster to know how they build the relation. This will identify what kind of ties formed by the actors in the network. Besides, it investigates the most influential actor in the network along with the media used for communication within the network. This identification will help a lot in developing the network to be effective and efficient in their communication strategy to achieve their goal. Finally, it tries to seek recommendation and strategies for strengthening Local Economic Development platform, which indirectly affects the economic development in a broader sense.
2.
Social Network and Social Network
Analysis
direct influences to ways of thinking, conveying ideas either in web development or in other network structures. It then becomes a field that is multidisciplinary-researched for it could be applicable in many other fields.
Daly & Haahr (2007) maintains that there is a network and social network in the society. Social network could be seen as a small world phenomenon that comes from the observation of individuals often connected by short acquaintance. Those relationship chains come together forming a complex social network.
One method to analyze a network is Social Network Analysis (SNA). SNA is mathematics- based and could be implemented in many fields such as Computer Science, Geography, Information Science, Psychology, Biology, and many more (Otte & Rosseau 2002; Carrington, Scott & Wasserman 2005) SNA has been developed to understand the ties or edge of the actors or nodes in a system. It usually has two focuses, which are actors or node (points) and ties or relationships. Those focuses help the understanding toward the position of an actor could possibly influence any access to the available resources such as goods, capital and information. This reflects that the economic activities could be associated with social structure which finally leads to the capital social concept(Serrat, 2009)
Serrat (2009) mentions that the purpose of SNA is to visualize the ties or relationships between different actors in a particular place or context. The visualization could be then used for:
1. Identify any individual, group or unit holding the main role
2. Distinguish information breakdown, bottleneck, structural holes and isolated individual, group or units.
3. Use the opportunity to accelerate the knowledge flow either functionally or organizationally. 4. Raising the awareness and reflection toward the
importance of informal network to improve the performance of organization.
5. Strengthening the efficiency and effectiveness of existing formal communication channel
6. Increasing the support between actors in the organization through ties developed in the network.
7. Improving the innovation and learning for all organization members.
8. Finding new strategies to implement for achieving the objective of the organization .
Burt (2004) introduces the concept of structural holes in order to understand a social network and the possibilities that actors could be connected from one to each other. Thus, there will be actors with strong tie and those who
have limited access to the information in that network. Structural holes happen in the society because of actors focusing on their own activity and creating hole of information flow between groups. These absent ties are often called as weak ties. This reveals that structural holes could exist in any network regardless of the size of the network.
Besides, actors near the holes (weak ties) have big potential to come up with good ideas as the opinion and behavior of the actors are homogenous (Burt, 2004). This phenomenon happens because there is a close tie or relationship between the connected actors in groups with different kinds of thinking. These could give them chances to choose and synthesize. New ideas come up from the choices and synthesis in the structural holes group. In this paradigm, groups in the structural holes are the ones who have advantageous position since they could function as the bridge for those unconnected actors. This position is advantageous in a sense that they have the information or opportunities as part of the society in the weak ties. In line with that, Granovetter proposes a theory of the “strength of weak ties”. This structural holes guide and lead to the concept of social capital . Social capital could emerge where actors are in the structural holes network.
2.1 Centrality and Power
Sociologists say that power is a fundamental property of a social structure. Adam defines power as capability of someone or social unit to influence behavior or decision making through controls [1]. Power in social network could be seen as a micro property (ties between actors) or macro property (describe the whole population). Network analysts usually describe that an actor of a network could be an obstacle or could give opportunities for other actors. Actors having fewer obstacles and more opportunities usually will have advantageous structural position. Thus, those actors would be the focus and get more attention from the group compared to actors with less advantageous position.
2.2. Measurement Terminologies in SNA
In social network analysis, there are some common and often used terminologies, they are:
Density and Eigenvector
Density is the proportion of all ties found in a network. By using this density measurement, it could obtain the information on the number of ties sent or received by actors in the network. In order to see the power of ties might happen in the network could be obtained by calculating the mean and sum of the ties of the actors in a network.
Eigenvector approach is an effort to find out the most central actor in the whole network. Meanwhile, eigenvalue explains the location of each actor in each dimension as well as the global distance pattern of the ties. Eigenvector comprises of collection of eigenvalue. Eigenvector investigates the global distance between actors in one dimension or ties pattern. [6]
Centrality and Power
Centrality is a measurement to show how importance is an actor in a network. The implication of an actor being the central is an actor having strong capability to connect to other actors in the network. In general, to measure the role and influence of an actor could be obtained by looking at three measurement terminologies; Degree Centrality, Closeness Centrality, and Betweeness Centrality. The mathematical formulas for calculating them can be found in [6].
Degree Centrality is the degree and position of an actor in a social network. There are two kinds of degree centrality; they are:
In degree: actor with high in degree point shows that he/she is a prominent actor because there are many actors will make an effort to send ties to him/her.
Out degree: actor with high out degree point implies that the actor is an influential actor. This shows his/her capability to exchange information with other actors and they acknowledge his views and ideas.
Closeness centrality is a measure of how far the information can spread from one to another actor. Besides, Closeness Centrality could show the distance between an actor to the others in a particular network. The higher the closeness centrality point, the easier for the actor to spread the information in a network. On the other hand, the lower the closeness centrality point, the more difficult to spread the information to other actors in a network.
Betweenness centrality, is a measurement of how far an actor could control the information flow between actors in that particular network. The high point of Betweeness centrality shows that the actor has a big capacity to facilitate the interaction of the connected actors. Apart from that, Betweeness centrality could be used to measure how well an actor could facilitate the communication with other actors in a network.
3. Information and Communication Media
Interaction between nodes in a social network enables the data, information and knowledge transfer. This transfer processes need an effective communication media for specific purposes. Communication process could be seen as a pipe in which information and meaning is transferred from one to another.
Choosing the right communication media is an important component in an effective communication process. There is a contingency model designed to help the decision makers to choose the effective communication media. This choice is based on the interaction of the wealth of information the complexity of the problem or situation. In choosing an effective communication media based on the wealth of information is determined by four factors; i.e. feedback, channel, type of communication and language source. [7] The category of channel and media communication used implies the level of wealth of information
4. Methodology
This section discusses how the research is carried out. It includes the object and research sample. Besides, it talks about the instruments used for data collection and how the collected data analyzed.
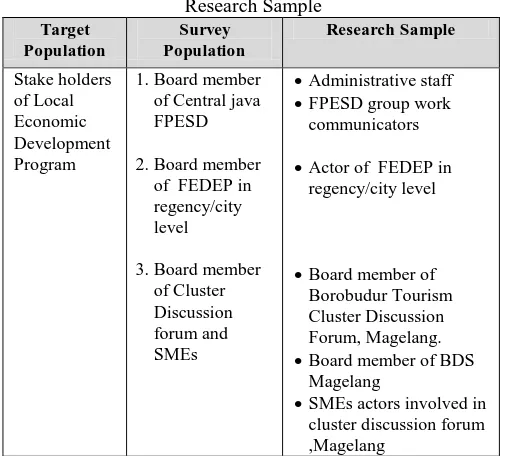
In social network mapping for local economic development program in central java, there are several stakeholders involved as the object of the research. Based on the platform level of the institution in this program, this research uses research objects as its target population. Data purposive sampling is applied in this research. However in taking the sample, it still sees and considers the representativeness of population element. The list of population and sample could be seen in Table 1.
This research belongs to a survey research. This uses questionnaires and interview for data collection.
Both the questionnaire and guided interview are implemented in different time, which result different data although they involve the same respondents.
verified through the data obtained at interview. Besides, it is also to avoid data redundancy. [5]
This research uses Full Network Method to obtain data. This approach is one of the four methods usually implemented in Social Analysis Network [6]. The data collected are the information about the actors. This approach conducts a census in the actor population. Full Network data enables getting a strong description and social structure.
Data processing and analysis is done using UCINET 6.0 and Netdraw developed by Borgatti. UCINET is used to form interaction matrices between nodes and their attributes, while Netdraw is used to visualize them. Netdraw also provides the analysis to see the role of the actor in a network.
Table 1: Target, Survey Population and Research Sample
Target Population
Survey Population
Research Sample
Stake holders of Local Economic Development Program
1. Board member of Central java FPESD
2. Board member of FEDEP in regency/city level
3. Board member of Cluster Discussion forum and SMEs
Administrative staff
FPESD group work communicators
Actor of FEDEP in regency/city level
Board member of Borobudur Tourism Cluster Discussion Forum, Magelang.
Board member of BDS Magelang
SMEs actors involved in cluster discussion forum ,Magelang
Table 2 : Composition of Respondents
Source:Processed Questionnaire and interview data
All of the respondents are the stakeholders of local economic development from various level of institution platform. They are also SMEs and BDS which are in affiliation with Tourism Cluster Discussion Forum (Forum Rembug Klaster (FRK)) Borobudur, Magelang. They are ranging from 25 to 50 years old. The detail composition of respondents is shown in Table 2.
5.
Analysis and Discussion
This section describes the analysis of the collected data. It also presents discussion about the result of the study. 5.1 Social Network Mapping Form and Ties Built by The Actors
Based on the data processing using UCINET and Netdraw, the visualization of the social network and its statistic description of the actors could be seen in the following figure.
Fig. 1
Sociogram of 39 actors in local economic development program in Central Java.
Institution Platform Level
Number of Respondents Province: FPESD 14 respondents comprise of :
7 administrative staffs ;
4 group work ‘linker’ ; 3 Experts
City/Regency: FEDEP
7 FEDEP staffs from several regency
Production Area:
BDS, Cluster Discussion Forum and SMEs
18 respondents, comprise of :
5 board members of cluster discussion forum
12 SMEs owner ;
1 board member BDS.
Density
There are 130 ties exist in the network which could be seen from the Sum Coefficient in Univariate Statistics of Density matrix. The possible ties sent or received from all actors is 1482 ties (from 39*39-1 or from N of Obs). The mean of the ties is 8,8% which is under 50%, along with the significant difference from the ties made and the maximum number of ties might take place then it could be implied that ties between actors are weak. It is common to call it as weak ties.
Based the same analysis, actor with the highest point on eigenvector is actor Basiyo; eigenvec 0,385. Thus, the central actor in the whole network is actor Basiyo. Other central actors that could be identified in the network are actor #12and #18with eigenvec 0,379 and 0,376.
The highest eigenvalue from the factor analysis is 5,778 and 22, 2% of percentage pattern. This reflects that 22.2% of the ties have the dimension or global pattern distance to the network of 5,778. The dimension or local pattern distance of the network is 3,170 with percentage pattern of 12, 2%. Further pattern will be a more local pattern.
5.2 Centrality or Prominent Actor in The Network
Degree Centrality
Actor #18and #8 have the highest out-degree point i.e. 9. This indicates that both actors are the prominent actors in the network. 9 point means that they pass the information to 9 other actors. They are the prominent actors because they have the capability and willingness to exchange information. These two actors are connected by actor named #22with the highest in-degree point; 13. Thus those three actors are important actors in the network as they are the channel for information exchange.
When it comes to the highest in-degree point then it is #22with 13 points. This is the central or focus actor as well as prominent actor. It indicates that many other actors try to send or receive ties from him. The 13 points means that this actor receives information form 13 other actors.
The average of out-degree and in-degree points of actors in this network is quite low; it is: 3, 33. This reveals that each actor sends and receives ties to and from 3 actors based on the total number of actors in the network.
In addition to know the heterogeneity of the structural position population of a network could be identified by the variance of its out-degree and in-degree. The variance could be calculated by dividing Std Dev with Mean times 100 ([Std Dev/Mean]*100). The out-degree variance of the network is 67 (from (2.246 / 3.333)*100). Meanwhile the in-degree variance is 94 (from (3.157 / 3.333)*100). From the out-degree and in-degree variance, which are 67 and 94, it clearly shows that there is a high heterogeneity in the
structural position in the network because the value is more than 50 and almost 100.
The tendency of actors whether they have the ability to generally influence the network can be identified from the out-degree and in-degree network centralization. The out-degree network centralization is 15.30% and the in-degree network centralization is 36.10%. These points indicate that the network centralization is pretty low; it is less than 50%. This also shows that the power of each actor in the network is not varied. Each of them does not have enough ability and power to influence the whole network in general.
Closeness Centrality
Based on the result of Closeness Centrality measurement (See table 8), the highest in-closeness point is 22.33 (actor #12). Thus, this actor is easier to spread information to other actors in the network compared to others. Compared to the in-closeness Mean which is 11.942, shows that actor #12receives information twice more than the average of the actors in the network. In addition, he also gets high network in-centralization; 56.89%. This shows that the information centralization is quite high. Actor #12 is the actor that has the high degree of easiness to spread or send information to other as well as being the important source of information in the network.
Betweeness Centrality
This network has a high variance of betweeness among its actors, it is 0 – 461.5 (see Table 9). The betweeness centrality point is >1 (Standard Dev/Mean; 104.27/59.35).This indicates the big possibility of an actor to be in a pair of connected actors. This also shows that most of the ties could be made without any intermediary.
The low Network Centralization Index; 29.36%, shows that structurally there is no big power in the network. Actors # 12, #10, #18 and #22seem to have structural power to be the communication facilitator in the network. Those four actors are also structurally different from the population. They could be considered as dealmaker. Although the betweeness power in this network is no so big, this information is still important for forming and stratifying the group.
5.3 Media Of Communication In Network
The role of information channel is as a representative of media of communication. The analysis using 2-mode network Degree Centrality has given information on how far the information channel has worked.
The information channel often used in this network is audio-visual. The highest degree point of both channels is 0.872. It implies that the most central information channel in the network is audio visual. The second central channel is audio with degree point of 0.821. Meanwhile, it shows that limited audio and visual channels are the two channels that are rarely used. Seeing the point of each analysis either degree, closeness, betweeness or eigenvector, audio visual ranks the highest in the whole network as the main channel and limited audio channel is the one with the lowest centrality point showing that it is rarely used in the network.
Based on the channels, the communication created regarding the information transfer is largely done face to face, through workshop, seminar, or meeting. These methods as explained in the contingency model are media with wealth of information. Thus the information transfer is quite effective in a sense that compared to the complexity of the problem in the program; the media used has the channel with high data capacity as suggested by Kreitner and Kinicki.
6.
Strategy Offered for Strenghtening Local
Economic Development Platform
Having the assumption that information entity is an opportunity to improve performance, then it is important to facilitate all the SMES to get the important information so that they could improve their performance. The result of the research shows that #18is the central actor and able to be communication facilitator. Therefore, it is important to shorten the distance of information connectedness between the SMEs and the chair of the discussion forum so that it could contribute in improving their performance.
In addition, the ties between actors in the network tend to have the weak ones. However, this could be seen as strength (the strength of weak ties) as the majority of the information could be passed through society with weak ties. Nevertheless, this needs to pay attention to the media and channel used for interaction between actors.
The other things need to be taken into account is the information channel and communication media used especially the ones having wealth of information with its data capacity. Most of the media used in the local economic development program are effective enough as they have the wealth of information. Needless to say, the information channel and media are important factors that could contribute in achieving the objectives of the local
economic development program. In the long run, the use of media needs to consider about the effectiveness as well as the efficiency. The use of IT-based channel and media could be a thoughtful idea especially to pass on information massively.
7.
Conclusion
Based on the result of analysis and discussion it could be concluded that the ties made in the social network of local economic development program are weak. Then, it is less than a quarter of the whole dimension of the ties take place in the network having considered the dimension or the global connectedness distance between actors in the network.
The prominent actors in the network are potentially being very prominent actors as they have the capability and willingness to exchange information. Besides that, central actor could serve as the easiest actor to reach and spread the information to other actors.
The central channel used for exchanging information in this network is audiovisual. It uses face-to-face media such as workshop, meeting, and seminar. This network proves to be effective in choosing the channel based on the problem complexity in local economic development program that needs communication media with wealth of information.
Based on the mapping done using social network analysis, then it can construct a strategy for the social network of local economic development program. The suggested strategy considering the low influence of the actors in the network and its media are as follows; firstly, it needs to improve the intensity and frequency of the ties of all the stakeholders in the network. Secondly, considering the weak ties in the network, it needs to optimize the roles of the central actors in the network. The central actor should be empowered to be the facilitator of the network in various institution platforms. Lastly, regarding the use of media and channel of communication, it should start to consider the use of information technology so that it could be more effective to achieve the goals or objectives set in the network.
Acknowledgment
This research is funded by the research grant from Faculty of Information Technology, Satya Wacana Christian University, Salatiga, Indonesia.
References
[1] Agusyanto, Ruddy, 2010. Fenomena Dunia Mengecil – Rahasia Jaringan Sosial. Institute Antropologi Indonesia.
[3] Carrington, P., Scott, J. & Wasserman, S., 2005. Models and Methods in Social Network Analysis. New York: Cambridge University Press
[4] Daly & Haahr., 2007. Social Network Analysis for Routing in Disconnected Delay-Tolerant, MANETs ACM 978-1-59593-684-/07/0009
[5] Danim, Sudarwan, 2004. Metode Penelitian Untuk Ilmu-ilmu Perilaku, Bumi Aksara, Jakarta.
[6] Hanneman, Robert,A.and Mark
Riddle. 2005. Introduction to social network methods. Riverside, CA: University of California, Riverside(published in digital form at
http://faculty.ucr.edu/~hanneman/)
[7] Kreitnet, R., and Kinicki, A., 2005. Organizational Behavior McGraw-Hill.
[8] Otte, E. dan Rousseau, R., 2002. Social network analysis: a powerful strategy, also for the information sciences. Journal of Information Science, 28 (6) pp. 441–453.
[9] Serrat, Olivier, 2009. Social Network Analysis, Knowledge Solutions. Asian Development Bank (ADB).
[10] Wijaya, Holi, B.; Bening, D.P.; Artiningsih, 2011, Pengembangan Ekonomi Lokal Jawa Tengah, Materi Presentasi Workshop PEL. Semarang.