kang
INDO
BALA
REPO
FIRST QU
ONES
ANC
ORT
UARTER 2
SIA’S
E OF
2010
S
PAY
YMEN
NTS
Contact Address:
Balance of Payments Bureau
Directorate of Economic and Monetary Statistics Bank Indonesia
Sjafruddin Prawiranegara Tower, 16th Floor Jl. M.H. Thamrin No. 2
Jakarta 10350
Phone : (021) 3817088
Fax : (021) 3800134
E-mail : [email protected]
INDONESIA’S
BALANCE OF PAYMENTS
REPORT
FIRST QUARTER 2010
SUMMARY ……… 1
INDONESIA’S BALANCE OF PAYMENTS IN Q1/2010, AND ITS CONTRIBUTING FACTORS ……… 3
CURRENT ACCOUNT 1. Non-Oil and Gas Trade Balance ……… 5
1.1. Non-Oil and Gas Exports ……… 6
1.2. Non-Oil and Gas Imports ……… 11
2. Oil and Gas Trade Balance ……… 13
2.1. Oil ……… 13
2.2. Gas ……… 14
3. Services Account ……… 15
4. Income Account ……… 16
5. Current Transfers ……… 17
CAPITAL AND FINANCIAL ACCOUNT 1. Capital Account ……… 19
2. Financial Account ……… 19
2.1. Public Sector ……… 20
2.2. Private Sector ……… 25
RESERVE ASSETS ……… 29
INDICATORS OF EXTERNAL SUSTAINABILITY ……… 31
LIST OF TABLES
Page Page
Table 1 Indonesia’s Balance of Payments and Several Economic Indicators in Q1/2010
4 Table 16 Imports of Non-Oil and Gas Based on Major Countries of Origin (C&F)
11
Table 2 Growth of Non-Oil and Gas Exports by Sector 6 Table 17 Imports of Consumption Goods Based on Major Countries of Origin (C&F)
12
Table 3 Exports to Major Destination Countries 6 Table 18 Imports of Raw Material Based on Major Coutries of Origin (C&F)
12
Table 4 GDP Growth (%, yoy) of Several Non-Oil and Gas Export Destination Countries
6 Table 19 Imports of Capital Goods Based on Major Countries of Origin (C&F)
13
Table 5 Export Growth of Major Non-Oil and Gas Commodities
7 Table 20 Oil Trade Balance 13
Table 6 Rubber Exports to Several Major Countries of Destination
7 Table 21 Demand and Supply of World Oil 14
Table 7 Coal Exports to Major Countries of Destination
8 Table 22 Gas Trade Balance 15
Table 8 Exports of TTP to Several Major Countries of Destination
8 Table 23 Non Investment Grant 18
Table 9 Exports of Machinery and Mechanical Appliances to Several Major Countries of Destination
8 Table 24 Investment Grant 19
Table 10 Copper Exports to Several Major Countries of Destination
9 Table 25 Indonesia’s Sovereign Rating 20
Table 11 CPO Exports to Major Countries of Destination
9 Table 26 Government Program Loan Position by Major Creditors
23
Table 12 Exports of Chemical Products to Major Countries of Destination
10 Table 27 Government Project Loan Position by Major Creditors
24
Table 13 Electronic Exports to Major Countries of Destination
10 Table 28 Government Foreign Loan Position by Major Creditors
24
Table 14 Paper Exports to Major Countries of Destination
11 Table 29 Government Foreign Loan Position by Major Currencies
24
Table 15 Imports of Non-Oil and Gas Based on Types of Goods (C&F)
LIST OF CHARTS
Page Page
Chart 1 Current Account 5 Chart 18 BI Rate and Fed Fund Rate 21
Chart 2 Non-Oil and Gas Trade Balance 6 Chart 19 SBI Rate 21
Chart 3 World Rubber Price 7 Chart 20 SUN & SBI Owned by Foreign Investors 22
Chart 4 World Coal Price 7 Chart 21 Disbursement and Repayment of
Government Loan
22
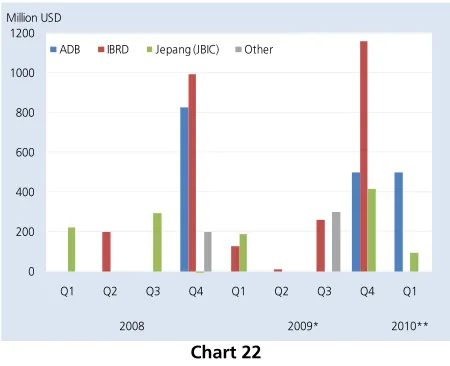
Chart 5 World Copper Price 9 Chart 22 Program Loan Disbursement 23
Chart 6 World CPO Price 10 Chart 23 Project Loan Disbursement 23
Chart 7 Economic Growth and Non-Oil and Gas Imports
11 Chart 24 Government Foreign Loan Position 24
Chart 8 World Oil Prices 14 Chart 25 Financial Account of Private Sector 25
Chart 9 Fuel Consumption 14 Chart 26 Foreign Direct Investment 26
Chart 10 Services Account 15 Chart 27 Foreign Direct Investment (net) based on Country of Origin
26
Chart 11 Travel Services 15 Chart 28 Foreign Direct Investment (net) based on Economic Sector
26
Chart 12 Income Account 16 Chart 29 Oil and Gas Foreign Direct Investment (Net) 27
Chart 13 Workers’ Remittances 17 Chart 30 Non-Oil and Gas Foreign Direct Investment 27
Chart 14 Capital and Financial Account 19 Chart 31 Foreign Transaction in Indonesia Stock Exchange and Indonesia Stock Index
28
Chart 15 Growth of Capital and Financial Account by Sector
20 Chart 32 Loan Disbursement and Repayment of Private Sector
28
Chart 16 Financial Account of Public Sector 20 Chart 33 Reserves Assets 29
SUMMARY
In the first quarter of 2010, Indonesia's balance of payments charted yet another surplus at a robust USD6.6
billion, marking significant improvement over the Q4/2009 surplus recorded at USD4.0 billion. Key to the upbeat
performance in the balance of payments was both surpluses in the current account and the capital and financial
account. In response, international reserves at end-Q1/2010 mounted to USD71.8 billion, equivalent to 5.7 months
of imports and official external debt service payments.
In Q1/2010, the current account registered a USD1.6 billion surplus, down from the Q4/2009 surplus at
USD3.6 billion. The reduced current account surplus is explained primarily by a downturn in the balance of trade
caused by rising imports of oil and gas as well as non-oil and gas. Surging non-oil and gas imports were reflected
not only in consumer goods, but also in increasing imports of raw materials and capital goods in support of growing
domestic production and investment. At the same time, oil imports also climbed in response to accelerated domestic
economic activity. On the other hand, non-oil and gas exports grew ahead of initial expectations on the improved
recovery in the world economy led by vibrant economic growth at the regional level. However, growth in non-oil
and gas exports (35.5%, yoy) fell short of the steep rise in non-oil and gas imports (44.5%, yoy). Even so, the
current account still managed a respectable surplus, bolstered in part by the reduction in the services deficit related
to lower overseas travel by Indonesians, which had soared in the preceding quarter due to the hajj pilgrimage
season.
In Q1/2010, the capital and financial account registered a USD4.3 billion surplus, up significantly from the
Q4/2009 surplus of USD1.3 billion. Key to this increased surplus was more vigorous performance in direct
investment and portfolio investments. Direct investment climbed mainly in response to the more conducive
investment climate, improved macroeconomic conditions and government measures to streamline procedures for
foreign investors in Indonesia. Improved global liquidity conditions and relatively attractive yield fueled inflows of
foreign portfolio capital and contributed to the successful issuance of government’s foreign currency bonds. Added
boost for the capital and financial account surplus came from a comparatively high draw down of private sector
external borrowings in response to improved access for Indonesian companies to financing sources on international
financial markets.
The global economic recovery, mainly the rapid growth of Asian region, contributed to the improvement in
Indonesia’s balance of payments in Q1/2010 that recorded a USD6.6 billion surplus, higher than the USD4.0 billion
surplus in Q4/2009. This positive performance was bolstered by current account surplus of USD1.6 billion and capital
and financial accounts surplus of USD4.3 billion. This conducive economic condition contributed to the upward
trend of non oil-gas export. On the other side, the increasing domestic demand as reflected from high economic
growth and the rising need of imported-base export raw material led import to grow higher than export.
Consequently, current account recorded a lower surplus compared to the preceding quarter. This surplus, however,
was still relatively high due to the reduction in the services and income account deficits.
The contracted surplus of current account was compensated by capital and financial accounts that
experiencing a higher surplus compared to the previous quarter due to the support of portfolio and direct
investments performance. In Q1/2010, the relatively stable domestic macroeconomic condition and the improved
liquidity condition in global market contributed to the mounting inflow of portfolio investment and direct
investment. In line with this development of Indonesia’s balance of payment, the amount of foreign reserves at the
end of the period (March 2010) rose to USD71.8 billion (USD66.1 billion in Q4/2009) or equivalent to 5.7 months of
imports and official debt service payments.
The following factors contributed to the Indonesia’s balance of payments during Q1/2010:
• World economy continued to accelerate and more distributed. China, being the main engine of Asian
economy, registered a 11.9% (y.o.y) economic growth. Improvement was also shown by several
macroeconomic indicators in several developed countries such as the US, Japan and European Union countries.
• The strengthening world demand accompanied by global economic recovery led to hike in prices of several
primary export commodities. Prices of commodities such as rubber, copper, coal and CPO experienced increases
while the unit price of crude oil export rose from USD73.1/barrel to USD75.2/barrel. Similar condition was also
reflected from the price of LNG.
• Indonesian GDP also improved from 5.4% to 5.7% (y.o.y) in the reporting period. Investment sector posted
more important contribution to GDP growth than consumption sector.
• Indonesian inflation at the end of March 2010 was recorded at 3.4%. The relatively maintained inflation
during the reporting period was attributed to the policy of Bank Indonesia to sustain BI rate at 6.5% since
mid-2009. This stable inflation contributed to the strengthening Rupiah exchange rate against USD from an average
rate of Rp9,473 (Q4/2009) to Rp9,254 (Q1/2010). The domestic inflation was also influenced by external factor
related to low inflation in several Indonesian trading partners.
• In Q1/2010, oil production reached 0.955 million barrels per day (mbpd), slightly higher than 0.951 mbpd in
the preceding quarter. Meanwhile, oil consumption contracted to 82.8 million barrel from 89.7 million barrel.
This drop was driven by seasonal factors such as a number of religious celebrations and end of year activities in
Q4/2009.
Table 1
Indonesia’s Balance of Payments and
Several Economic Indicators in Q1/2010
2010
Total Q1 Q2 Q3 Q4 Total Q1
WORLD ECONOMIC INDICATORS
Economic Growth
‐ United States of America % (y.o.y) 2.1 0.4 ‐3.3 ‐3.8 ‐2.6 0.1 ‐2.4 2.5
‐ Japan % (y.o.y) 3.5 ‐1.2 ‐8.9 ‐5.7 ‐5.2 ‐1.0 ‐5.2 n.a
‐ European Union % (y.o.y) 2.8 0.5 ‐5.0 ‐4.9 ‐4.1 ‐2.2 ‐4.1 0.5
‐ Singapore % (y.o.y) 8.5 1.8 ‐8.9 ‐1.7 1.8 3.8 ‐1.3 15.5
‐ China % (y.o.y) 12.1 9.1 6.2 7.9 9.1 10.7 8.5 11.9
World Price Commodity
‐ Crude Oil (OPEC) USD/barel 69.1 94.5 43.0 58.7 67.6 74.3 61.1 75.5
‐ Coal USD/metric ton 66 127 72 66 71 78 72 95
‐ Copper USD/metric ton 7,118 6,956 3,428 4,663 5,859 6,648 5,150 7,232
‐ CPO USD/ton 780 949 577 743 679 732 683 808
‐ Rubber cent USD/kg 248 284 166 187 221 285 215 345
International Interest Rates ¹⁾
‐ United States of America % (y.o.y) 5.1 2.1 0.25 0.25 0.25 0.25 0.30 0.25
‐ Japan % (y.o.y) 0.5 0.5 0.1 0.1 0.1 0.1 0.1 0.1
‐ European Union % (y.o.y) 3.9 3.9 1.8 1.1 1.0 1.1 1.3 0.0
‐ Singapore % (y.o.y) 2.7 1.3 0.7 0.7 0.7 0.7 0.7 0.7
‐ China % (y.o.y) 6.8 7.0 5.3 5.3 5.3 5.3 5.3 5.3
Inflation ²⁾
‐ United States of America % (y.o.y) 4.1 0.1 ‐0.4 ‐1.4 ‐1.3 2.7 2.7 ‐0.4
‐ Japan % (y.o.y) 0.7 0.4 ‐0.3 ‐1.8 ‐2.2 ‐1.7 ‐1.7 ‐0.3
‐ European Union % (y.o.y) 3.1 1.6 0.6 ‐0.1 ‐0.3 0.9 0.9 0.6
‐ Singapore % (y.o.y) 4.4 4.3 1.6 ‐0.5 ‐0.4 0.2 0.2 1.6
‐ China % (y.o.y) 6.5 1.2 ‐1.2 ‐1.7 ‐0.8 1.9 1.9 ‐1.2
DOMESTIC ECONOMIC INDICATORS
GDP % (y.o.y) 6.3 6.0 4.5 4.1 4.2 5.4 4.5 5.7
CPI Inflation ²⁾ % (y.o.y) 6.6 11.1 7.9 3.7 2.8 2.8 2.8 3.4
Exchange Rates ¹⁾ (Rp/USD) 9,140 9,700 11,631 10,531 10,002 9,473 10,395 9,254
Average Price of Crude Oil Export USD/barel 70.1 93.5 41.8 56.9 66.5 73.1 59.6 75.2
Oil Production mbpd 0.952 0.976 0.962 0.941 0.943 0.951 0.949 0.955
Fuel Consumption mbpy 382.8 381.4 80.7 84.5 88.3 89.7 343.1 82.8
Gas Export (LNG) mbtu 1,080 1,068 257 228 244 301 1,030 277
Gas Export Average Price (LNG) USD/mbtu 9.0 11.9 5.5 6.3 8.2 7.8 7.0 7.8
BI Rate 1) % (annual) 8.6 8.7 8.25 7.25 6.58 6.50 7.15 6.50
INDONESIAN BALANCE OF PAYMENTS
‐ Current Account million USD 10,492 126 2,508 2,480 2,157 3,602 10,746 1,554
‐ Capital and Financial Account million USD 3,593 ‐1,832 1,593 ‐1,822 2,507 1,270 3,548 4,297
‐ Total million USD 14,085 ‐1,706 4,101 658 4,664 4,872 14,294 5,851
‐ Net Errors and Omissions million USD ‐1,370 ‐239 ‐146 394 ‐1,118 ‐918 ‐1,788 770
‐ Overall Balance million USD 12,715 ‐1,945 3,955 1,052 3,546 3,954 12,506 6,621
‐ Foreign Exchange Reserves million USD 56,920 51,639 54,840 57,576 62,287 66,105 66,105 71,823
Source: CEIC, IMF, World Bank, Bank Indonesia, and other sources
¹⁾ an interest rate policy sets by central bank / monetary authority (calculated as the average monthly) ²⁾ end‐month position of the relevant quarter
In Q1/2010 current account posted a USD1.6
billion surplus, lower than the USD3.6 billion surplus in
the preceding quarter. This was mainly due to the
contracted surplus in non-oil & gas and oil & gas trade
balances.
Chart 1 Current Account
The decreased surplus in non-oil & gas trade
balance was related to the declining export value in the
midst of higher non-oil & gas imports compared to the
preceding quarter. These development of exports was
also due to seasonal factors occurring every first
quarter. The annual growth of exports, however, still
indicated a high increase (35.5%) compared to the
previous quarter (17.5%). Meanwhile, the non-oil & gas
imports jumped in response to the rising of domestic
economic growth and demand of raw materials for
exports. The surge in investment and production
activities were led to the rising import demand for
consumption goods, raw materials and capital goods.
On annual basis, the growth of non-oil and gas imports
exceeded the exports growth .
Oil & gas trade balance posted a contracted
surplus compared to Q4/2009, mainly due to the
increasing demand of oil imports in line with the
mounted economic growth and the decreased LNG
export volume pursuant to the transfer of gas
production to fulfill domestic demand.
Meanwhile, services balance deficit slightly
decreased due to the declining of Indonesian travelers
abroad that marked a sharp increase in the preceding
quarter due to seasonal factor such as hajj pilgrimage.
The downturn of income balance deficit was mainly due
to the decrease of government and private debt service
payments.
1. Non-Oil Gas Trade Balance
In Q1/2010 non-oil and gas trade balance recorded
a USD5.9 billion surplus, lower than the USD8.4 billion
surplus in Q4/2009. The declining surplus was
affected by export performance that recorded
a negative growth of 4.6% (q.t.q) which was presumed
due to seasonal pattern. In the contrary, non-oil and
gas imports grew positive 5.8% (q.t.q) in line with
the upward trend of investment and production
activities.
However, based on annual growth, non-oil
and gas exports still recorded an accelerated
growth compared to Q4/2009. Export growth of
non-oil and gas improved from 17.5% (y.o.y) in
Q4/2009 to 35.5% (y.o.y) in the reporting period.
Meanwhile, non-oil and gas imports experienced a
significant increase from -8.4% (y.o.y) to 44.5% (y.o.y)
in Q1/2010.
-5,000 -3,000 -1,000 1,000 3,000 5,000 7,000 9,000 11,000
Q.1 Q.2 Q.3 Q.4 Q.1 Q.2 Q.3 Q.4 Q.1 Q.2 Q.3 Q.4 Q.1
2007 2008 2009* 2010**
million USD
Chart 2
Non-Oil and Gas Trade Balance
1.1. Non-Oil and Gas Exports
In Q1/2010, non-oil and gas exports reached
USD27.8 billion, decreased by 4.6% (q.t.q) compared to
the previous quarter (USD29.1 billion). The weakening
performance of export value was related to mining and
manufacturing exports which declined by 4.2% and
-6.6% (q.t.q) respectively. Meanwhile exports in
agricultural sector still posted a positive growth of 5.4%
from the previous period.
Table 2
Growth of Non-Oil and Gas Exports by Sector
Although exports in mining and manufacturing
sectors declined from the previous quarter, all sectors
still posted positive annual growth. Agricultural sector
recorded a growth of 52.2% (y.o.y) far higher than
previous period (6.3%, y.o.y). Manufacturing sector
posted a growth of 29.1% (y.o.y), showed an
improvement compared to the preceding quarter
(7.6%, y.o.y). Meanwhile, mining sector grew by
50.1% (y.o.y), slower than the previous period (55.9%).
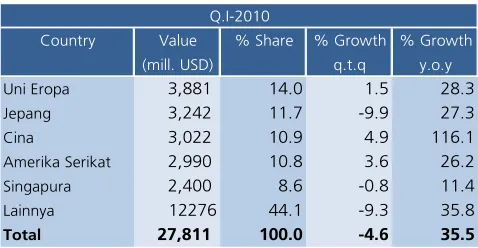
The declining of non-oil & gas exports was also
reflected from the export performance to several major
countries of destination, such as Japan (decreased by
9.9%, q.t.q) and Singapore (decreased by 0.8%, q.t.q).
On annual basis, however, export performance to major
countries of destination still recorded a positive growth
in line with the improving economic condition in
Europe, Asia and America.
Table 3
Exports to Major Destination Countries
The annual growth of exports was in line with the
prediction of improving economic activities in major
countries of destination during the reporting period
compared to previous year.
Table 4
GDP Growth (%, yoy) of
Several Non-Oil and Gas Export Destination Countries
Several commodities supporting the performance
of non-oil and gas exports in this period were: rubber,
coal, textile and textile products and machinery &
mechanic. The increased exports of those commodities
were partly supported by price factor (rubber, coal and
1,000 2,000 3,000 4,000 5,000 6,000 7,000 8,000 9,000 3,000 8,000 13,000 18,000 23,000 28,000 33,000 38,000
Q.1 Q.2 Q.3 Q.4 Q.1 Q.2 Q.3 Q.4 Q.1 Q.2 Q.3 Q.4 Q.1
2007 2008 2009* 2010**
million USD million USD
Exports Imports Non Oil & Gas Trade Balance (RHS)
Q4 Q1 Q4 Q1 Q4 Q1
Agriculture
Value 11.6 12.9 16.9 5.4 6.3 52.2
Volume 2.4 2.0 9.9 -18.4 12.9 25.5
Mining
Value 27.7 27.8 12.4 -4.2 55.9 50.1
Volume 83.5 87.6 15.3 2.8 53.2 89.9
Manufacturing
Value 59.6 58.3 13.6 -6.6 7.6 29.1
Volume 14.1 10.5 16.7 -27.6 14.3 -1.6
Total
Value 100.0 100.0 13.8 -4.6 17.5 35.5
Volume 100.0 100.0 15.3 -2.0 45.0 71.5 % Share % Growth % Growth
(q.t.q) (y.o.y)
Country Value % Share % Growth % Growth
(mill. USD) q.t.q y.o.y
Uni Eropa 3,881 14.0 1.5 28.3
Jepang 3,242 11.7 -9.9 27.3
Cina 3,022 10.9 4.9 116.1
Amerika Serikat 2,990 10.8 3.6 26.2
Singapura 2,400 8.6 -0.8 11.4
Lainnya 12276 44.1 -9.3 35.8
Total 27,811 100.0 -4.6 35.5
Q.I-2010
Singapore ‐9.5 ‐3.3 0.6 5.1 8.9
Japan ‐8.6 ‐6.0 ‐4.7 ‐1.2 2.6
China 6.1 7.9 8.9 10.4 11.1
USA ‐3.3 ‐3.8 ‐2.6 0.1 2.5
Euro Zone ‐5.0 ‐4.8 ‐4.1 ‐1.7 0.7
Source: Consensus Forecast *) provisional figures
2009 2010
machinery and mechanical appliances) and volume
(textile and textile products).
Table 5
Export Growth of Major Non-Oil and Gas Commodities
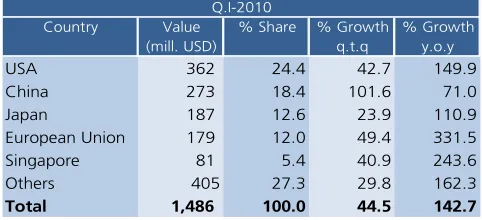
Rubber
Rubber exports in Q1/2010 reached USD1.5 billion
or grew by 44.5% from the preceding period. The
increase of rubber export value was contributed by the
rise of rubber price by 21.6%.
Rubber price in Q1/2010 reached USD346.1
cent/kg, higher than USD284.7 cent/kg in Q4/2009. The
rise in rubber price was supported by the increasing
rubber demand in line with the recovery of world
automotive industries. This increasing demand was also
reflected from export volume that grew by 8.5% from
the previous period. The rise in price was also triggered
by the limited rubber supply due to the high rainfall in
the producing countries (Indonesia, Malaysia and
Thailand).
Chart 3 World Rubber Price
On annual basis, rubber exports grew by 142.7%
in contradiction with the preceding period (-0.6%,
y.o.y). The main export destination were the United
States (share of 24.4%), China (18.4%) and Japan
(12.6%).
Table 6
Rubber Exports to Several Major Countries of Destination
Coal
Coal exports in Q1/2010 reached USD4.2 billion or
grew by 4.0% from the previous quarter. The
performance of coal exports was supported by the rise
in coal price during the reporting period. The coal price
reached USD95.2/MTon or rose by 22.6% from the
previous period (USD77.7 M/Ton). This condition was in
line with the strengthening world oil price that
ultimately pushed other commodity prices went up.
Chart 4 World Coal Price
On the other side, demand of coal also showed an
increase as reflected from the growth of exports volume
by 2.8% (q.t.q) from the preceding period. The demand
Q4 Q1 Q4 Q1 Q4 Q1 Q4 Q1 Q4 Q1 Q4 Q1
Rubber 4.2 3.0 0.5 0.5 26.4 44.5 ‐6.8 8.5 ‐0.6 142.7 8.9 20.4
Copper 3.4 7.7 0.7 0.7 23.7‐10.5 13.3 ‐9.7 215.6 50.2 141.8 ‐1.7
Coal 12.6 12.4 69.2 72.7 8.1 4.0 11.7 2.8 29.0 64.6 50.3 124.5
CPO 11.7 8.2 0.1 0.0 29.6‐35.6 26.1‐42.1 20.9 34.3 12.6 ‐6.5
Chemical Product 6.0 6.0 2.4 1.9 17.6 ‐2.0 22.3‐22.4 28.7 52.4 49.0 21.0
Electrical Appl. 10.3 9.8 0.2 0.2 4.2 ‐4.0 9.3 ‐3.4 16.2 41.7 20.3 43.6
Paper 4.3 4.7 1.7 1.6 19.8 ‐2.9 15.5 ‐8.3 15.9 24.0 13.3 ‐4.0
Mach. & Mechanic 8.7 7.5 0.3 0.3 11.5 7.2 52.0 ‐6.5 ‐24.9 13.5 ‐45.6 1.2
Nickel 1.5 1.0 3.5 4.1‐15.2‐57.8 11.5 14.5 16.8‐13.0 127.6 273.3
Textile & Tex. Prod 9.3 10.9 0.5 0.5 ‐0.8 8.1 7.4 4.1 6.0 18.7 24.3 23.5
Share (%) % Growth (q.t.q) % Growth (y.o.y)
Value Volume Value Volume Value Volume
0 50 100 150 200 250 300 350 400
Q1 Q2 Q3 Q4 Q1 Q2 Q3 Q4 Q1 Q2 Q3 Q4 Q1
2007 2008 2009 2010
c/kg
Country Value % Share % Growth % Growth
(mill. USD) q.t.q y.o.y
USA 362 24.4 42.7 149.9
China 273 18.4 101.6 71.0
Japan 187 12.6 23.9 110.9
European Union 179 12.0 49.4 331.5
Singapore 81 5.4 40.9 243.6
Others 405 27.3 29.8 162.3
Total 1,486 100.0 44.5 142.7
Q.I-2010 0 20 40 60 80 100 120 140 160 180
Q1 Q2 Q3 Q4 Q1 Q2 Q3 Q4 Q1 Q2 Q3 Q4 Q1
2007 2008 2009 2010
for Indonesia’s coal mainly came from China (share
28.1%), Japan (15.4%) and South Korea (13.3%). On
annual basis, coal exports jumped from 29% (y.o.y) in
Q4/2009 to 64.6% (y.o.y) in the reporting period.
Table 7
Coal Exports to Several Major Countries of Destination
Textile and Textile Product
Textile and Textile Product (TTP) exports started to
show a positive growth. In Q1/2010, TTP exports
reached USD2.6 billion or grew by 8.1% from the
preceding period. This growth was sustained by the
export volume increased by 4.1% (q.t.q). The improving
economic condition of developed countries was
presumed sustaining the performance of TTP exports, as
reflected in the exports to the United States and
European Union with market shares of 38.9% and
16.5% respectively.
Table 8
Exports of TTP to Several Major Countries of Destination
The improved TTP export performance was also
shown on its annual growth which rose from 6.0%
(y.o.y) in Q4/2009 to 18.7% (y.o.y) in the reporting
quarter.
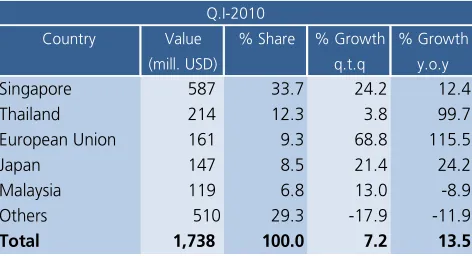
Machinery and Mechanical Appliances
Exports of machinery & mechanical appliances in
Q1/2010 reached USD1.7 billion, grew by 7.2% from
the preceding period (USD1.6 billion). The main export
destinations were Singapore, Thailand and European
Union, with market shares of 33.7%, 12.3% and 9.3%
respectively.
Table 9
Exports of Machinery and Mechanic to Several Major Countries of Destination
Machinery and mechanical appliances exports
showed a significant improvement compared to the
same period in the previous year. In Q1/2010,
machinery and mechanical appliances exports climbed
by 13.5% (y.o.y) in contradiction with the preceding
period (-24%, y.o.y).
Meanwhile, despite the positive annual growth,
several major commodities experienced slowing
performance on quarterly basis such as: copper, CPO,
chemical products, electronic and paper. The
decreased export performance of those commodities
due to seasonal factor.
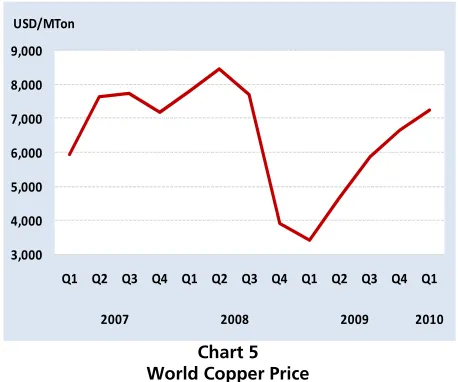
Copper
In Q1/2010, copper exports reached USD2.4 billion
or decreased by 10.5% from the previous quarter. The
declining was triggered by the diminish of export
volume by 9.7% as related to declining exports to
several importing countries such as South Korea and
Japan with a downturn of 41.4% (q.t.q) and 21.1%
(q.t.q) respectively.
Country Value % Share % Growth % Growth
(mill. USD) q.t.q y.o.y
USA 1,176 28.1 12.3 1185.1
European Union 644 15.4 24.6 35.8
Japan 557 13.3 14.4 82.2
South Korea 496 11.9 10.3 -8.2
China 338 8.1 -22.1 0.6
Others 969 23.2 -10.6 22.3
Total 4,179 100.0 4.0 64.6
Q.I-2010
Country Value % Share % Growth % Growth
(mill. USD) q.t.q y.o.y
USA 1,029 38.9 14.2 16.7
European Union 435 16.5 -1.7 5.8
Japan 144 5.4 5.2 26.1
South Korea 107 4.1 13.8 63.4
China 63 2.4 11.9 47.5
Others 867 32.8 6.2 21.5
Total 2,646 100.0 8.1 18.7
Q.I-2010
Country Value % Share % Growth % Growth
(mill. USD) q.t.q y.o.y
Singapore 587 33.7 24.2 12.4
Thailand 214 12.3 3.8 99.7
European Union 161 9.3 68.8 115.5
Japan 147 8.5 21.4 24.2
Malaysia 119 6.8 13.0 -8.9
Others 510 29.3 -17.9 -11.9
Total 1,738 100.0 7.2 13.5
Table 10
Copper Exports to Several Major Countries of Destination
On annual basis, however, copper exports still
posted a positive growth albeit in lower magnitude than
the preceding period, from 215.6% (y.o.y) in Q4/2009
to 50.2% (y.o.y) in the reporting period.
Chart 5 World Copper Price
The copper price rose by 8.8% to USD7,232/MTon
compared to USD6,648/MTon in the preceding quarter.
The increasing price was contributed by the rising
demand from Asia, mainly from China. Although
China’s consumption on copper this year is projected to
reach 39% of total world copper consumption (about
18 million tons), China had not been included as major
destination countries for Indonesia copper exports.
China utilizes copper to back the construction industry,
energy infrastructure development and other industrial
activities.
CPO
After reaching its peak in September-October last
year, in line with the CPO production cycle, the
production of CPO in the beginning of the year became
lower. As a result, the value of exports of CPO also
decreased 35.6% (q.t.q) to USD2.3 billion from the
previous period (USD3.5 billion). Nevertheless,
compared to the same period in the previous year, CPO
exports continued to improve, with growth in Q1/2010
reached 34.3% (y.o.y), higher than the previous period
(20.9%, y.o.y).
The weakening exports performance in the
reporting period compared to previous periods occurred
in almost all major destination countries, such as
India, European Union, and China. Besides the declining
in CPO production as cyclical factor, the decrease of
CPO exports to the European region was related to the
negative campaign on Indonesian CPO regarding
the issues of land clearing and environmental
degradation.
Table 11
CPO Exports to Major Countries of Destination
Although the export volume decreased
compared to the previous quarter, CPO price
rose by 10.3% (q.t.q) which sustained the downturn
of export value. In this period, CPO price elevated
to USD808/Mton from USD732/Mton in Q4/2009,
driven by increased demand from India and China.
CPO consumption in both countries was estimated
to reach 7.3 million tons (India) and 750 thousand
tons (China). Currently, Indonesia has controlled
Country Value % Share % Growth % Growth
(mill. USD) q.t.q y.o.y
Japan 693 29.3 -21.1 40.3
European Union 367 15.5 151.8 36.0
South Korea 348 14.7 -41.4 93.6
India 249 10.5 13.3 58.7
Malaysia 230 9.7 20.9 331.2
Others 477 20.2 -22.1 13.5
Total 2,363 100.0 -10.5 50.2
Q.I-2010
3,000 4,000 5,000 6,000 7,000 8,000 9,000
Q1 Q2 Q3 Q4 Q1 Q2 Q3 Q4 Q1 Q2 Q3 Q4 Q1
2007 2008 2009 2010
USD/MTon
Country Value % Share % Growth % Growth
(mill. USD) q.t.q y.o.y
India 716 31.5 -34.4 17.0
European Union 451 19.8 -32.8 50.2
China 246 10.8 -40.9 -10.6
Malaysia 168 7.4 -44.5 257.3
Singapore 144 6.3 17.2 158.2
Others 546 24.0 -40.7 36.3
Total 2,271 100.0 -35.6 34.3
83% CPO’s market in India, while in China, Indonesia
ranks the second supplier after Malaysia with a share
of 31.5%.
Chart 6 World CPO Price
Chemical Products
In Q1/2010, export of chemical products
reached USD1.9 billion or contracted by 2.0%
(q.t.q.), primarily as a result of declining export volume
(-22.4%, q.t.q). The down sliding exports occurred
mainly to Malaysia and European Union. On annual
basis, however, the exports performance of chemical
products still improved and grew by 52.4% (y.o.y) in
Q1/2010 higher than the preceding period (28.7%,
y.o.y).
Exports performance of chemical products and
products containing chemical materials to European
Union (EU) was slightly hampered by the
implementation of REACH (Registration, Evaluation,
and Authorization of Chemicals) by the European
Union. REACH was the new regulation on the safe
use of chemical materials. REACH was gradually
applied since June 2007 until year 2018. Currently,
REACH is still in the stage of registration and each
product entering EU countries shall be accompanied
by reports that contain data of raw material
composition of the products, mainly related to any
chemical content. This report is then registered to the
ECHA (European Chemicals Agency).
Table 12
Exports of Chemical Products to Major Countries of Destination
Electrical Appliances
Exports of electronic products in Q1/2010
reached USD2.9 billion or dropped by 4.0% from the
previous quarter. The decreased exports value was in
line with the declining volume of 3.4%.
The decline in export was mainly to Japan (down
15.9%), United States (-12.2%) and Hong Kong
(-7.1%). The competition from China diminished
Indonesian’s portion of electronic exports. On an annual
basis, however, the performance of electronic exports
still grew 41.7% (y.o.y), higher than the previous
quarter (16.2%, y.o.y).
Table 13
Electronic Exports to Major Countries of Destination
Paper
Paper exports in Q1/2010 reached USD1.2 billion
or dropped by 2.9% from the previous quarter.
Although paper prices in the international market
increased, the value of exports declined due to the
decreased volume of 8.3% (q.t.q), as the result of lower
supply of raw materials. Raw materials that had to be 0
200 400 600 800 1,000 1,200 1,400
Q1 Q2 Q3 Q4 Q1 Q2 Q3 Q4 Q1 Q2 Q3 Q4 Q1
2007 2008 2009 2010
USD/MTon Country Value % Share % Growth % Growth
(mill. USD) q.t.q y.o.y
China 316 16.7 21.7 107.4
Japan 158 8.4 17.7 69.0
European Union 184 9.7 -2.0 56.0
Malaysia 136 7.2 -3.9 21.3
Singapore 130 6.9 11.6 89.2
Others 965 51.1 -11.3 38.9
Total 1,889 100.0 -2.0 52.4
Q.I-2010
Country Value % Share % Growth % Growth
(mill. USD) q.t.q y.o.y
Singapore 646 22.6 1.4 33.4
European Union 418 14.6 -6.8 56.4
Japan 336 11.8 -15.9 31.7
USA 324 11.3 -12.2 20.7
Hongkong 135 4.7 -7.1 106.1
Others 998 34.9 2.1 47.8
Total 2,857 100.0 -4.0 41.7
imported was conifer, a sort of wood with long and
sharp leaves, used as raw materials of pulp. Although
paper exports declined compared to previous period
(q.t.q), but compared to the same period in the
previous year, the export performance recorded positive
growth (24.0%, y.o.y), higher than the preceding
period (15.9%,y.o.y).
Paper exports in this period was mainly intended to
China (share 14.5%), Japan (11.4%) and South Korea
(6.8%).
Table 14
Paper Exports to Major Countries of Destination
1.2. Non-Oil and Gas Imports
In Q1/2010, non-oil & gas imports reached
USD22.0 billion (f.o.b), higher than USD20.8 billion
(f.o.b) in the preceding quarter. The increase of non oil
and gas imports was also reflected in the annual growth
that jumped from -8.4 % (y.o.y) in Q4/2009 to 44.5%
(y.o.y) in the reporting period which was driven by rising
domestic demand.
Chart 7
Economic Growth and Non-Oil and Gas Imports
Imports of consumption goods increased by
25.9% (q.t.q), followed by imports of raw material
which also rose by 6.7% (q.t.q). Meanwhile, imports of
capital goods fell 0.9% from the preceding period.
Table 15
Imports of Non-Oil and Gas Based on Types of Goods (C&F)
Most of the imported goods were from Asian
region such as China, Japan, and Singapore. The other
countries of origin of Indonesian imports were the
United States and the European Union.
Table 16
Imports of Non-Oil and Gas Based on Major Countries of Origin (C&F)
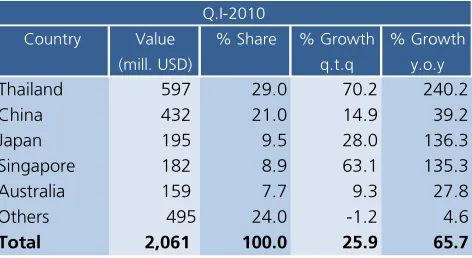
Imports of Consumption Goods
In Q1/2010, imports of consumption goods posted
USD2.1 billion or grew by 25.9% compared to the
preceding quarter. Consumer goods that mostly
imported were semi-durable goods, processed foods &
beverages for household, milk and dairy products,
motor vehicles and non-industrial transport equipment.
Country Value % Share % Growth % Growth
(mill. USD) q.t.q y.o.y
China 174 14.5 -10.9 4.3
Japan 137 11.4 1.3 18.1
South Korea 82 6.8 1.1 127.5
Malaysia 81 6.7 26.2 42.2
USA 60 5.0 -24.9 20.5
Others 667 55.5 -2.1 22.9
Total 1,202 100.0 -2.9 24.0
Q.I-2010 -40 -30 -20 -10 0 10 20 30 40 50 4.0 4.5 5.0 5.5 6.0 6.5
Q1 Q2 Q3 Q4 Q1 Q2 Q3 Q4 Q1*
2008 2009* 2010
Gross Domestic Product Non Oil & Gas Growth (y.o.y) - RHS
%, y.o.y %, y.o.y
Sumber: DSM dan DKM
Q4 Q1 Q4 Q1 Q4 Q1
Consumption Goods
Value 7.3 8.6 -7.7 25.9 -14.6 65.7
Volume 4.5 7.8 -3.3 72.8 8.0 78.7
Raw Material
Value 66.3 66.9 10.2 6.7 -9.3 52.2
Volume 91.0 88.7 8.6 -2.5 21.3 66.7
Capital Goods
Value 25.4 23.7 13.2 -0.9 -5.3 22.1
Volume 4.5 3.5 27.8 -23.8 13.9 -6.7
Total
Value 100.0 100.0 9.5 5.8 -8.4 44.5
Volume 100.0 100.0 8.7 -0.1 20.3 63.1
% Share % Growth % Growth (q.t.q) (y.o.y)
Country Value % Share % Growth % Growth
(mill. USD) q.t.q y.o.y
China 4,101 17.2 3.2 48.9
Japan 3,509 14.7 22.1 65.6
Singapore 2,777 11.6 14.0 26.5
USA 2,227 9.3 1.3 39.1
European Union 2,033 8.5 -12.4 7.2
Others 9249 38.7 5.4 55.0
Total 23,896 100.0 5.8 44.5
On annual basis, imports of consumption goods
grew significantly from -14.6% (y.o.y) in Q4/2009 to
65.7% (y.o.y) in the reporting period. Imports of
consumption goods were mainly from Thailand (share
29.0%), China (21.0%), and Japan (9.5%). Types of
commodity imported from China were foods, beverages
and shoes.
Table 17
Imports of Consumption Goods Based on Major Countries of Origin (C&F)
Imports of Raw Materials
Imports of raw materials in Q1/2010 reached
USD16.0 billion (C&F), grew by 6.7% compared to
the previous period. The strengthening in imports
of raw materials was presumed in line with the increase
in production activities in manufacturing sector during
the reporting period. Compared to the same period in
the previous year, imports of raw materials grew rapidly
from -9.3% (y.o.y) in Q4/2009 to 52.2% (y.o.y).
Primary imported raw materials was hydrocarbon
which was chemical raw materials for pharmaceutical
industry. These raw materials have yet to be produced
domestically and imported from abroad. Besides
hydrocarbon chemicals, other imported raw materials in
Q1/2010 were spare-parts and accessories. Imports of
raw materials were mainly from Japan (share 14.8%),
China (12.8%) and Singapore (12.4%).
Table 18
Imports of Raw Material Based on Major Coutries of Origin (C&F)
Imports of Capital Goods
Imports of capital goods in Q1/2010 reached
USD5.7 billion (C&F) or fell 0.9% from the preceding
period. Types of imported capital goods in this period
were telecommunications equipment, aircraft and
equipment, motor vehicles for transportation industry
and electronic machinery & apparatus. The increasing
activities in communication technology and
transportation, as well as growth in the commercial
aviation industry in Indonesia encouraged imports of
these capital goods. Most capital goods were imported
from China (share 25.3%), Japan (15.3%) and the
United States (14.3%).
Although lower than the previous period, but
capital goods imports on an annual basis increased
significantly. The growth of capital goods imports
amounted to 22.1% (y.o.y), in contrast to the previous
quarter at -5.3% (y.o.y). The increase in imports was in
line with improving production and investment activities
in the country.
Country Value % Share % Growth % Growth
(mill. USD) q.t.q y.o.y
Thailand 597 29.0 70.2 240.2
China 432 21.0 14.9 39.2
Japan 195 9.5 28.0 136.3
Singapore 182 8.9 63.1 135.3
Australia 159 7.7 9.3 27.8
Others 495 24.0 -1.2 4.6
Total 2,061 100.0 25.9 65.7
Q.I-2010
Country Value % Share % Growth % Growth
(mill. USD) q.t.q y.o.y
Japan 2,372 14.8 24.3 72.7
China 2,049 12.8 -3.5 55.7
Singapore 1,979 12.4 36.2 36.6
USA 1,226 7.7 7.7 51.0
European Union 1,049 6.6 0.8 26.9
Others 7,310 45.7 0.0 54.6
Total 15,986 100.0 6.7 52.2
Table 19
Imports of Capital Goods Based on Major Countries of Origin (C&F)
2. Oil and Gas Trade Balance
In Q1/2010, oil and gas trade balance posted a
USD2.1 billion surplus, lower than USD3.0 billion
surplus recorded in Q4/2009. The improved of domestic
economic activities in Q1/2010, as reflected from the
economic growth of 5.7% (y.o.y), contributed to the
increase of oil import. In the midst of declining oil
export performance, this condition caused a higher
deficit in oil trade balance. Meanwhile, the surplus of
gas trade balance has also contracted due to the
decrease in LNG export volume and the transfer of LPG
production to fulfill the domestic demand. The higher
demand on LPG related to the conversion program from
fuel to LPG had led to a higher imports of LPG
compared to Q4/2009.
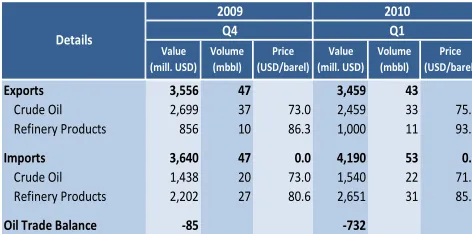
2.1. Oil
Oil trade balance experienced a USD732 million
deficit in Q1/2010, higher than deficit USD85 million in
Q4/2009, mainly due to the increasing of oil import
volume that was in line with the acceleration
ofdomestic economic activities. The increasing of oil
import volume was also driven by disturbance of
domestic fuel supply due to the maintenance of the
main refinery.
Table 20 Oil Trade Balance
Oil exports during the reporting period was
recorded USD3.5 billion or contracted by 7.4%
compared to the preceding quarter. This was mainly
due to the decrease of crude oil exports from USD2.7
billion to USD2.5 billion. Indonesian crude oil export
destinations were mainly Australia, Japan, United State
and Korea.
Oil imports was recorded USD4.2 billion, higher
than the preceding quarter (USD3.6 billion). This
increase, both for crude oil and refinery products, was
presumed to fulfill domestic oil demand as the
implication of the escalating domestic activities. The
increasing of oil import was also driven by interference
of domestic fuel supply due to the refinery maintenance
activities. The upturn of oil import was also contributed
by the increase of oil prices. In line with world oil price
movement, the average of import oil price¹ during the
reporting period rose from USD77.4/barrel to
USD79.5/barrel.
Similar to the previous periods, crude oil import
was used as intake to several refineries such as Cilacap,
Balikpapan and Balongan, being the main refineries of
oil domestic supply. Crude oil for refinery intake were
mainly originated from Saudi Arabia (Arab Light Crude),
Sudan (Nile Blend) and crude oil from Brunei, China and
Malaysia.
Country Value % Share % Growth % Growth
(mill. USD) q.t.q y.o.y
China 1,436 25.3 8.7 46.3
Japan 870 15.3 15.4 53.5
USA 813 14.3 -8.7 28.6
Singapore 498 8.8 -35.7 -10.0
Thailand 411 7.2 21.8 208.5
Others 1,644 29.0 -0.2 -7.6
Total 5,672 100.0 -0.9 22.1
Q.I-2010
Exports 3,556 47 3,459 43
Crude Oil 2,699 37 73.0 2,459 33 75.1
Refinery Products 856 10 86.3 1,000 11 93.5
Imports 3,640 47 0.0 4,190 53 0.0
Crude Oil 1,438 20 73.0 1,540 22 71.4
Refinery Products 2,202 27 80.6 2,651 31 85.1
Oil Trade Balance ‐85 ‐732
Sources: BPMigas & PT Pertamina (Processed)
Table 21
Demand and Supply of World Oil
The increasing of world oil price was reflected
from the movement of crude oil price of OPEC basket
and WTI with an average rise from respectively
USD74.3/barrel and USD76.1/barrel to USD75.5/barrel
and USD78.7/barrel. Several economic variables in
various countries indicates the world economic recovery
became the main contributing factor that pushed
upward trend of world oil price movement, even
though there was a Greek debt crises along that period.
Based on OPEC report, oil demand in Q1/2010 was
lower than the preceding period. However, demand
was still increased compared to the same period in the
previous year. By assuming that OPEC still provides oil in
accordance with the volume of Q4/2009, the
increasing demand indicated that there would be a
deficit in the world oil balance. This condition was
confirmed that oil price movement was triggered by the
expectation of improving economic growth.
Chart 8 World Oil Prices
In the reporting period, the average Indonesian
oil production reached 0.955 million barrel per day
(mbpd), higher than the production of the previous
quarter (0.951 mbpd). This condition was driven,
among others, by the implementation of steps
in optimizing production with the objective of
sustaining natural declining in old wells which
experiencing 12% drop every year. Despite the
increase in the reporting period, this production,
however, was still lower than the target stated in the
revised 2010 government budget or APBN-P 2010
(0.965 mbpd).
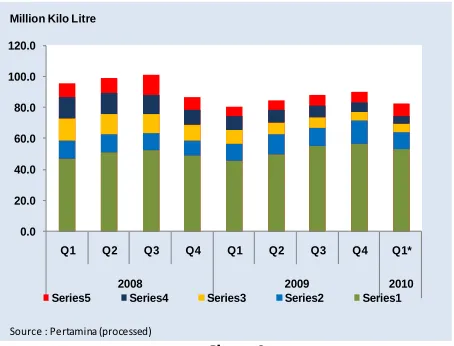
On the other hand, fuel consumption during the
reporting period decreased to 82.8 million barrel or
lower than Q4/2009 (89.7 million barrel). The fall in fuel
consumption during Q1/2010 was driven by the
decrease in use by industrial, household and
transportation sectors. The condition pertaining to the
first two sectors, industrial and household, was
presumed due to the policy of fuel conversion to
LPG/gas. Fuel consumption by electrical sector (PLN)
was still high due to, among others, the limited gas
supply for domestic market.
Chart 9 Fuel Consumption
2.2. Gas
Gas trade balance, as the main support of oil and
gas trade balance, recorded a USD2.8 billion surplus,
lower than USD3.1 billion surplus in Q4/2009. Based on 2010
Q1 Q2 Q3 Q4 Q1
Oil Demand
Northern America 25.5 24.2 23.5 22.9 23.2 23.4 23.6
China 7.6 8.0 7.6 8.4 8.6 8.3 8.1
Western Europe 15.3 15.3 14.9 14.2 14.6 14.8 14.5
Others 37.6 38.2 38.0 37.7 38.3 39.0 38.5
Total Oil Demand 86.0 85.7 84.0 83.2 84.7 85.5 84.7 Oil Supply
OPEC 30.2 31.2 28.5 28.5 28.9 29.0 0.0
Non OPEC 54.5 54.5 55.2 55.0 55.4 56.0 56.1
Total Oil Supply 84.7 85.7 83.8 83.5 84.3 85.0 n.a
Netto Demand ‐ Supply ‐1.4 0.0 ‐0.4 0.3 ‐0.4 ‐0.5 n.a
Source: OPEC Oil Monthly Report ‐ Januari 2010 Details
(in mbpd) 2007 2008
2009 30 40 50 60 70 80 90 100 110 120 130 140
Jul Sep Nov Jan Mar May Jul Sep Nov Jan Mar May Jul Sep Nov Jan Mar
2008 2009 2010
USD/barel
SLC
Indonesia's Export Price WTI
OPEC
Source: OPEC, Ditjen Migas
0.0 20.0 40.0 60.0 80.0 100.0 120.0
Q1 Q2 Q3 Q4 Q1 Q2 Q3 Q4 Q1*
2008 2009 2010
Series5 Series4 Series3 Series2 Series1 Million Kilo Litre
its components, LNG and natural gas export still made
the biggest contribution in reaching gas trade balance
performance. Meanwhile, the declining surplus was
influenced by the decreasing LNG export volume
(seasonal factor) and the transfer of LPG export
production in order to fulfill domestic LPG demand.
All cargo of LNG and natural gas products was
exported in fulfillment of the current contract. Exported
LNG during the reporting period was recorded USD2.2
billion, lower than the previous quarter amounting to
USD2.3 billion. This decrease was pertaining to the
declining export volume from 301 million mmbtu to
277 million mmbtu while natural gas posted a slight
increase from 78 million mbtu (USD824 million) in
Q4/2009 to 84 million mbtu (USD853 million). Domestic
demand for LPG grew as the implication of household
fuel conversion program from kerosene to LPG. In
response to this program, there was no LPG export in
Q1/2010.
Table 22 Gas Trade Balance
3. Services Account
The deficit on services account in Q1/2010 reached
USD3.6 billion, lower than the deficit in the preceding
quarter (deficit of USD4.6 billion). The decreased deficit
was among others triggered by the improved surplus of
travel services pertaining to the decrease of Indonesian
travelers abroad, which had soared in the previous
quarter related to hajj pilgrimage season. Meanwhile,
in line with the increase of domestic economic activities,
the transportation expenses related to imported goods
rose during the reporting period. The improved
domestic economic activities also raised the deficit of
construction and financial services.
Chart 10 Services Account
In contradiction with the deficit of USD41 million
in Q4/2009, tourism sector (travel services) recorded a
USD364 million surplus. Travel expenses fell from
USD1.7 billion to USD1.3 billion due to the absence of
foreign exchange expenses for hajj pilgrimage in the
reporting period. Meanwhile, foreign exchange revenue
from international travelers visiting Indonesia declined
to USD1.6 billion compared to the previous quarter
(USD1.7 billion).
Chart 11 Travel Services
The number of international travelers visiting
Indonesia (inbound traveler) in Q1/2010 reached 1,642
thousand people, slightly lower than 1,726 thousand Exports
LNG 2,326 301 7.8 2,169 277 7.8
LPG 48 88 545.5 ‐ ‐ ‐
Natural Gas 824 78 10.5 853 84 10.1
Trade Balance 3,091 2,812
Exports 3,198 3,022
Imports 107 210
* LNG and Natural gas in million mmbtu, LPG in thousand Metric Ton ** LNG and Natural Gas in USD/million mmbtu, LPG in USD/thousand Metric Ton Source: BPMIGAS
2009 Details Value (million USD) Tw. IV Volume* 2010 Tw. I Value
(million USD) Volume* Price** Price** -5000 -4000 -3000 -2000 -1000 0 1000
Q.1 Q.2 Q.3 Q.4 Q.1 Q.2 Q.3 Q.4 Q.1 Q.2 Q.3 Q.4 Q.1
2007 2008 2009* 2010*
Transportation Travel Other services Services, net million USD
-1,000.00 -800.00 -600.00 -400.00 -200.00 0.00 200.00 400.00 600.00 800.00
J F M AM J J A S O N D J F M AM J J A S O N D J F M AM J J A S O N D J F M
2007 2008 2009 2010
people in Q4/2009 but still better than the same
period in the previous year (1,464 thousand people).
Several international tourism events organized by
Ministry of Culture and Tourism contributed to
the inflow of inbound travelers to Indonesia. Several
examples of international events are Strait Regata,
international water sport competition in Batam, Borneo
International Kite Festival in Balikpapan in February with
the participation of 15 countries and The Java Jazz
Festival in Jakarta in March involving 65 international
musicians.
Unlike the previous quarter, majority inbound
traveler are from Malaysia (share of 16.2%), Singapore
(14.8%) and Australia (10.4%). Bali was still the favorite
destination of international travelers visiting Indonesia
(share of 34.8%), followed by Jakarta (26.2%) and
Batam (15.0%).
The number of Indonesian people going abroad in
Q1/2010 also dropped from 1,673 thousand people to
1,486 thousand people. The significant downturn was
related to the absence of hajj pilgrimage season. The
drop was followed by the decrease of foreign exchange
expenses from USD1,742 million to USD1,253 million.
Asia-Oceania countries remained the main
destination of Indonesian travelers, such as Singapore
(share of 31.5%), Malaysia (27.5%), Australia (8.4%)
and Thailand (5.0%). For North American region, the
US (3.6%) was still the main destination of Indonesian
travelers.
In Q1/2010, transportation services recorded a
USD2,931 million deficit, slightly higher than in
Q4/2009 (deficit of USD2,848 million). This increased
deficit was mainly triggered by the expanding foreign
exchange expenses for freight services related to the
rise of imports. The effort in minimizing this deficit
through the empowerment of national shipping
industry (cabotage) was still restrained by several issues
such as lack of domestic banking support for fleet
procurement, especially related to the obligation of
providing additional collateral (such as in the form of
land or house certificate) amounting to as high as 60%
of the total loan. .
Other business services in the reporting period
recorded a lower deficit (deficit of USD0.4 billion)
than the preceding period (deficit of USD1.0 billion).
This declining deficit was mainly driven by the
lowering rental expenses of heavy equipment and
transportation equipment. As in the previous years,
transportation and mining companies generally
settled their payments with foreign partners for the
operational leasing of heavy/transportation equipment
at the end of every years.
4. Income Account
The income account in Q1/2010 posted a USD4.0
billion deficit, lower than USD4.6 billion deficit in the
preceding quarter. The declining deficit was mainly
triggered by the decrease of dividend payments of
direct investment and interest payments of other
investment. This was despite of the increase of interest
payments of portfolio investment. In the mean time, net
transaction pursuant to compensation of employees,
generated from the difference between salaries of
Indonesian labor working abroad for period less than
one year and salaries of foreigners working in Indonesia
with the same duration, during the reporting period
was relatively stable.
Chart 12 Income Account -5,000
-4,500 -4,000 -3,500 -3,000 -2,500 -2,000 -1,500 -1,000 -500 0
Q.1 Q.2 Q.3 Q.4 Q.1 Q.2 Q.3 Q.4 Q.1 Q.2 Q.3 Q.4 Q.1
2007 2008 2009* 2010*
Income, net Inv. Income DI Income
The income from direct investment posted a
USD2.6 billion deficit, lower than USD2.7 billion in the
preceding quarter. The drop in deficit was mainly
triggered by the decrease of profit transfer of oil and
gas companies to USD1.3 billion from USD1.4 billion in
the previous period. This condition was related to the
payment schedule of profit transfer that was generally
implemented during the last quarter of the year.
Income from other investment also recorded
a declining deficit, reaching USD0.4 billion from
USD0.9 billion previously. This was due to
interest payment schedule of government loan
which was generally lower in Q1 and Q3. In the same
period, the lowering corporate interest payment in line
with the declining position of foreign debt in the
preceding quarter had decreased the deficit of other
investment income.
On the other hand, the income from portfolio
investment posted a USD809 million deficit in Q1/2010,
higher than USD790 million in the preceding quarter.
The rise in deficit was mainly triggered by the increase
of interest payment of domestic bonds owned by
non-residents.
In line with the growth of foreign ownership
on government bonds denominated in Rupiah
(SUN) and Bank Indonesia Certificate (SBI), the
payment of SUN coupons in Q1/2010 increase to
USD784 million compared to USD427 million in the
preceding period, and the payment of SBI interest to
non-residents also increased from USD90 million to
USD122 million.
5. Current Transfers
In Q1/2010, the current transfer posted a USD1.2
billion surplus slightly lower than USD1.3 billion in the
previous quarter. This lowering surplus was contributed
by the declining of remittance inflows from Indonesian
working abroad, and after taking into account the
remittance outflows of foreigners working in Indonesia.
The other related factor was the drop of
non-investment grant received by the government from
donor institutions during the reporting period.
Chart 13 Workers’ Remittances
In the reporting period, revenues from remittances
of Indonesian working abroad reached USD1,650
million, lower than USD1,707 million in the previous
quarter. This decreased inflows of remittances was
presumed related to the diminishing number of
Indonesian workers abroad since mid 2009 up to the
reporting period. Likewise, outflows from remittances
of foreign workers in Indonesia slightly declined from
USD445 million to USD441 million.
In the mean time, the total inflows related to
non-investment grants reached USD52 million in the
reporting quarter, lower than USD61 million in 4/2009.
Most of the grants were received by Non-Government
Organization (NGO) managed by private sector. Grants
received by private sector during this quarter were,
among others, the aid from German government
amounting to Euro7.5 million (around USD10 million) to
the Indonesian Forest Ecosystem Conservation
Foundation (KEHI) for the safety and protection of
tropical rain forest in Sumatera and an amount of
USD65 thousand from Japanese government to the
Faculty of Letters of Dr. Soetomo University related to
-1000 -500 0 500 1000 1500 2000
Q.1 Q.2 Q.3 Q.4 Q.1 Q.2 Q.3 Q.4 Q.1 Q.2 Q.3 Q.4 Q.1
2007 2008 2009* 2010*
the supply of language laboratory equipment. During
the same period, the government also received a
USD182 thousand grant from the Japanese government
destinated for the regional government of East
Java for the school renovation in Jombang, Mojokerto
and Sidoarjo.
Table 23 Non Investment Grant
(Million USD) Non Investment Grant
(Current Transfers) Q.1. Q.2. Q.3. Q.4. Q.1.
Total 73 31 40 61 52
Government 4 14 20 52 3
Private 69 17 20 9 49
Source: Financial Department
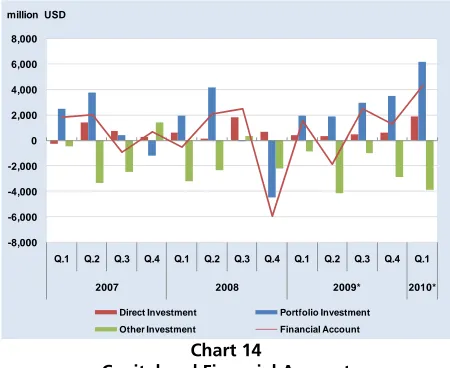
In line with the strengthening global liquidity,
capital and financial account in Q1/2010 posted a
significant surplus of USD4.3 billion, higher than
USD1.3 billion surplus in the previous quarter. This
improved performance was driven by the inflow of
portfolio investment and direct investment despite the
growing deficit in other investment.
Chart 14
Capital and Financial Account
The increase of portfolio investment surplus
was contributed by the increasing foreign
ownership on government bonds denominated in
Rupiah (SUN) and Bank Indonesia Certificate (SBI). The
sound and relatively stable domestic macroeconomic
condition, the weakening US dollar exchange rate and
Greek sovereign debt problem were among the
contributing factors of foreign capital inflows to
Asian region including Indonesia. The strengthening
Indonesian investment climate and economic
prospect, reflected on the improved sovereign
rating of Indonesia from BB to BB+ by Fitch Ratings,
has supported inflows of direct and portfolio
investment.
1. Capital Account
The capital account in Q1/2010 recorded a USD18
million surplus, slightly higher than a USD14 million
surplus in the previous quarter. This surplus was
contributed mainly by investment grants such as those
for construction of schools, housing and armaments.
Table 24 Investment Grant
2. Financial Account
The financial account in Q1/2010 recorded a
USD4.3 billion surplus, jumped from the preceding
period (USD1.3 billion surplus). This improvement was
attributed by the surplus in portfolio investment and
direct investment which was higher than the increase of
deficit in other investment. The improved condition of
global liquidity and favorable rate of return had driven
capital inflows of portfolio investment. It was reflected
in the purchase of domestic securities by foreign
investors such as SUN and SBI as well as foreign
currency-denominated government bond. The increase
surplus both of public portfolio investment and public
other investment supported the amplify surplus of
financial account in public sector amounting to USD6.7
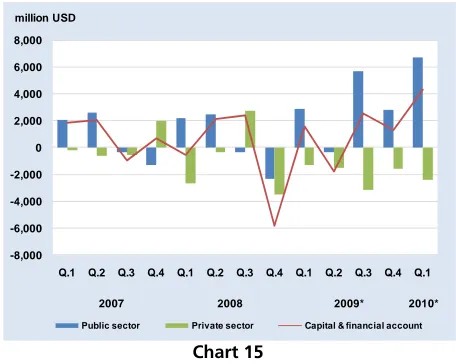
billion. The surplus in public sector managed to -8,000
-6,000 -4,000 -2,000 0 2,000 4,000 6,000 8,000
Q.1 Q.2 Q.3 Q.4 Q.1 Q.2 Q.3 Q.4 Q.1 Q.2 Q.3 Q.4 Q.1
2007 2008 2009* 2010*
Direct Investment Portfolio Investment
Other Investment Financial Account million USD
(Million USD)
Investment Grant
(Capital Transfers) Q.1. Q.2. Q.3. Q.4. Q.1.
Total 19 29 34 14 18
Government 2 3 4 2 0
Private 17 26 30 12 18
Source: Financial Department
2010* 2009*
compensate the deficit (USD2.4 billion) of financial
account in private sector.
Chart 15
Capital and Financial Account by Sector
2.1 Public Sector
During the period of Q1/2010, financial account in
public sector recorded USD6.7 billion surplus, higher
than the preceding period (USD2.8 billion surplus). This
increased surplus was triggered by the surpluses of
portfolio investment and other investment.
Chart 16
Financial Account of Public Sector
Portfolio Investment
Portfolio investment in public sector recorded a
USD6.6 billion surplus, higher than a USD2.4 billion
surplus in the preceding quarter. This surplus was
mainly resulted from the purchase of SBI and
government’s rupiah bond (SUN) by foreign investors
and supported by the issuance of foreign
currency-denominated government bonds.
Transaction on SBI by foreign investor during the
reporting period recorded a USD2.0 billion surplus,
higher than the USD0.8 billion surplus in the preceding
period. SUN transaction also recorded an increased
surplus from USD1.4 billion to USD2.4 billion. Foreign
capital inflows on SBI or SUN was supported by the
improving external factors and the stable of domestic
macroeconomic development.
The improvement of global market was driven by
the clear solution with regards to Greek fiscal deficit
financing involving the European Union and IMF and
the ongoing improvement on global economic
fundamental. This improved condition of global
financial market subsequently contributed to the
foreign capital inflows to domestic market.
Meanwhile, the strengthened domestic economy
and investment climate supported a better risk
perception for domestic investment which was reflected
in Indonesian rating improvement granted by
international rating agency, Fitch and S&P. Fitch rose
Indonesian long term credit rating from BB to BB+ with
stable outlook. In addition, Fitch also raised Indonesia’s
country ceiling rating from BB+ to BBB, while rating for
short-term credit remained at B. S&P also raised
Indonesia’s sovereign credit rating from BB- to BB with
positive outlook. With reference to this achievement, it
should not be long for Indonesia to reach investment
grade.
Table 25
Indonesia’s Sovereign Rating
-8,000 -6,000 -4,000 -2,000 0 2,000 4,000 6,000 8,000
Q.1 Q.2 Q.3 Q.4 Q.1 Q.2 Q.3 Q.4 Q.1 Q.2 Q.3 Q.4 Q.1
2007 2008 2009* 2010*
Public sector Private sector Capital & financial account
million USD -4000 -2000 0 2000 4000 6000 8000
Q.1 Q.2 Q.3 Q.4 Q.1 Q.2 Q.3 Q.4 Q.1 Q.2 Q.3 Q.4 Q.1
2007 2008 2009* 2010*
Portfolio Investment Other Investment Financial Account
million USD
October 22, 2007 Ba3 July 26, 2006 BB- January 27, 2005
BB-December 23, 2008 Ba3* November 7, 2008 BB-* February 14, 2008 BB
June 11, 2009 Ba3** October 23, 2009 BB-*** January 21, 2009 BB*
September 16, 2009 Ba2 March 12, 2010 BB January 25, 2010 BB+
October 12, 2006 BB September 7, 2007 BB
October 31, 2007 BB+ September 25, 2008 BB*
January, 2009 BB+* February 5, 2009 BB**
October 7, 2009 BB+* July 7, 2009 BB+
* rating affirmation
** outlook revised from positive to stable *** outlook revised from stable to positive Note: Foreign Currency Long Term Debt
Rating and Investment
Information (R&I) Japan Credit Rating Agency
The improved risk perception was also indicated by
several risk indicators that remained at the low level.
Indonesia’s Credit Default Swap (CDS), as one of risk
indicators, still remained at low level (163 bps). Similar
tendency was reflected from yield spread between
Indonesian government bond and US T-Note
experiencing a decline. The same condition was also
indicated by Emerging Markets Bond Index Global
(EMBIG) movement that showing a downturn tendency
from level 294 bps at the end of the previous reporting
period to 261 bps at the end of Q1/2010.
Chart 17
Indonesia’s Yield Global Bond and US T-Note
The ongoing improvement of risk perception in
the reporting period bolstered the attractiveness
of rupiah-denominated investments. The yield of rupiah
were reflected in the level of Uncovered Interest Parity
(UIP) which was kept at 6.33%, still the
highest compared to other Asian countries. Covered
Interest Parity (CIP) indicator at the end of reporting
period stood at 4.69%, the highest level in the same
region.
The attractiveness of rupiah-denominated
investment can be shown on the spread of Bank
Indonesia (BI) rate and Fed Fund Rate, as one of
references of interest rate for global investors. Up to
the end of the reporting period, BI rate was sustained at
6.5%, while the Fed still