Analysis: investors
Measuring progress to zero deforestation
January 2015
To address their role in forest
risk commodity supply
About the Forest 500:
The Forest 500 project identifies, ranks, and tracks the governments, companies and financial institutions that together could virtually eradicate tropical deforestation from global commodity supply chains. It measures progress towards ambitious zero deforestation goals by assessing the public policies of these key powerbrokers. Contact:
To contact the Forest 500 team, please write to [email protected]
Citation:
Please cite this publication as:
Rautner, M., Lawrence, L., Bregman, T., and Leggett, M. 2015. The Forest 500. Global Canopy Programme. About the Global Canopy Programme: The Global Canopy Programme (GCP) is a tropical forest think tank working to demonstrate the scientific, political and business case for safeguarding forests as natural capital
–
that underpins water, food, energy, health and climate security for all. GCP works through its international networks – of forest communities, science experts, policymakers, and finance and corporate leaders – to gather evidence, spark insight, and catalyse action to halt forest loss and improve human livelihoods dependent on forests.
Disclaimer:
The contents of this report may be used by anyone providing acknowledgement is given to the Global Canopy Programme. No representation or warranty (express or implied) is given by the Global Canopy Programme or any of its contributors as to the accuracy or completeness of the information and opinions contained in thisreport.
‘The Global Canopy Programme’ the activities of which are
hosted by The Global Canopy Foundation, a United Kingdom charitable companylimited by guarantee, charity number 1089110.
Contents
Key observations
1
Overview and categorisation
1
Overview of scores
2
Zero deforestation policies
3
Scores by location of headquarters
3
Scores by institution type
4
Policy content, strength and implementation
5
Overall forest policy
5
Policy strength
6
Policy implementation
6
1
This is an introductory and high level analysis of how the different investors and lenders included in the Forest 500 score in relation to their development and adoption of policies for forest risk commodities. In the future, the Forest 500 platform aims to expand on this to include interactive graphs that will allow visitors to carry out their own analyses of critical issues.
Key observations
A number of key observations can be made when analysing how investors score in relation to specific forest risk commodity policy indicators.
With collective shareholdings in the publicly listed Forest 500 companies worth around US$1.7 trillion, these investors are in a unique position to ensure a rapid transition to a zero deforestation economy, yet most have poor sustainable investment policies.
While some investors have developed policies that integrate sustainability criteria into the financial lending process, with an average total score across these financial institutions of just 18 out of 100, the overall picture is worrying and there is much progress to be made.
Furthermore, of the financial institutions assessed, none have made overall zero or net zero deforestation pledges associated with their operations.
Assessments show that investors headquartered in Europe tend to have more developed sustainable investment policies than those headquartered in North America and the Asia-Pacific region.
In total, 78 of the 150 investors included are headquartered in North America, with investors from the US accounting for 77% of the total shareholdings identified in the publicly listed Forest 500 companies.
Banks generally score higher than other types of investors. While, of those assessed, sovereign wealth funds and hedge fund managers have been found to have no sustainable investment policies in place.
Of the 69 investors found to have either specific or overall sustainability policies in their investment strategies, 10 have no clear implementation policies, while only 7 have been found to apply these policies across all
investments. For the most part, investors are adopting a soft-screen approach whereby sustainable
investment principles only apply to investments meeting certain criteria.
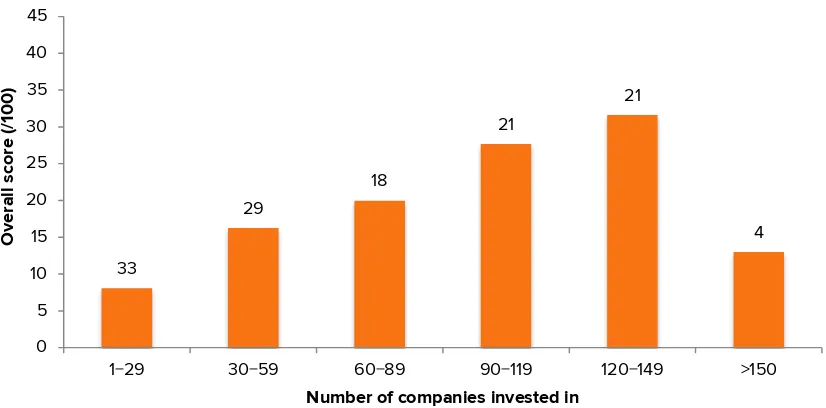
Investors holding shares in a greater number of companies included in the Forest 500 generally score better than those with shares in fewer Forest 500 companies.
Overview and categorisation
The investors, lenders and other financial institutions included in the Forest 500 represent the major powerbrokers in the financial sector in terms of being the most influential in being able to increase the sustainability of forest risk commodity supply chains. These investors have the potential to contribute to ensuring a transition to a zero deforestation economy.
The powerbrokers listed in this category include those with the largest shares in the publicly listed Forest 500 companies, with collective shareholdings worth around US$1.7 trillion. Also included are the world’s largest banks,
sovereign wealth funds and pension funds, which although may not currently invest substantially in the relevant companies, are included as their overall size and large portfolios give them a high risk of exposure to forest risk commodity supply chains.
2
To analyse how different investors and lenders and types of financial institution vary in their application of sustainability policies, particularly in relation to forest risk commodities, a number of data points have been collected. This includes information on geographical distribution (i.e. country of headquarters), institution type (i.e. pension fund, bank, etc.), the total number of publicly listed Forest 500 companies invested in, and the total value of the shareholdings in these companies.
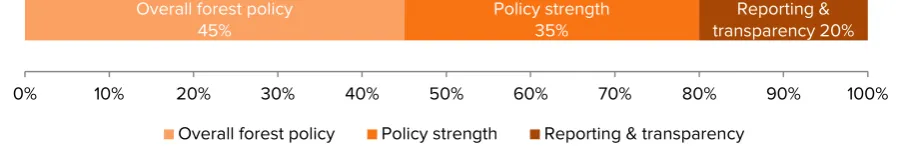
To assess the strength of investor sustainability policies and the extent to which they are applied, investors have been scored relative to policy indicators within three overarching categories: overall forest policy; policy strength; and reporting and transparency. Investors have been scored based on their publicly available policies and information and could achieve a total of 100 points. Figure 1 shows the weighting of individual indicator categories and the
corresponding maximum points achievable. Further details of the scoring process can be found in the Scoring
methodology in the Methodology section of the Forest 500 platform. Results of individual investor assessments can be found in the Investors section of the Forest 500 platform, where ultimately each institution has been awarded from zero to five points for each 20 per cent increase out of the maximum 100 points. For the analysis in this report, scores out of 100 have been used unless noted otherwise.
Figure 1. Breakdown of scores showing the relative weighting of points between the three indicator categories.
Regional distribution of investors and lenders
The investors and lenders listed in the Forest 500 are concentrated in certain geographic regions. Out of the 150 institutions included, the majority (78) are headquartered in North America, while 35 are based in the Asia-Pacific region, 34 in Europe, two in Latin America and just one in Africa; reflective of the location of traditional financial hubs. Notably, with respect to specific countries, 69 are headquartered in the United States and eleven are based in the United Kingdom and Japan, respectively.
The distribution of the total shareholdings of the publicly listed companies included in the Forest 500 across investors is also skewed towards North America, with investors from that region holding more than 80% of total shares and the US singularly holding 77%. Investors headquartered in the UK, Japan, Switzerland, and Canada each hold around 3% of total shareholdings.
Overview of scores
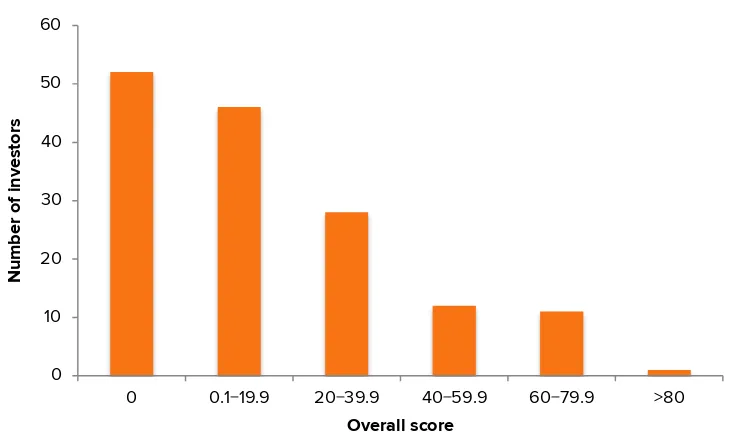
Overall the average score awarded to the institutions in the investor category for assessments of their environmental policies is just 17.8 out of 100. However, Figure 2 shows the high variation in scores achieved. Specifically, 52 investors scored zero while one investor scored more than 80 out of a possible 100 points. This suggests that although generally institutions in the financial sector have poor sustainable investment policies, it is possible for investors to attain
relatively high scores and there is ample scope for investors to improve their policies.
Overall forest policy
3
Figure 2. Distribution of overall scores achieved by investors
Investors have been categorised into 6 divisions based on their total points achieved.
Zero deforestation policies
There is growing momentum in the corporate sector towards eliminating deforestation from supply chains; with numerous zero and net zero deforestation commitments recently adopted by companies and industry associations, such as the Consumer Goods Forum (CGF)1. Despite this progress, the investment community is yet to take such steps, with none of the investors and lenders assessed as part of the Forest 500 found to have adopted their own overall zero or net zero deforestation policies.
However, given that some of the higher scoring financial institutions have well-developed policies that include statements on removing deforestation from the supply chains in which they invest, it is not inconceivable that such commitments could be made in the near future. For example, some of the more progressive investment policies exclude the financing of operations within High Conservation Value (HCV) forests. Furthermore, some investors
broaden this so as to preclude financial support for the extraction of commodities from, or clearance of, all tropical moist forests. Formalising such policies into an overall zero or net zero deforestation commitment would be a welcome and logical next step.
Scores by location of headquarters
Although the investors included in the Forest 500 hold shares in companies operating worldwide, investment policies are likely to be influenced by the local and regional corporate cultures of where the institutions themselves are headquartered, with those in regions with more advanced conversations over sustainability likely to have similarly advanced sustainability policies. Financial institutions headquartered in the Asia-Pacific region were found to have overall scores lower than those in Europe (Figure 3) (note: investors headquartered in Latin America and Africa have not been included due to the small number based in these regions). Surprisingly however investors in North America scored more similarly to those in the Asia-Pacific region, achieving far fewer points than those based in Europe. Specifically, the mean score for North American investors was around 13 points, for those based in the Asia-Pacific region around just seven, and those in Europe around 37 points.
1
The Consumer Goods Forum. 2014. Achieving zero net deforestation. Sustainability Pillar. [Online] Available from: http://www.theconsumergoodsforum.com/strategic-focus/sustainability/our-sustainability-pillar [Accessed January 2015]
0 0.1−19.9 20−39.9 40−59.9 60−79.9 >80
4
Figure 3. Average total scores achieved by investors by region
The overall score received by investors for their sustainable investment policies, located in five regions; Africa, Asia-Pacific, Europe, Latin America, and North America. Labels show the number of investors based in each regions.
Scores by institution type
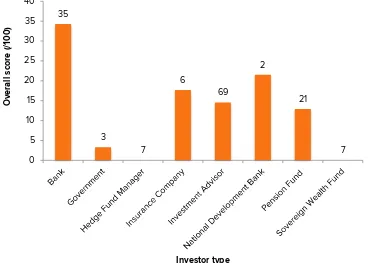
Scores assigned for sustainable investment policies were found to vary with institution type (Figure 4), with banks in particular achieving higher scores (mean 34.3) than other types of financial institution. Particularly striking is the lack of policies found when assessing the sovereign wealth funds and hedge fund managers included; each achieving scores of zero for their sustainable investment policies. It is important to highlight however that this may not be representative of these institution types as a whole and are conclusions that can be drawn only from those assessed in the Forest 500.
Figure 4.Total scores for each institution type.
Numbers above bars represent the number of institutions belonging to each category.
1
Africa Asia-Pacific Europe Latin America North America
5
Policy content, strength and implementation
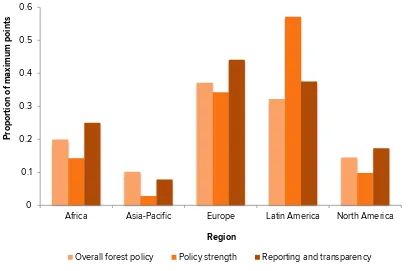
Investors and lenders have been scored for their sustainable investment policies relative to indicators in three categories: overall forest policy; policy strength; and reporting and transparency. Figure 5 shows the average proportion of the total score possible received by investors across the five regions for each of the individual indicator categories. For all regions where there was a sufficient sample of investors (i.e. Asia-Pacific, Europe, and North America), investors generally attained the most points proportionally for indicators of reporting and transparency and the least points for indicators of policy strength. However scores suggest that improvements across all areas are required.
Figure 5. Proportion of maximum points achieved by investors in each region for each policy indicator category.
Bars represent average values for each of the five regions.
Overall forest policy
The adoption of overall forest policies in which considerations related to deforestation and other environmental criteria are incorporated into decision making indicates ambition and is an essential first step in improving the sustainability of forest risk commodity supply chains. However, it is vital that the contexts of different commodity supply chains are understood and commodity-specific policies are developed to ensure that the specific negative impacts associated with the production of different commodities are mitigated.
Of the 69 investors with some form of overall forest policy, 27 were found to have policies related to specific
commodities. While this may appear encouraging, this equates to just 18% of all investors assessed. Furthermore, just eight investors had clear policies related to soya and beef production; suggesting that investors are yet to engage on sustainability issues associated with these industries. Although this is perhaps unsurprising given the recent attention paid to the sustainability of palm oil production and the past focus on the tropical timber trade, this highlights increased engagement in this area as a priority for future action.
0
Africa Asia-Pacific Europe Latin America North America
Prop
6
Policy strength
The presence of sustainable lending policies indicates a level of progress in investment practices but it is essential to acknowledge the content and strength of these policies. Assessments of policy strength included several questions: (1) whether policies are compulsory or recommendations to consider in the investment process; (2) whether companies that investors finance are required to seek sustainability certification for their operations; (3) whether companies invested in are required to exclude the use, trade or manufacture of products involving commodities originating from intact or High Conservation Value forests; and (4) whether companies invested in must have policies in place for ensuring the free, prior and informed consent (FPIC) of local communities and indigenous people for their operations.
Of the 69 investors with overall investment policies in place, 40 have policies that can be considered as
recommendations, while only 10 have compulsory policies that must be adhered to by the companies in which they invest. Furthermore, the remaining 19 were found to have policies that could not be regarded as either
recommendations or compulsory, as they simply acknowledge that environmental issues are a consideration in the lending process but provide no clear criteria of how they might be incorporated.
Meeting the criteria of credible certification schemes is increasingly stated to be a minimum requirement that
companies active in the supply chains of forest risk commodities should meet. Yet, only 16 investors included this as a criterion in their sustainable investment policies. Furthermore, of these, just six included this as a compulsory policy.
The value of forests in terms of biodiversity and contribution to wider ecosystem services has been acknowledged widely, yet they continue to be exploited unsustainably. Despite the acknowledged importance of intact forests, just 19 of the investors assessed were found to have a policy excluding the use of intact forests in their criteria for investment decisions, with just nine investors applying this criterion in a compulsory way.
The final indicator used to determine policy strength was the presence of an FPIC statement within the investment policy. Given the importance of land ownership issues in the current drive towards sustainable supply chains, it is somewhat surprising that only 17 of the investors assessed require companies in which they invest to undertake a process for obtaining FPIC, or a similar process of stakeholder engagement, for their new developments.
Policy implementation
Key to achieving success in the implementation of environmental policies is the presence of clear mechanisms for monitoring, reporting and transparency. Assessments of investors in the Forest 500 included three questions related to monitoring, reporting and transparency, related to: (1) public disclosure of progress; (2) the presence of procedures that ensure new investments are vetted against sustainability policies; and (3) the presence of specific procedures that ensure investments are monitored on an ongoing basis. Of the 69 investors with specific or overall sustainability policies related to their investments, ten were found to have no clear implementation process, while only seven were found to apply sustainability policies across all of their investments. Commonly, investors were found to be applying a
soft screen approach to policy implementation where only investments in companies in certain sectors or investments
meeting a certain value (usually US$10 million, in line with the Equator Principles2) are vetted against their own criteria. Furthermore, only 37 of the 69 investors with sustainability policies had clear procedures that ensured the ongoing monitoring of their investments.
7
Other indicators of well-developed policies
Diversified portfolio and total shareholdings in Forest 500 companies
Investors investing in a greater number of publicly-listed Forest 500 companies were found to score higher than those investing in fewer companies (Figure 6). Notably, those investors holding shares in between 120 and 149 Forest 500 companies received, on average, the highest overall scores for their sustainable investment policies (mean of 31.6), while those investing in between zero and 29 companies achieved the lowest scores (mean of 8.1) (note: comparison with investors holding shares in more than 150 companies has been disregarded as the sample is deemed too small to be representative). However, this pattern is not evident with varying values of total shareholdings held in the Forest 500 companies (Figure 7). In this case, the average score for investors remained similar regardless of whether the total value of shareholdings increased or not.
Figure 6. Total scores received relative to number of publicly listed Forest 500 companies invested in.
Numbers above bars represent the number of investors belonging to each category.
Figure 7. Total scores received relative to value of total shareholdings in publicly listed Forest 500 companies.
Numbers above bars represent the number of investors belonging to each category.
33
1−29 30−59 60−89 90−119 120−149 >150
O
Number of companies invested in
14
0−1.99 2−3.99 4−5.99 6−7.99 8−9.99 >10
8 For more information visit: www.forest500.org
Contact us at: [email protected] Follow us on Twitter: @Forest500
To find out about GCP’s work visit: www.globalcanopy.org